 Global| Jun 04 2020
U.S. Productivity and Unit Labor Costs Revised Up for Q1'20
by:Sandy Batten
|in:Economy in Brief
Summary
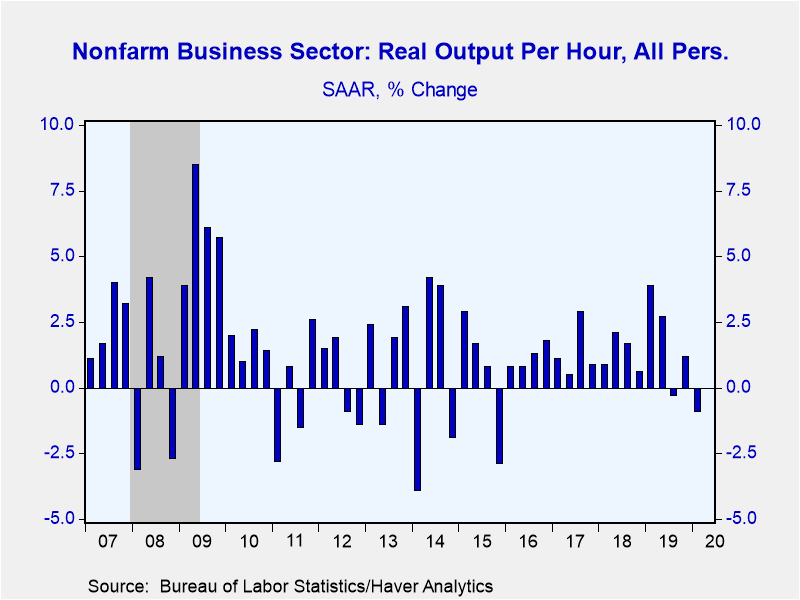
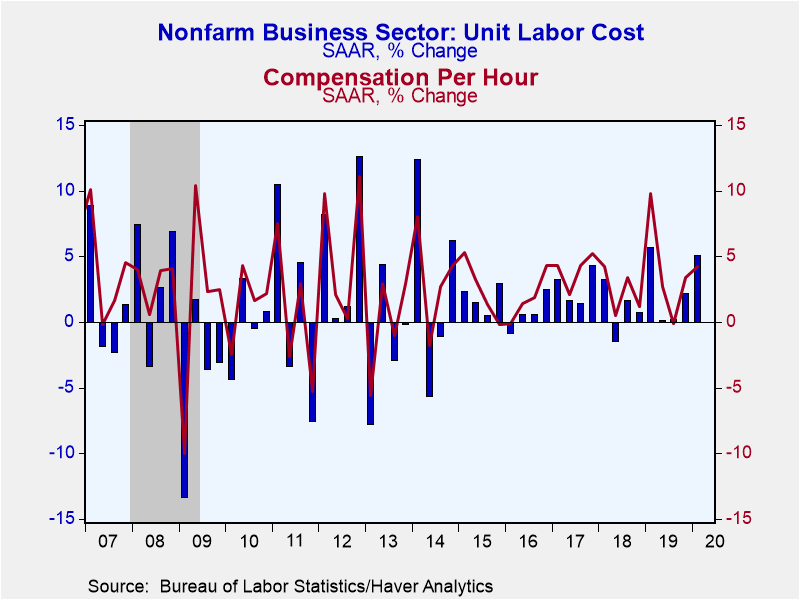
• Output per hour revised up on weaker hours worked. • Unit labor costs revised up on higher compensation. Productivity in the nonfarm business sector during Q1'20 was revised up to a 0.9% q/q (SAAR) decline from the initially [...]
• Output per hour revised up on weaker hours worked.
• Unit labor costs revised up on higher compensation.
Productivity in the nonfarm business sector during Q1'20 was revised up to a 0.9% q/q (SAAR) decline from the initially reported 2.5% drop. Output was revised weaker to a 6.5% q/q decline from the initially reported -6.2%. But hours worked was revised down to a 5.6% q/q decline from -3.8%. The BLS made numerous adjustments to their estimate of hours worked in the economy in an attempt to reflect at least in part the adverse impact of the coronavirus lockdown. Productivity growth is output growth minus hours worked growth. The upward revision to Q1 raised year-over-year productivity growth to 0.7% y/y from the initially reported 0.3%.
Compensation growth was revised up significantly to 4.2% q/q (SAAR) from the initially reported 2.2%. This pushed up unit labor costs even more to a 5.1% q/q increase from the previously published 4.8% gain.
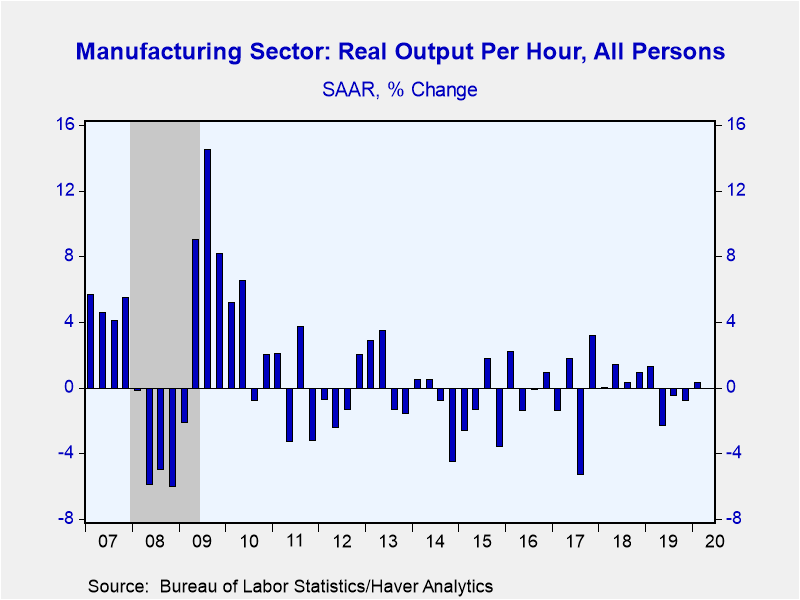
In the manufacturing sector, productivity was revised up even more than for the nonfarm business sector. The initially reported 3.3% q/q (SAAR) decline was revised up to a 0.3% q/q increase. This pushed up the year-over-year calculation to -0.8% from -1.7%. The Q1 decline in manufacturing output was revised up to -6.3% q/q from -7.1%. And hours worked was revised significantly weaker to a 6.6% q/q decline from the initially reported 3.9% quarterly fall.
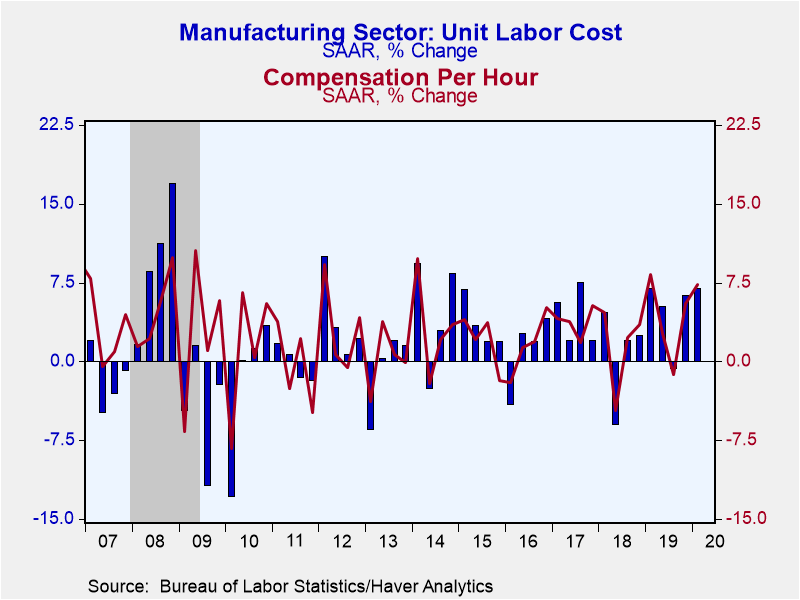
Compensation in the factory sector was revised up meaningfully to a 7.3% q/q increase from the previously published 0.2% q/q gain. So, even with the upward revision to productivity, unit labor cost growth shot up to 6.9% q/q from the initially reported 3.6% rise.
The productivity and labor cost figures are available in Haver's USECON database.
| Productivity & Costs (SAAR, %) | Q1'20 (Rev) | Q1'20 | Q4'19 | Q1 Y/Y | 2019 | 2018 | 2017 |
|---|---|---|---|---|---|---|---|
| Nonfarm Business Sector | |||||||
| Output per Hour (Productivity) | -0.9 | -2.5 | 1.2 | 0.7 | 1.9 | 1.4 | 1.3 |
| Compensation per Hour | 4.2 | 2.2 | 3.4 | 2.6 | 3.7 | 3.3 | 3.5 |
| Unit Labor Costs | 5.1 | 4.8 | 2.2 | 1.9 | 1.7 | 1.8 | 2.1 |
| Manufacturing Sector | |||||||
| Output per Hour (Productivity) | 0.3 | -3.3 | -0.8 | -0.8 | 0.1 | 0.4 | -0.4 |
| Compensation per Hour | 7.3 | 0.2 | 5.5 | 3.5 | 3.2 | 2.2 | 3.6 |
| Unit Labor Costs | 6.9 | 3.6 | 6.3 | 4.4 | 3.1 | 1.8 | 4.0 |
Sandy Batten
AuthorMore in Author Profile »Sandy Batten has more than 30 years of experience analyzing industrial economies and financial markets and a wide range of experience across the financial services sector, government, and academia. Before joining Haver Analytics, Sandy was a Vice President and Senior Economist at Citibank; Senior Credit Market Analyst at CDC Investment Management, Managing Director at Bear Stearns, and Executive Director at JPMorgan. In 2008, Sandy was named the most accurate US forecaster by the National Association for Business Economics. He is a member of the New York Forecasters Club, NABE, and the American Economic Association. Prior to his time in the financial services sector, Sandy was a Research Officer at the Federal Reserve Bank of St. Louis, Senior Staff Economist on the President’s Council of Economic Advisors, Deputy Assistant Secretary for Economic Policy at the US Treasury, and Economist at the International Monetary Fund. Sandy has taught economics at St. Louis University, Denison University, and Muskingun College. He has published numerous peer-reviewed articles in a wide range of academic publications. He has a B.A. in economics from the University of Richmond and a M.A. and Ph.D. in economics from The Ohio State University.


