 Global| Dec 04 2024
Composite PMIs from S&P in Low Orbit Stasis

Overview: “MIXED” at weak levels of activity- The S&P composite PMI readings for November continue to show a mixed bag of activity globally among the 25 national jurisdictions in the table. The average reading in November slipped to 51.7 from 51.9 in October; the median reading slipped 51.7 in November from 51.8 in October. There are 7 reporting jurisdictions with diffusion readings below ‘50’ indicating a contraction in overall economic activity in November, the same number as in October but down from a count of 12 in September. The breadth of slowing in November is at 44%, which is more slowing than in October, when only 24% of the reporters were slowing month-to-month. But both of those readings are much stronger than in September when 84% of the reporting units slowed down on a month-to-month basis.
Reading this table: In addition to summary data at the bottom of the table to provide some numerical benchmarking to the indications in the table (below), I use color-coding and shading to indicate other trends. The month-to-month or the period-to-period changes in activity are flagged by the word ‘better’ or ‘worse’ with ‘worse’ appearing in red and ‘better’ appearing in black to create an easier visual image of how countries are doing over these time horizons. Shading is used to reveal rankings below ‘50’ for diffusion data. Diffusion readings below 50 indicate contraction. At a glance, we can see that the weakness is really concentrated in the large western economies with the European Monetary Union, specifically, Germany and France, and sporadically, Italy, showing a proliferation of below ‘50’ readings. Sweden, Russia, and Australia have below ‘50’ readings in September but have since shaken those off in subsequent months. Zambia and Egypt have been consistently below ‘50’ readings and Nigeria is in that same club except for its 12-month average. Kenya and Ghana had a below ‘50’ reading in September but have since shaken those off.
Queue standings are WEAK! - The queue standing data take the diffusion readings and place them in a queue of data over nearly the last five years. The far-right hand column labeled “queue %” provides these standings. The benchmark here is that a standing of 50% identifies the median for the period so any reading above 50% is above its five-year median; anything below 50% is below its five-year median. I color-code these to make them easier to summarize at a glance with the below 50% readings in red in the above 50% in readings in black. Fourteen of the 25 readings have standings below their approximate 5-year medians. This weakness is concentrated in large economies with the U.S. as a clear exception having a 66.7 percentile standing, but the European Monetary Union, Germany, France, and Italy all have standings below their 50th percentile, as does the United Kingdom. In Asia, Japan and China have standings that are slightly below their respective 50th percentiles.
The bigger they are, the harder they fall? - The largest economies are having the biggest problem shaking off the weakness in the wake of COVID and in the wake of their COVID policies. Sequential data that compare three-month, six-month, and 12-month periods and the changes in activity over those periods show that the overall average has really been quite static although there is a very slight erosion in play with the overall average at 51.9 over 12 months slipping to 51.8 over six months and to 51.7 over three months. This is sequential hair-splitting weakness. The median values follow in step with a median of 51.3 for the 12-month average, slipping to 51.1 for the six-month average and staying at 51.1 for the three-month average of the cross-section median values. Over 12-to-6-to-3 months, the number of jurisdictions below ‘50’ fluctuates between 6 and 7; across these periods, there is not much change. Beyond the sequential movements of the average and the median, we can look at the percent slowing; the percent slowing has been creeping up. Over 12 months 43.5% of the reporting units are slowing, over six-months 60.9% of them are slowing, and over three months 78.3% of them are slowing. While the aggregate data on medians and averages show only a very slight erosion across jurisdictions, the count of areas where activity is actually slowing has actually been rising demonstrably.
Little change month-to-month; worsening m/m in 44% reporting units

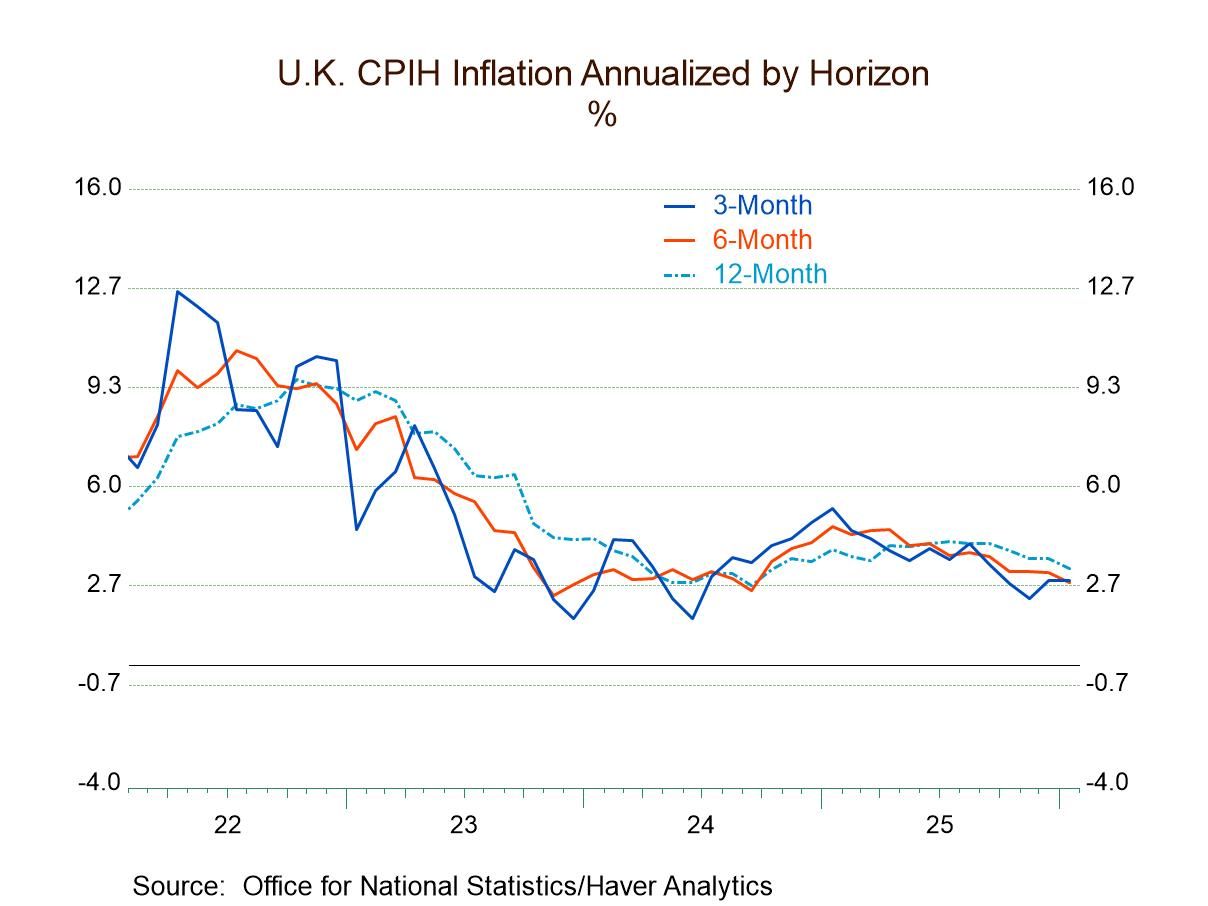
The inflation picture- Inflation continues to be dogging the global economy with USA inflation above its 2% target and recently having stabilized and even shown some upward momentum. The European Monetary Union shows the headline HICP measure has drifted below 2% but the core remains significantly above 2%. In the U.K., inflation remains excessive. In Japan, inflation has recently taken a jolt higher and the central bank there is engaged in a tightening process unlike central banks elsewhere.
The BIG picture- Apart from Japan, we can characterize policy among the central banks of the United States, the United Kingdom, and the European Monetary Union and most of Europe as looking more at the big picture because that policy more than looking at individual data points are looking at tends and long-term relationships. In the U.S., in particular, inflation rates are above neutral and then inflation started to decline. The Fed is mostly of the opinion that its policy rate is above what it would call the neutral rate and so it has been in some sense looking through some of the short-term volatility in inflation and even the strengthening in economic activity to some extent, to focus on the belief that inflation is broadly contained in coming down to target and that interest rates are significantly above their natural or long-term equilibrium level. Policy is in the U.K. and then the European Monetary Union reflect some variant of that with a little bit less dogmatism and inflation is controlled and a little bit more concern about how well near-term inflation performs.
Summing up On balance, the global economy is in the midst of wrenching changes in the wake of some unprecedented Covid and post-Covid policies that are becoming increasingly to be looked upon askance. In addition, there is the war between Russia and Ukraine that has depleted resources across most countries certainly among those that have taken sides even with some distance in the affair. There is in addition the unresolved hotspot in the Middle East and geopolitical tensions more broadly that extend to the Pacific Rim region. Governments have been changed, policies have been reinspected, and all of this leaves us in a position of being less certain about what happens next on the economic policy and geopolitical fronts in the period ahead. It is uncharacteristically uncertain in a number of respects. If you are making a forecast at this time for 2025, I wish you good luck with that.
Robert Brusca
AuthorMore in Author Profile »Robert A. Brusca is Chief Economist of Fact and Opinion Economics, a consulting firm he founded in Manhattan. He has been an economist on Wall Street for over 25 years. He has visited central banking and large institutional clients in over 30 countries in his career as an economist. Mr. Brusca was a Divisional Research Chief at the Federal Reserve Bank of NY (Chief of the International Financial markets Division), a Fed Watcher at Irving Trust and Chief Economist at Nikko Securities International. He is widely quoted and appears in various media. Mr. Brusca holds an MA and Ph.D. in economics from Michigan State University and a BA in Economics from the University of Michigan. His research pursues his strong interests in non aligned policy economics as well as international economics. FAO Economics’ research targets investors to assist them in making better investment decisions in stocks, bonds and in a variety of international assets. The company does not manage money and has no conflicts in giving economic advice.


