U.S. Current Account Deficit Widened Markedly in Q2 2024
by:Sandy Batten
|in:Economy in Brief
Summary
- Second largest deficit on record.
- Goods deficit key factor, widening by more than $20 billion.
- Services surplus essentially unchanged.


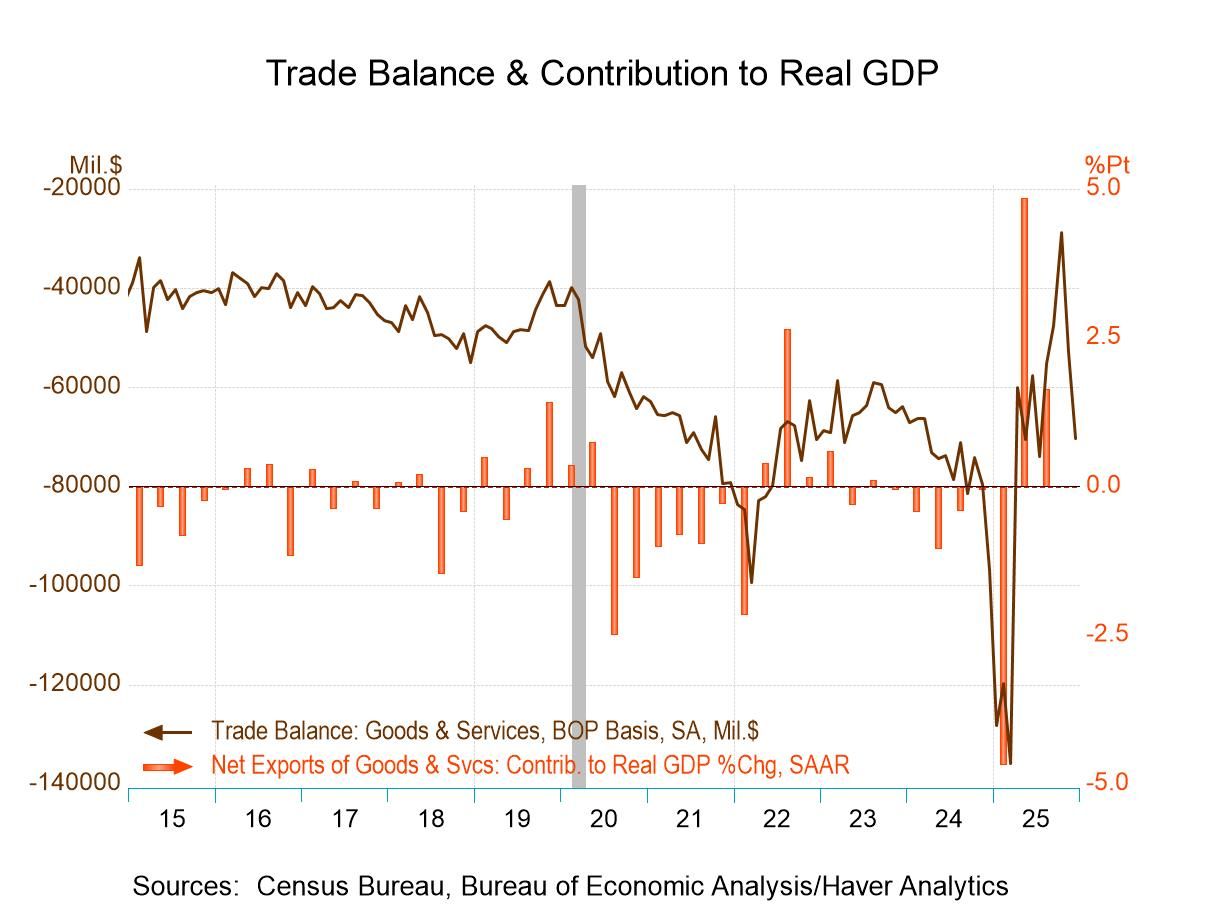
The U.S. current account deficit widened markedly in the second quarter of 2024 to $266.8 billion from a revised $241.0 billion in Q1 (previously $237.6 billion). This was the second largest current account deficit in the history of the series, which dates back to 1960. The Q2 deficit was 3.7% of GDP, up from 3.4% in Q1. The Action Economics Forecast Survey had expected the deficit to widen to $260.0 billion in Q2.
The increase in the current account deficit in Q2 was due to a widening in the deficit on goods to $297.1 billion, also the second largest in the series history, from $276.9 billion in Q1. Exports of goods were essentially unchanged in Q2 from Q1 after rising 0.6% q/q in Q1. Imports of goods jumped 2.5% q/q in Q2 on top of a 2.0% quarterly gain in Q2. The services surplus was essentially unchanged in Q2 at $73.9 billion. Exports of services slowed to 1.1% q/q in Q2 from 2.0% q/q in Q1. Imports of services increased 1.5% q/q, up from a 1.1% increase in Q1.
Among the income accounts, the primary income surplus continued its secular decline, falling to $1.1 billion in Q2 from $6.7 billion in Q1. Primary income includes investment income and compensation of employees. Primary income receipts edged up 0.8% q/q in Q2 while primary income payments increased 2.4% q/q. The secondary income deficit widened slightly to $44.7 billion in Q2 from $44.4 billion in Q1. Secondary income includes transfer payments by governments, tax withholdings and insurance payments, among other items. Secondary income receipts fell 1.8% q/q while secondary income payments declined 0.7% q/q.
Among financial account transactions, the net acquisition of financial assets fell markedly to $153.1 billion Q2 from $361.7 billion in Q1. The net incurrence of financial liabilities fell to $387.0 billion in Q2 from $544.7 billion in Q1.
Balance of Payments data are in Haver’s USINT database, with summaries available in USECON. The expectations figure is in the AS1REPNA database.


Sandy Batten
AuthorMore in Author Profile »Sandy Batten has more than 30 years of experience analyzing industrial economies and financial markets and a wide range of experience across the financial services sector, government, and academia. Before joining Haver Analytics, Sandy was a Vice President and Senior Economist at Citibank; Senior Credit Market Analyst at CDC Investment Management, Managing Director at Bear Stearns, and Executive Director at JPMorgan. In 2008, Sandy was named the most accurate US forecaster by the National Association for Business Economics. He is a member of the New York Forecasters Club, NABE, and the American Economic Association. Prior to his time in the financial services sector, Sandy was a Research Officer at the Federal Reserve Bank of St. Louis, Senior Staff Economist on the President’s Council of Economic Advisors, Deputy Assistant Secretary for Economic Policy at the US Treasury, and Economist at the International Monetary Fund. Sandy has taught economics at St. Louis University, Denison University, and Muskingun College. He has published numerous peer-reviewed articles in a wide range of academic publications. He has a B.A. in economics from the University of Richmond and a M.A. and Ph.D. in economics from The Ohio State University.


 Global

