U.S. Initial Unemployment Insurance Claims Rise
by:Tom Moeller
|in:Economy in Brief
Summary
-
Initial claims reach four-week high.
-
Rise in continued weeks claimed reverses earlier declines.
-
Insured unemployment rate climbs to highest in five weeks.


Initial claims for unemployment insurance increased 7.1% (2.6% y/y) to 196,000 in the week ended February 4 from 183,000 during the prior week. Expectations had been for a rise to 192,000 claims in the Action Economics Forecast Survey. The four-week moving average of initial claims of 189,250, a new low, compared with 192,000 in the prior week. This remained down from a 249,500 high in the first week of August 2022.
In the week ended January 28, continued weeks claimed for unemployment insurance rose to 1.688 million (-3.2% y/y) from 1.650 million in the prior week. The 4-week moving average rose to 1.665 million from 1.650 million in the prior week. The claimant level has been rising since last June.
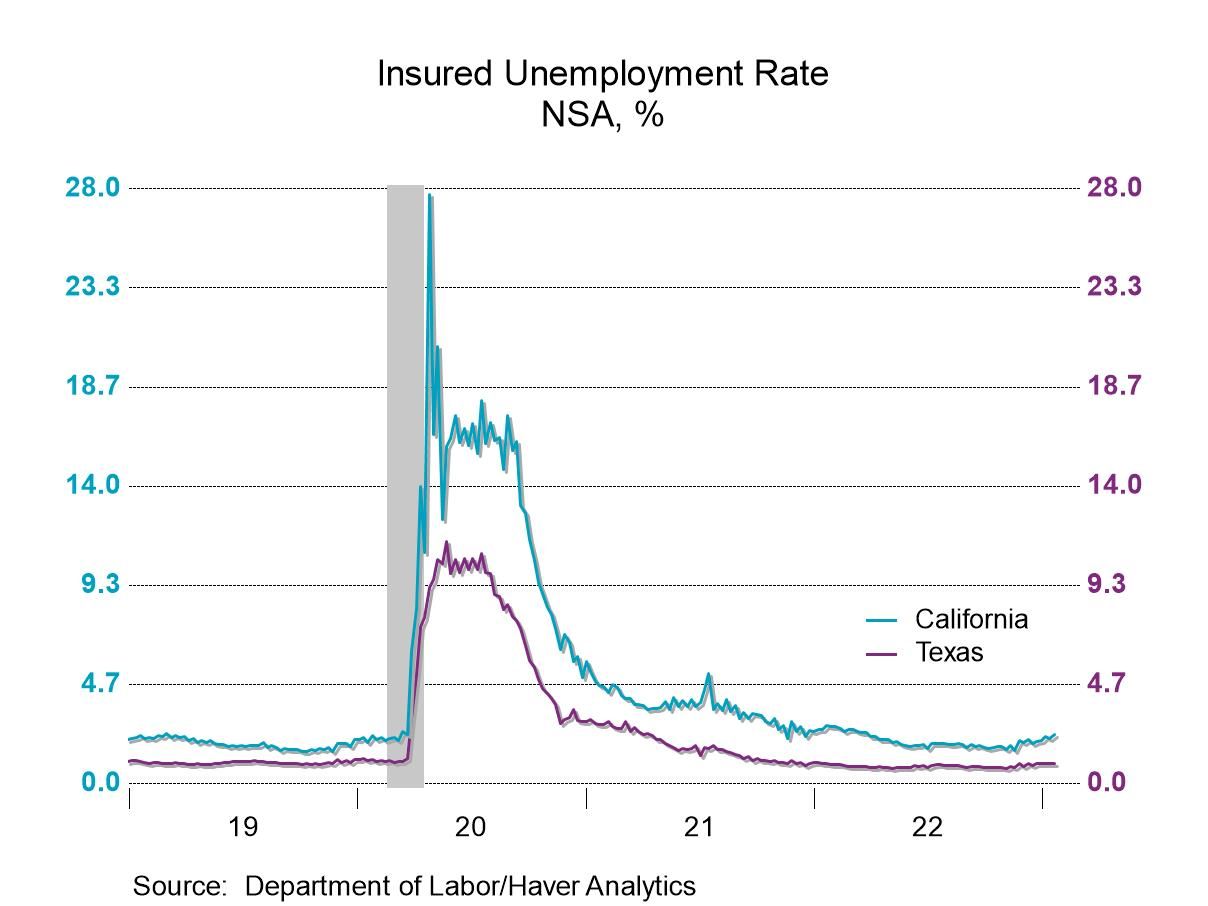
The insured unemployment rate in the week ended January 28 rose to 1.2% from 1.1% during each of the prior four weeks. It was increased from the record low range between 0.9% and 1.0% in place since mid-April. The series dates back to 1971.
In the week ended January 21, the total number of continued weeks claimed in all unemployment insurance programs rose 2.8% (-7.5% y/y) to 1.943 million from 1.890 million in the prior week. This total includes federal employees, newly discharged veterans, extended benefits and other specialized programs and is not seasonally adjusted. Claims in the Pandemic Unemployment Assistance program and Pandemic Emergency Unemployment Compensation are no longer included in the main Labor Department press release, as both programs have expired.
The insured rates of unemployment in regular programs vary across states. The highest insured unemployment rates in the week ending January 21 were in New Jersey (2.60%), California (2.30%), Alaska (2.23%), Massachusetts (2.12%), Puerto Rico (2.02%) and New York (1.91%). The lowest rates were in Alabama (0.29%), Virginia (0.31%), Kansas (0.37%), South Dakota (0.60%) and Nebraska (0.62%). Other major state rates include Pennsylvania (1.76%), Texas (0.97%) and Illinois (1.92%). These state rates are not seasonally adjusted.
Data on weekly unemployment claims going back to 1967 are contained in Haver's WEEKLY database, and they are summarized monthly in USECON. Data for individual states are in REGIONW. The expectations figure is from the Action Economics Forecast Survey, carried in the AS1REPNA database.


Tom Moeller
AuthorMore in Author Profile »Prior to joining Haver Analytics in 2000, Mr. Moeller worked as the Economist at Chancellor Capital Management from 1985 to 1999. There, he developed comprehensive economic forecasts and interpreted economic data for equity and fixed income portfolio managers. Also at Chancellor, Mr. Moeller worked as an equity analyst and was responsible for researching and rating companies in the economically sensitive automobile and housing industries for investment in Chancellor’s equity portfolio. Prior to joining Chancellor, Mr. Moeller was an Economist at Citibank from 1979 to 1984. He also analyzed pricing behavior in the metals industry for the Council on Wage and Price Stability in Washington, D.C. In 1999, Mr. Moeller received the award for most accurate forecast from the Forecasters' Club of New York. From 1990 to 1992 he was President of the New York Association for Business Economists. Mr. Moeller earned an M.B.A. in Finance from Fordham University, where he graduated in 1987. He holds a Bachelor of Arts in Economics from George Washington University.
More Economy in Brief


 Global| Feb 05 2026
Charts of the Week: Balanced Policy, Resilient Data and AI Narratives
by:Andrew Cates

