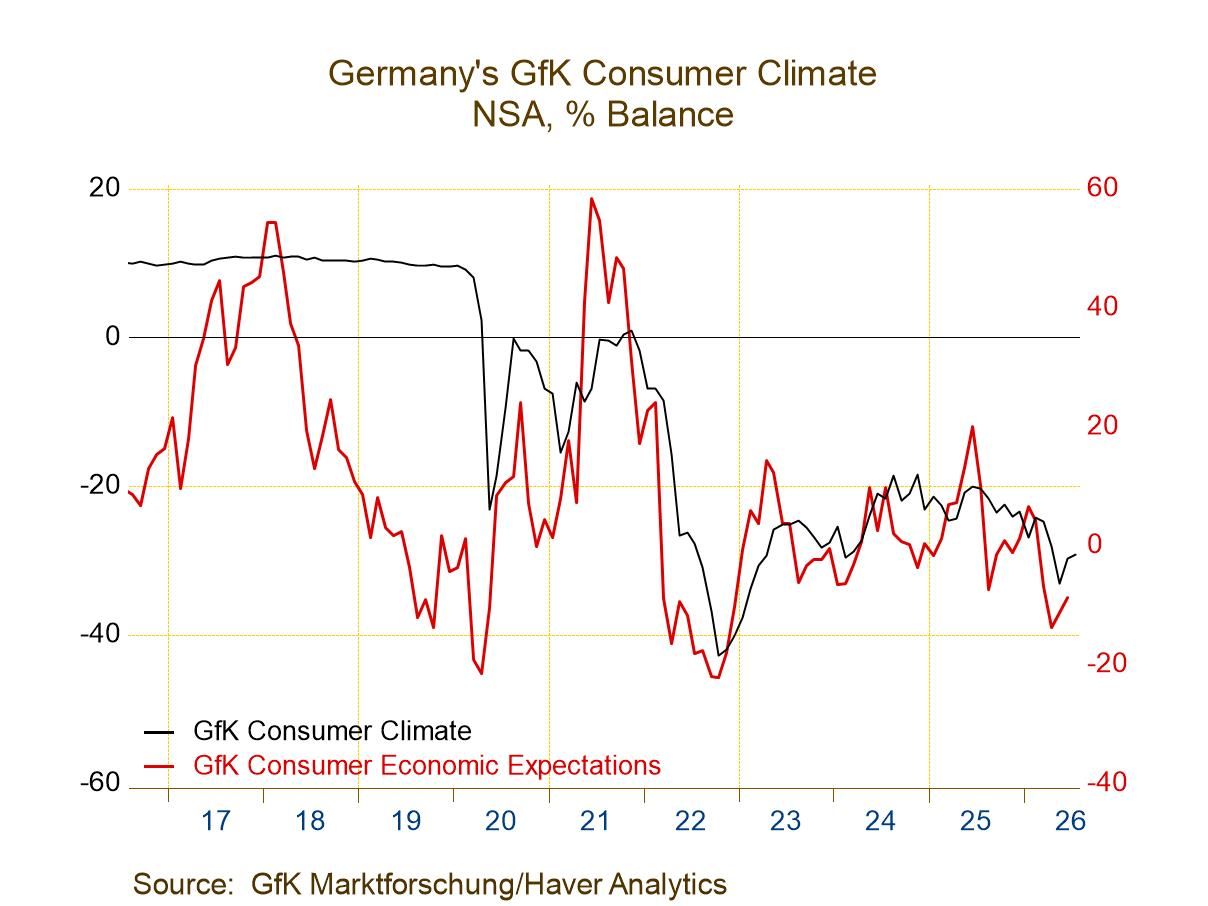
Haver Analytics
Haver Analytics

Introducing

Robert Brusca

Robert A. Brusca is Chief Economist of Fact and Opinion Economics, a consulting firm he founded in Manhattan. He has been an economist on Wall Street for over 25 years. He has visited central banking and large institutional clients in over 30 countries in his career as an economist. Mr. Brusca was a Divisional Research Chief at the Federal Reserve Bank of NY (Chief of the International Financial markets Division), a Fed Watcher at Irving Trust and Chief Economist at Nikko Securities International. He is widely quoted and appears in various media.   Mr. Brusca holds an MA and Ph.D. in economics from Michigan State University and a BA in Economics from the University of Michigan. His research pursues his strong interests in non aligned policy economics as well as international economics. FAO Economics’ research targets investors to assist them in making better investment decisions in stocks, bonds and in a variety of international assets. The company does not manage money and has no conflicts in giving economic advice.

Publications by Robert Brusca

  • GDP growth in the European Monetary Union slowed to an annual rate of 0.4% in the second quarter of 2025 after logging a very solid 2.3% growth rate in the first quarter. Year-over-year growth has slipped to 1.4% in the second quarter compared to a 1.5% year-over-year pace in the first quarter; however, the second quarter year-over-year growth rate is still a little ahead of the fourth quarter pace in 2024 when it grew by only 1.3% and it is stronger than the third quarter of 2024 when it grew at a 1% pace. While EMU GDP growth has slowed quarter-to-quarter, the year-over-year pace has a moderate ranking. The pace ranked on all growth rates since 1997 leaves the year-over-year pace of 1.4% at a 42.4 percentile standing; that's below its median for the period (the median occurs at a ranking of 50%). However, it's not that short of the median and it indicates that growth is moderately slower than it's been over the past period back to 1997.

    Growth by Size The Four Largest: The four largest economies in the monetary union grew at a 0.5% annual rate in the second quarter, compared to 1.2% in the first quarter and 0.8% in the fourth quarter of 2024. The four largest EMU economies (Germany, France, Italy, and Spain) have GDP-weighted growth of 0.8% over four quarters, the same as in Q1. That growth rate ranks in its 37th percentile, well below its median pace since 1997.

    The Rest: The ‘rest of EMU’ grew at a ‘technically positive’ annual rate of 0.1% in 2025-Q2. That slow-crawl is quite weak, but it follows a 5.3% pace in Q1. The rest of EMU grows at a very solid 3% pace year-over-year in 2025-Q2 and logs 3.0% or better growth rates for three quarters in a row. The year-over-year pace ranks in the top one-third of all growth rates for the rest of EMU group since 1997-Q4. While the Q2 pace is very slow, in context, it does not seem to be an issue.

    EMU Median Growth: The median growth rate for all of EMU is considerably weaker overall than the growth for the Rest of EMU. In 2025-Q2, however, the median pace is 0.7%, down from 1.1% in Q1. The year-on-year pace over the past four quarters for the EMU has been gradually slowing and is at 1.1% year-over-year pace in 2025-Q2. That growth rate for all of EMU is weaker than the ranking for the large countries as well as for the rest of EMU.

    Compared to the U.S. Growth in the U.S. jumped to 3% in Q2 and logged a year-on-year pace of 2.0%. The U.S. logs the third strongest year-on-year pace in the table for Q2. Still, compared to its own historic experience, the U.S. growth rate ranks poorly in its 31.8 percentile, the lower third of its historic queue of growth rates. In relative terms, only two EMU member countries in the table rank lower.

  • The severe lethargy in U.K. retail and wholesale sales continues into July with the outlook portion of the survey for August still exceptionally weak.

    Distributive sales retail volumes Sales in July: In July, the distributive trades volume survey finds sales for a year ago with 34% of the respondents indicating weaker sales compared to those indicating stronger sales. This net reading of -34 is a slight improvement from June’s -46 and signals deterioration compared to May (-27) as well. However, beyond the monthly bumping up and down, the ranking of this net reading is in the lower 8.5 percentile marking it as truly an exceptionally weak reading. The reading for orders compared to a year ago shows better comparisons but still a great deal of weakness and a net reading of -21, compared to -51 in June and -41 in May. It marks a 20th percentile standing, which is better than for sales compared to a year ago but still exceptionally weak. The next reading that, essentially is seasonally adjusted, comparing sales for the same time of year, shows a -10 reading which is better than -37 in June and better than May’s reading of -19 and steps up to a percentile standing at its 42nd percentile. It is still short of its median (which occurs at a ranking of 50%) but is a reading that looks a little closer to the land of the living than the land of the dead.

    Expected sales in August: The distributive volumes statistics for sales expected for August, looking a month ahead, shows negative readings across the board for these same 3 metrics with all three of them improving in August from their July expectations; however, sales compared to a year ago have a 7-percentile standing, even weaker than their current July reading, orders have a 23.5 percentile standing, and sales for the time of year fare much worse with a 6.7 percentile reading - much worse than the current performance ranked for July. In short, there's very little in this survey that is encouraging or reassuring. Conditions are weak and even where there is improvement the new reading is still very weak and the expectations readings, while somewhat improved, are still extremely weak.

    Distributive sales wholesale volumes Sales in July: The distributive trades survey for wholesaling produces another set of weak readings that are, for the most part, weaker in July than they were in June and, while different, not much better, or worse than they were in May. The percentile standings for wholesaling show sales compared to a year ago at a 7.4 percentile standing, orders compared to a year ago at a 3.2 percentile standing, and sales for the time of year at a 1.8 percentile standing. All of these are simply exceptionally weak.

    Expected sales volumes in wholesaling: Turning to the expected sales for August once again, all the readings are net negatives; two out of three of them show some improvement compared to their July values; however, the rankings remained exceptionally weak. Sales compared to a year ago are at a 9.1 percentile standing, orders compared to a year ago are at a 5.3 percentile standing, and sales for the time of year are at a 2.1 percentile standing. The results for expected sales and orders in the wholesaling survey are extremely grim.

  • Hypnotists are just trying to get you to focus on something and concentrate on it so that you can relax and they can put you into a hypnotic trance. Right now, you want to make sure that does not happen as you watch what is going on with money supply. It is not ‘entrancing’ and ought to be followed. The chart shows you that trends - and often excesses in ‘global money supply’ growth have begun in that money center country, the United States of America. And… well… here we go again? While it's very early in the game, it looks like, after a period of monetary weakness and re-escalation, U.S. money growth is now beginning to step up in the U.S. Meanwhile, in Europe and in the United Kingdom, money growth, especially real money growth, is beginning to tail off. All this is at a time when Japan's money growth, of course, has been marching to the step of a different drummer showing regular, consistent, nominal weakness and actual declines in the real money stock to try to tame its incipient inflation.

    The Policy Zone We are no longer in the COVID era; or even in the post-COVID era. We are now in the post post-COVID era. And monetary policy is being made based on conditions rather than remedy perceived legacy problems in the economy from COVID. We need to make that transition in our analysis too, and ask ourselves, “What's really happening?” In the U.S., the popular dogma is to claim that central bank independence is being undercut and that Donald Trump's tariffs are going to raise the inflation rate and that the Fed is losing its battle with inflation and inflation is coming because of excessive fiscal policy and the imposition of tariffs. It's a story you can believe if you want to. There's certainly some evidence to support those points; whether they completely justify that point of view, it is still too early to say. However, clearly, money supply growth in the U.S. is ramping up. The U.S. 12-month growth rate is up to 4.5%, over six months the annualized rate hits 5.5%, and over three months the annualized rate hits 6.9%. It's hard to say that that's occurring because of Trump's tariffs. At the same time, the growth rate in real money balances - that's money supply deflated by the CPI - has boosted its growth rate from 1.8% over 12 months to a 2.9% annual rate over six months to a 4.4% annual rate over three months. Is the chase on for an inflation ‘uptick’ that will not be temporary?

    Follow the leader, or go your own way? It will take some time to tell if the other money center countries are going to follow the leader or not. So far it looks like ‘or not.’ Money supply growth in the European Monetary Union (EMU) is actually decelerating slightly from 2.8% over 12 months to a 1.7% pace over six months to a 1.3% pace over three months. Similarly, in the EMU the growth of real balances has slipped from 0.8% over 12 months to a 0.2% annual rate over six months to a -0.6% annual rate (contraction) over three months. So far, euro area money supply is not tagging along with the U.S. trend.

    Euro-credit trends Meanwhile, private credit growth in Europe has stabilized with the 12-month growth rate of 2.3% that moves up to 2.4% over six months and settles back to 2% over three months, a relatively stable performance that would seem to signal ongoing moderate growth. The growth rate of private credit, deflated for the effects of inflation, shows continued growth, and beyond that the trend is unclear. Over 12 months the growth rate is 0.3%, over six months that improves to 0.8%, and over three months it drops back to a 0.1% pace. I'm not good enough at splitting hair to be able to tell you what that trend is.

    U.K. money weakens In the U.K., nominal money supply growth seems to be slowing, but that isn't crystal clear, with the 3.5% annual rate over 12 months moving up to a 4.1% annual rate over six months been slipping back to 1.7% over three months. It may take a few months to be able to tell if the step down to 1.7% is real or just volatility averaging out the step up over six months. U.K. money growth does not appear to be excessive or rogue; when we look at real balances, 12-month growth is -0.4%, six-month growth is -0.1% and the three-month growth rate is -1.6%. On that profile, real money growth in the U.K. does not appear to be following the U.S. rule book either.

    Japan- dealing with its own complex issues We know that Japan has been off on its own for a while. Japan clearly has been fighting off a bout of inflation. But, since that development is relatively new, and the previous battle with deflation was relatively long-lived, if we think in terms of inflation averaging, Japan is still dealing with an extremely small problem. Despite the appearance of some real inflation (depending on the price index you look at to establish Japanese inflation trends), Japan's inflation overshoot in contexts is only making up for lost time.

    Money growth in Japan is 0.9% over 12 months; however, it's only running at a 0.1% annualized over six months and over three months. The growth of real money balances in Japan is negative. Real balance growth rates are negative on balance over three years and two years; the 12-month growth rate for real money balances is -2.3%, over six months it is -2.2%, and over three months it is -2%. The degree of restriction has faded but faded only very marginally. The main point is that in Japan, real money balances are contracting and so there is a fight to reduce inflation going on behind the scenes and that's clearing up; you can see it in the money growth rates on the chart as well if not from the level or real interest rates. Japan is balancing complex needs.

  • German consumer climate fell to -21.5 in August after logging -20.3 in July; July had posted a slight deterioration compared to June which had a -20.0 reading; however, previously in May the reading had improved sharply to -20.8 from -24.3 in April. The month of May had seemed to signal an improvement that took the climate readings from the -24 to -25 range into the -20 range. And while the -20 level held for three months in a row, there's now been a deterioration back to -21.5 in August and some renewed concerns about the economy.

    Resilience and questions... So far there has been a good deal of economic resilience in Germany and in Europe; however, the recent deal by NATO members to spend 5% of GDP on defense is channeling a lot of that money to the United States to purchase missiles to help Ukraine in defense against Russia. However, 1 1/2 percentage points of that military spending pledge can actually be infrastructure spending that can be used for domestic purposes to bolster military preparedness and operations. Therefore, that portion of the spending, at least, remains as stimulus for the European economy.

    The inflation setting Inflation in the euro area is basically at ‘target’ for the headline and close to it for the core; the year-over-year core rate is about 2.3%. Even so, Europe is looking at a pace that's close to 2%, but still higher than 2% after a long stretch of inflation being over the 2% target. In today's press conference, ECB President Christine Lagarde, speaking on the inflation picture and outlook in the EMU, said that the bank's target was an intermediate target and that the ECB expected inflation to be at its target over the intermediate term. The question I would have for her and for the ECB at this point is whether that means that the inflation target has become “aspirational” and is no longer operational? If the ECB is going to be happy with an inflation rate that stays above 2% as long as it thinks that ‘in the intermediate term’ inflation is going back to 2% has something significant changed? And since all forecasts are notoriously wrong – is this now a credibility issue for the ECB?

    German eco-climate In Germany, the GfK measure is for August; components for the climate measure are up-to-date through July. Economic expectations took a turn lower after posting 20.1 in June; they slipped to 10.1 in July. The most recent observation of record for income expectations, however, advanced from 12.8 in June to 15.2 in July, continuing a string of improvements. The propensity to buy metric worsened and remained negative at -9.2 in July compared to -6.2 in June. The overall climate metric is now at its weakest since April 2025; economic expectations are their lowest since April 2025. Income expectations are trending higher, nonetheless. The propensity to buy metric at -9.2 in July is at its weakest reading since February 2025; but that was a single-isolated low, setting that observation aside, the ‘propensity to buy’ is the weakest it's been since August 2024. The German consumer clearly hasn't recovered in terms of having faith and purchasing power restored even though income expectations have risen more substantially.

    Queue standing assessments In terms of the queue percentile standings (ranked data observations), climate has been weaker than this 11.5% of the time, economic expectations have been weaker 59% of the time, income expectations have been weaker 50.7% of the time, while the propensity to buy has been weaker only 29.1% of the time. Economic expectations are above their median - above a ranking value of 50% - while income expectations have only returned to their median estimate, marginally above 50%, at a reading of 50.7%. The propensity to buy languishes at the bottom 1/3 of its historic queue of values. The climate headline remains in disaster territory.

    Other Europe: Other EMU and the U.K. These observations for Germany contrast to observations in the rest of Europe where data lag. Consumer confidence metrics for Italy, France, and the U.K. are up-to-date only through June. And through that period, Italy shows the last two observations a little bit stronger, France shows the most recent two observations as, very similar, but weaker than April, while the U.K. shows the progression towards stronger readings from April to May to June. However, the rankings for these countries are quite mixed. For Italy consumers held confidence in June at a 73.2 percentile standing, relatively firm, while in France the standing is at its 26.4 percentile and in the U.K. it is at its 37.5 percentile. The climate in Germany is exceptionally low although the readings for the European countries in the table are somewhat more similar to the readings for the German climate components that are up-to-date through July.

  • No one will be critical of Japan’s efforts to free itself of its torpor into disinflation and deflation that it suffered for many years. The Bank of Japan struggled long and hard to remove the contraction in prices from its economy since falling prices can have a pernicious effect on growth and investment. Japan still faces challenges: it has a contracting population and faces dealing with tariff demands from the United States as negotiations on that front continue to drag and have become harder to settle than Japan had expected. Despite the current inflation overshoot, on data back to January 2011, Japan’s to-date inflation is only averaging 1%; that is still well below its 2% target and ample reason for the Bank of Japan to continue to move carefully to corral inflation especially if inflation has stopped accelerating – as it seems to have done. Against this background, we look at Japan’s CPI report.

    Current inflation: June Japan has dispatched deflation and currently faces an inflation problem. In June, the BOJ’s preferred gauge for the CPI excluding fresh foods & energy rose 0.4% month-to-month for the second month in a row; it rose by 0.2% in April. Japan’s headline inflation rate seems to have fallen into line A traditional ‘core reading’ excluding all food & energy flies under the BOJ’s target pace. But the BOJ’s preferred inflation gauge shows a 3.4% rise over 12 months and then gains at a pace of 3.7% over both six months and three months. All of those numbers are too hot to handle.

    Line-items Education costs in Japan are falling sharply and sequentially. Medical care costs are deescalating too. And while food & beverage prices continue to overshoot, 2% by a wide margin, the pace of total food & beverage inflation has been falling. No broad category has steadily accelerating inflation. But the BOJ’s preferred gauge of inflation, a specialized core measure excluding energy & fresh foods, sees inflation ramping up and staying high over three months and six months.

    Diffusion/breadth Among the eight major categories, year-on-year inflation has accelerated compared to where it was one-year ago in four of the eight. Inflation is above the 2% benchmark for four of eight categories as well.

    Acceleration or not... The chart on sequential inflation for the BOJ’s preferred core gauge shows that this measure has accelerated since August or December of last year and since then has more or less marked time oscillating without any clear trend.

  • The National Australia Bank (NAB) survey for June shows a jump in Australia’s business confidence to 5.1 from 2.2 in May and those compared to a reading of -0.7 in April. The sequential averages show a steady improvement from a 12-month average of 0.2 to a six-month average of 1.3 and to a three-month average of 2.2. The monthly May reading is at 2.2. With the June reading moving up to 5.1, it looks like this progression toward improvement remains in train.

    Smoothed assessments Smoothing out the monthly data shows that the three-month smoothing operation switches the progression from 12-months to six-months to three-months to reveal improvement that has stalled out. Looking at 12-month averages, there's an improvement over six months compared to 12-months, and then a slight set-back over three months.

    Components The components over three months show improvement in train for about half of the categories, compared to 43.8% improving over six months and 25% improving over 12 months. The sense of improvement across categories has been broadening over the more recent periods.

    Standings Percentile standings on the data back to 2002 show above-median standings in seven of the thirteen survey categories. Over this period, business confidence itself ranks slightly below its median with a 49.5 percentile standing; the median occurs at a standing of 50-percentile. The index of business confidence is currently close to its median on this, but slightly below it. However, the rankings for the three-month moving average and the 12-month moving average both are considerably lower, indicating that much of the improvement that we see in the Australian index is relatively recent.

    Summing up Australia remains caught up in tariff negotiations with the United States along with every other country, a factor that extends uncertainty and could be holding back progress in the economy. However, the current survey suggests that progress is in train, nonetheless.

  • United Kingdom
    | Jul 16 2025

    U.K. CPIH Inflation Runs Hot

    Inflation in the United Kingdom is still running hot in June. The CPIH rose by 0.4% in the month with its core rate that excludes energy, food, alcoholic beverages & tobacco also rising 0.4% month-to-month. In both cases, these increases compare to a rise of 0.1% in May. On that perspective, the two-month trend is somewhat muted. However, in April the CPIH headline rose by 0.6% and the core rose by 0.4%, so the U.K. finds itself in another period of excess inflation.

    Sequential inflation The sequential inflation rate from 12-months to six-months to three-months shows the headline at 4.1% over 12 months, 4.2% over six months and 4.3% over three months, a very slight acceleration, but clearly inflation that is over 2 percentage points above the target set by the Bank of England across the entire span. The core rate for the CPIH is up 4.3% over 12 months, up at a 4.4% annual rate over six months and looks slightly muted at 4.2% over three months. Again, we are looking at a solid inflation overshoot that is more than 2 percentage points above the target set by the Bank of England.

    Inflation breadth In the month of June, inflation accelerated in 45% of the categories, the same proportion as in May; however, in April acceleration occurred in 54% of the categories. These sequential data show that over three months inflation in the U.K. accelerated across 54% of the categories, the same proportion as over six months although both of those marks were below the 63% acceleration breadth logged over 12 months. The data clearly show that there isn't any deceleration to any great extent in play over any of these horizons and that the monthly data offer only a modicum of solace for June and May.

    The far-right hand column evaluates current inflation rates year-over-year compared to where they have been since January 2000, monthly. The comparison is a ranked percentage of the current inflation rate vs. this history. For example, the current CPIH 12-month inflation rate of 4.1% sits at the 88.6 percentile of its historic queue of data. This tells us that inflation has been this high or higher, less than 12% of the time over this period, clearly marking the 4.1% growth rate as high and as substantial by historic experience. The CPIH core has a slightly higher standing and it's 89th percentile. Looking across the components, all but two have rankings over this 50%. Rankings that are above 50% place them above their medians for the period. The exceptions here, are a 26.5 percentile standing for restaurants & hotels inflation where prices are running at 2.6%, and transportation where prices are running at 1.6%. Furniture, household equipment & maintenance prices have a 56.2 percentile standing, only marginally above the category’s historic median. After that, there's only one category in its 60th percentile, two categories in their 70th percentile and the rest are higher.

    Summing up Needless to say, the U.K. has an entrenched inflation problem. It's lodged in the headline; it's lodged in the core; it's lodged across most of the commodity categories! The Bank of England simply has work to do and there isn't much evidence that the BOE is making any progress; in fact, the trends seem to suggest that there may be much more work to do.

  • Europe
    | Jul 15 2025

    EMU IP and Sectors Recover

    Output jumped in the European Monetary Union in May. The main gain followed a 2.2% drop in April that was preceded by a 1.8% increase in March. There's been some turbulence in output over the last few months with April showing declines for all the major sector components.

    Moving beyond monthly data, the sequential run of growth rates from 12-months to 6-months to 3-months shows that total industrial production is on an accelerating path from 3.8% over 12 months, to over 5% over six months as well as over three months. Manufacturing alone shows a 12-month 3.6% growth rate, rising to 4.7% over six months and to 5.8% over three months.

    Sectors Sectors show a trend toward acceleration in consumer goods production where a 10.3% growth rate over 12 months progresses to 20.1% over six months and only backs off to 18.5% over three months. Splitting consumer goods output into durables and nondurables, we find less strength among durables with flat performance over 12 months, a 3.7% annual rate decline over six months, and a 4.3% annual rate increase over three months. However, for nondurables the growth rate surges from 11.6% over 12 months to 23.1% over six months and stays over 20% over three months. Intermediate goods’ trend is the fly in the ointment for industrial production, as output falls by 1.7% over 12 months, falls at a 2% pace over six months, and then falls at a 4.9% annual rate over three months. That setback is surprising given the growth rate and other categories. Capital goods show a strong accelerating phase from 4.1% over 12 months to a 5% growth rate over six months to 15.5% over three months.

    Countries Looking across specific countries, the table shows 13 monetary union members in May - Seven of them show output contracting. That's the same number contracting as in April although in March only four showed industrial output contracting month to month.

    The sequential growth rates calculated over broader periods show eight countries with output contracting over three months, but only five with output contracting over six months; six countries report lower output over 12 months – a much longer span of time.

    Mixed trends within the community The sector data for all of the Monetary Union are relatively upbeat, but the country level data show a lot more mixed performance across individual country units; only Ireland, Finland, and Germany show output increases over three months, six months and 12 months. Conversely, Greece, France, and Belgium show output declines over three months, six months and 12 months.

    The quarter-to-date (QTD), with two months of data in hand, is showing six countries with output declining on QTD-to-date basis. But for the EMU region as a whole, output is advancing at a 1.6% annual rate. Manufacturing output is rising at a stronger 1.9% annualized pace – with real strength in capital goods output.

    Ranking performance The far right-hand column ranks current growth rates on data back to 2007. Seven of thirteen countries rank below 50% which is their median growth rate for the period. Finland, Ireland, and Portugal are quite strong; Malta and German have rankings solidly above their respective 50th percentiles. The Netherlands, Italy, France, and Austria have rankings in their 40th percentiles, lagging their median pace but in a 40% to 50% range. Belgium emerges as the weakest country on a ranking basis, standing only in its lower 8.7 percentile and it is riding a losing streak to boot.

    Overall EMU IP rankings are solid-two sectors lag Overall EMU rankings show total output with a 66.1 (top one-third) percentile ranking with manufacturing at 59.6 percentile. Consumer nondurables are the strongest sector at a 98.2 percentile ranking. Both consumer durables and intermediate goods have lower standings: 40.8% for consumer durables and 37.6 percentile for intermediate goods. Both of those sectors are lagging and also carrying weak momentum. In contrast, capital good output is surging and its ranking at 47.7% is mostly below its median rank (at 50%).

    Stimulus diverted? NATO has signed on for more miliary spending and this has been expected to underpin growth in Europe. But some of that stimulus will be redirected in just-announced deal in which the U.S. will manufacture arms and NATO would pay for them to help Ukraine. It is unclear how much stimulus that we had expected for Europe might be redirected to the U.S. by this new deal.

  • Japan's industrial production continues to be weak with output falling by 0.2% in May after falling by 1% in April and coming up lame - at flat - in March. Sequential growth rates are not telling an upbeat story either, with 12-month industrial production lower by 0.8%; over six months the decline is only 0.2% at an annual rate, but then over three months the annual rate of decline is 4.6%.

    Manufacturing shows similar weakness to the trend for overall industry, but the three-month growth rate is at -5.7% at an annual rate.

    Two key industries for Japan, textiles and transportation, show up with the declines over all three horizons. And for transportation, the decline over the last three months is 11.1% at an annual rate.

    Manufacturing industries in Japan show a great deal of variation with consumer goods output on a more or less accelerating path, growing 3.2% over 12 months and then up to a 12% annual rate over three months. Intermediate goods output is in a significant decelerating phase, falling 3% over 12 months, falling at a 1.2% annual rate over six months and then stepping up the pace of decline to -6.6% at an annual rate over three months. Investment goods show a good deal more life, falling only 0.1% over 12 months, then growing at a 3.9% annual rate over six months and surging at a very vibrant 8.3% annual rate over three months.

    Mining activity in Japan is recovering, showing a 6.8% annual rate decline over 12 months, a 5% annual rate decline over six months, and an 11% annual rate increase over three months.

    Utilities output from gas and electric utilities shows a decline of 1% over 12 months, growth of 2.3% over six months. and then output declined at a 19.2% annual rate over the last three months.

  • French inflation jumped in June, rising by 0.4% in the month on the HICP metric, the same as the monthly rise for France’s CPI and its CPI excluding energy. Not surprisingly the monthly diffusion reading tracks the breadth of inflation rise monthly to 72.7% in June affirming that the breadth of the gain in monthly inflation was substantial. Breadth is sharply higher in June after looking very weak at 18.2% in May. But the month of May followed a broad acceleration with breadth at 90.9% in April. Monthly breadth reading can be quite unstable. Diffusion values above 50% revel inflation acceleration period a period in which inflation acceleration is more common than deceleration.

    However, breadth over the sequential periods 3-months, 6-months and 12-months shows inflation acceleration is creeping up as the breadth reading advances on the timeline from 36.4% over 12 months, to 54.5% over 6 months, and to 63.6% over 3 months.

    France has been an inflation success story and a growth failure story. The HICP headline inflation last higher than 2% in August 2024 and the domestic CPI excluding energy was over 2% for its 12-month gain in March of 2024. And while the HICP has signs of ongoing slowing, the domestic CPI excluding energy has been relatively stable since September 2024. The CPI excluding energy inflation is running at a weak and well contained pace of 1.6% over 12 months and the weakening HICP undoubtedly has benefited from the ongoing drop in energy prices where Brent costs in euro-terms show an 18.5% drop over 12 months.

    The headline HICP for France shows a mixed trend from 12-months to 6-months to 3-months. The domestic CPI is closer to showing steady acceleration. The CPI excluding energy shows persistent acceleration. But the domestic CPI gauge also shows inflation at a pace of just 2.2% over 6 months and 2.6% over 3 months compared to a low 12-month pace of 1.6%. The acceleration in French inflation is mild and the pace of inflation is really controlled.

  • Germany
    | Jul 10 2025

    German Inflation Settles Lower

    Germany is HICP inflation measure (12-month) came in at 2% in June, below its May reading 2.1% but above its April reading of 1.9%. There have been a few recent readings for Germany at 2% or below and these are the first traces of 2% inflation in Germany since mid-2021 when inflation first began to climb above the 2% target that is the objective by the ECB for all of the European Monetary Union.

    Inflation progress is evident The German domestic CPI is also up by 2% year-over-year, and this is the fifth time that it has posted an increase of 2% or less since August 2024. This is good news because it suggests that German inflation isn't just flirting but perhaps trending and will eventually stabilize around the 2% mark. However, Germany also still has work to do because the domestic CPI gauge excluding energy in June is still at 2.5% year-over-year; that pace dropped from 2.8% in May and it's generally been higher over the past year with some fluctuations up as high as a 3.1% year-over-year pace, as was the case in December. But it's also been as low as 2.6% in August of last year. Core inflation in Germany remains stubborn. We see that clearly from its domestic CPI excluding energy reading. The core reading in the HICP series is not yet available for June but the core reading from May came in at 2.9%, an acceleration from 2.8% in April.

    Sequential inflation The sequential inflation readings in this report are quite good for domestic inflation, and even for the ex-energy reading, but not quite as good for the HICP which is the measure of inflation used by the European Central Bank. German HICP inflation is 2% over 12 months, drops to 0.9% over 6 months, and then the annualized rate rises to 2.2%, again, over 3 months. For the domestic measure of inflation, the annualized CPI rates are 2% over 12 months, 1.5% over 6 months and 1% over 3 months - a clear decelerating pattern. That decelerating pattern is echoed for the domestic CPI excluding energy which is at 2.5% over 12 months, 1.7%. over 6 months and 1.3% over 3 months.

    Inflation Diffusion -monthly Inflation diffusion, which calculates the breadth of inflation for the domestic CPI, shows diffusion of 27.3% for June, 54.5% for May, and 18.2% for April. The June and April readings clearly point toward more decelerating than accelerating inflation as they are below the neutral 50% mark. The May report suggests just slightly more acceleration than deceleration at 54.5%.

    Sequential Diffusion Sequentially, diffusion over 12 months, 6 months and 3 months gives us readings below 50% on each horizon which is good because that points to inflation decelerating rather than accelerating. However, the diffusion readings are consistently rising from 18.2% over 12 months, to 27.3% over 6 months, to 45.5% over 3 months – and moving more toward diffusion neutrality.

    Weak oil has been a tailwind for lower inflation Inflation progress has been helped along by weak oil prices in June. Brent oil prices measured in euros rose by 6.7%; they had fallen by 4.1% in May and by 10.7% in April. These are month-to-month calculations. Sequentially, Brent oil prices fell by 20.7% over 12 months, they fell at a 23.4% annual rate over 6 months, and they're falling at a 30% annual rate over 3 months. All of these metrics should have helped the inflation numbers to look more contained. When inflation falls over a relatively long period of time, it also has a chance to permeate non-energy measures and cause even non-energy inflation to edge a little bit lower. For now, weakness in oil prices has been a tailwind for German inflation progress.

  • The current and future economy watchers indexes advanced in June. In the current index, only services, housing, and employment readings weakened. In the future index, the reading for corporations weakened based on weakness for nonmanufacturing corporations. However, the improvement signaled is still quite downbeat since it only indicates that the ongoing deterioration is slower. The diffusion readings continue to be below 50, indicating pullbacks across all categories are still in train and are only letting up slightly.

    While the improvements in the month-to-month readings were widespread, they were mostly small and no reading in either the current or the future survey has a diffusion value above 50%. That means that all these economy watcher readings are actually showing deterioration although on the month the rate of deterioration slowed across most category readings. In fact, there are no month-to-month readings at or above 50 in either the current or future survey in the last three months. To get a category reading of 50 or higher, we must go back to February when the reading for future employment was 50. We go back to August 2024 to find a majority of future sector reading at 50 or higher and to March 2024 to get a majority of current readings above 50.

    The far-right hand column assesses the level of the June diffusion readings vs. past readings back to 2002. On that 23-year timeline, all the current and future readings have percentile standings below the 50% mark leaving all of them below their respective median readings for the period.

    In the current survey, retailing and nonmanufacturers with diffusion percentile standings in their respective 41st percentiles have the strongest queue readings. The weakest reading in the current survey are the 21st percentile standings for housing and for employment.

    For the future survey percentile readings, the strongest is a 45.5 percentile standing for eating and drinking places. The weakest future reading is the 24.5 percentile reading for employment.

    Seeing such weakness in the current and future indexes in employment a reading that is a lynchpin for all sectors is clearly not reassuring.

    At the bottom of the table, there are collected results for monthly data on month-to-month changes on the breadth of improvement. We see monthly that after a poor performance in April with most reporting categories worsening, May and June show most of them improving month-to-month on the order of 70% to 100%. Similar metrics for three-month and six-month changes perform much worse. These calculations are executed on changes in averages the twelve-month and average six-month and average 3-month data. On those comparisons, we see average diffusion is up broadly over 12 months compared to 12-months earlier. But the averages over six months and over three months are showing declines across all categories.

    While the monthly data are showing some month-to-month improvement, the broader data show that the pace of improvement linked to broad averages is still not in place. And it is still a nefarious since of ‘improvement’ for the overall readings in which the diffusion data are only signaling that the categories are getting worse at a slower pace. Japan continues to struggle with weakness as the Bank of Japan wrestles with inflation and the United States and Japan spar over tariffs.