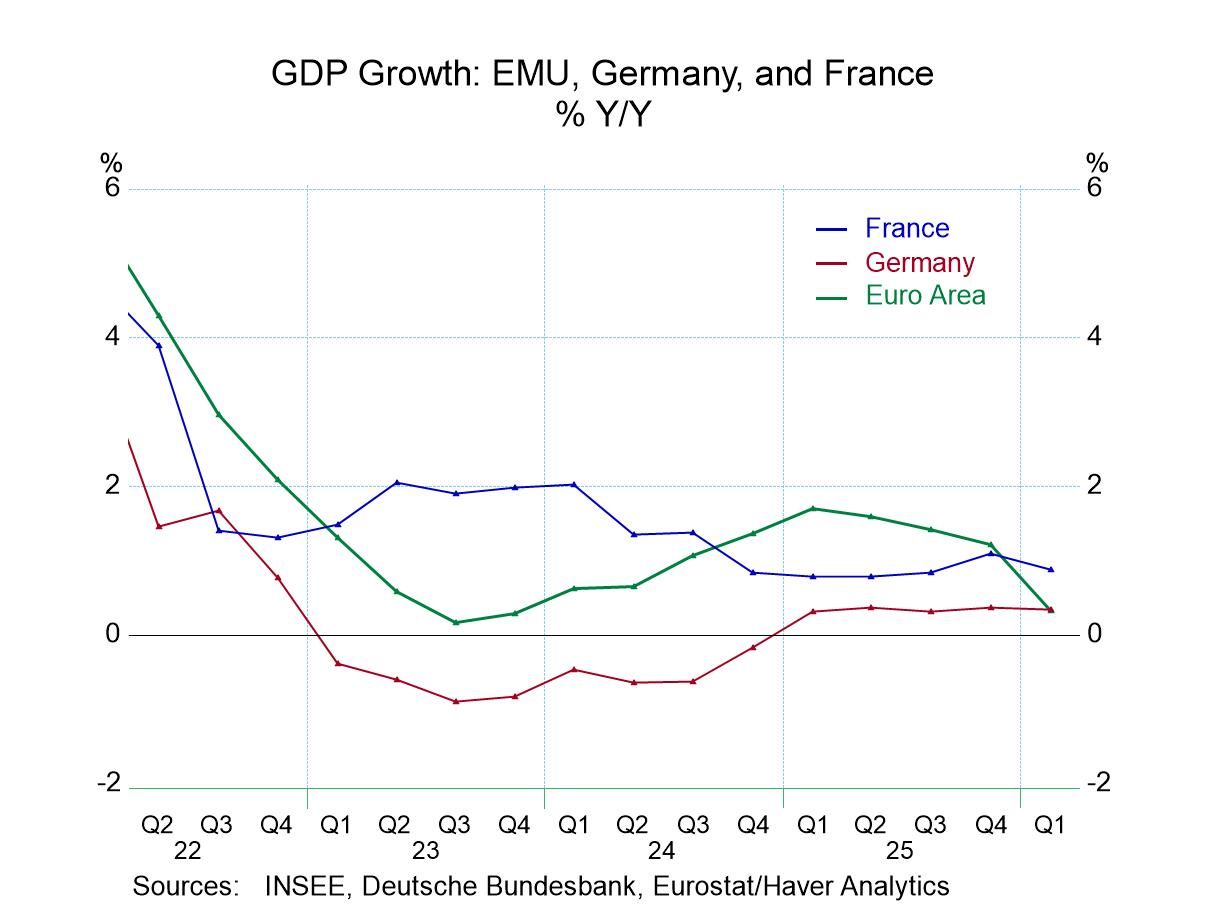
Haver Analytics
Haver Analytics

Introducing

Robert Brusca

Robert A. Brusca is Chief Economist of Fact and Opinion Economics, a consulting firm he founded in Manhattan. He has been an economist on Wall Street for over 25 years. He has visited central banking and large institutional clients in over 30 countries in his career as an economist. Mr. Brusca was a Divisional Research Chief at the Federal Reserve Bank of NY (Chief of the International Financial markets Division), a Fed Watcher at Irving Trust and Chief Economist at Nikko Securities International. He is widely quoted and appears in various media.   Mr. Brusca holds an MA and Ph.D. in economics from Michigan State University and a BA in Economics from the University of Michigan. His research pursues his strong interests in non aligned policy economics as well as international economics. FAO Economics’ research targets investors to assist them in making better investment decisions in stocks, bonds and in a variety of international assets. The company does not manage money and has no conflicts in giving economic advice.

Publications by Robert Brusca

  • Manufacturing production trends in the European Monetary Union (EMU) showed slippage in October, with the mean change in production among thirteen of the longest standing members posting a drop of 0.1% following a drop of 0.7% in September and a drop of 0.2% in August.

    Monthly trends Among these 13 members, seven of them posted declines in October including a decline in Germany, the largest economy in the EMU and in Italy, the third largest economy in the monetary union. September had produced declines in eight of the thirteen reporting members; that compares to seven that showed declines in August. On a monthly basis, slightly over half of the reporting countries have been showing declines on a regular basis over the last three months. The largest economy in the monetary union, Germany, has showed declines in two of those months. France, the second largest economy, has showed a decline in only one of those months. Italy, the third largest economy, has showed declines in two of those months. Spain, the fourth largest economy, has logged a decline in only one of those months.

    Sequential trends Sequential growth rates from 12-months to six-months to three-months do not show a clear pattern, but there is an improvement over three months where the median growth rate for these 13 countries is 0.4% at an annual rate. That compares to a decline of 3.1% at an annual rate over six months and a decline of 1.4% at an annual rate over 12 months. Over three months six of the thirteen countries showed declines in industrial production. Over six months, nine of the thirteen countries showed declines. Over 12 months, declines are logged in eight of the thirteen countries. The breadth of the declines in industrial production and the monetary union has therefore not been spreading but it is still significant. Among the largest countries in the monetary union, Spain, the fourth largest economy, does not show any declines in industrial production over 12 months, six months, or three months. Italy, the third largest economy, shows declines over all of those horizons. France shows declines over 12 months and six months; Germany also shows declines over 12 months and six months.

    Momentum: accelerations/deceleration Looked at over 12 months, 50% of the reporting monetary union countries show output accelerating compared to their growth over the 12 months earlier. Over six months 50% are accelerating compared to their 12-month annual growth rates. Over three months the percentage accelerating compared to six-months is slightly lower, at 45.5%. These statistics underpin the sense in which output growth acceleration or deceleration continues to be more mixed than it is dominated by a trend. The propensity for output to either accelerate or decelerate is hovering around the neutral value of 50% over twelve months, six months, and three months. That assessment is in the aggregate. There clearly are members that are showing more weakness and even progressive weakness although there are no members showing progressive acceleration. Greece shows progressive weakness with six-month growth weaker than 12-month growth. Three-month growth weaker than six-month growth and six months weaker than twelve months for the Netherlands, as well as for Belgium and Austria. There are no clear accelerating tendencies. Italy shows a drop in output over 12 months at a 3.7% annual rate then improves to a 1.7% annual rate drop over six months and over three months, making Italy the closest thing there is to showing an accelerating pattern among countries and the monetary union. Still, there are countries that are showing more strength even if it isn't consistent formally acceleration such as Malta that logs a 28.2% annual rate in output over three months and Portugal that has a 25.4% annual rate gain in output over three months. Spain shows output increasing on all horizons and has only a slight step down over six months compared to 12 months; it logs an increase at 14.8% at an annual rate over three months so even though it's not strictly persistent acceleration there's still evidence of some strengthening.

  • Japan
    | Dec 09 2024

    Japan: Economy Watchers

    Japan's economy watcher index improved in November. The future index also improved in November; however, both the current and the future indexes continued to produce readings below 50 indicating that contraction remains the order of the day.

    Economy watchers indexes remain weak These indexes have been skimming below the level of 50 for some time (3-month, current; 9-month, future). Weaker, yes, however, not by much. There is mild contraction indicated in both the current state of the economy and the expected future state of the economy. However, this is not an entirely unusual situation because the ranking of the current index is a 64-percentile standing which indicates the diffusion index is above its median which also sends home the message that a below-50 reading has some sense of normalcy to it for Japan (evaluated on data since 2003). The same is true for the future index, at 49.4, is below 50 and has a queue percentile standing at its 56.5 percentile, above its median for this same period.

    Current Index The current index has month-to-month index changes that are mid-range for a diffusion score of 50%. But October and September have diffusion scores below 50, showing more indexes are weakening month-to-month than are strengthening. Sequentially, the readings are compared on a period-average-to-period-average basis. The 12-months average improves in 90% of the components compared to the average of 12-months ago. Comparing the 6-month average to the average over 12 months shows that no sector improved. Comparing the 3-month average to the six-month average across line items, 60 percent of the sectors improved.

    Future Index The future index improved broadly month-to-month in November with a diffusion reading in November at 80%, up from only 10% in October and 30% in September. The diffusion reading on the future index over 12 months, 6 months, and 3 months, are similar to the pattern of the current indexes. There is strong breadth over 12 months, no improvement over 6 months compared to 12-months, and a reading showing 60% improvement over 3 months compared to 6 months. Note that these metrics are different from the period-to-period change in the table that is constructed from point-to-point data (not averages). But the signals really are quite similar (except for the 12-month point-to-point results, that show broad weakness in contrast the broad strength signal by comparing averages).

  • Germany
    | Dec 06 2024

    German IP Drops, Unexpectedly

    German IP fell by 1% in October, led by declines of 1% in consumer goods output, a 0.4% decline in capital goods output, and a 0.4% gain in intermediate goods. Output had fallen and fallen sharply across the board in September. That fall was one of the main reasons that expectations this month were slated for a bounce-back.

    Despite this, the pace of decline has slowed over three months. German IP falls by 4.7% over 12 months; it drops at an annual rate of 9.1% over six months and then drops at a three-month annualized rate of 1.8%. Consumer goods output comes closer to having an ongoing accelerating decline in progress. Capital goods output declines at a 4.9% pace over 12 months and declines at an 8.1% annual rate over six months then shifts to log a strong 9.8% increase at an annual rate over three months. In contrast, intermediate goods output shows declines on all horizons without and clear trend beyond that.

    Surveys for German industrial performance generally get weaker from 12-month to 6-month to 3-month, except for IFO manufacturing expectations that fluctuate and side-slip. France, Spain, Portugal, and Norway report early IP data for October. Sequentially, only Spain has a pattern and that is accelerating. The rest show fluctuation but three of the European countries (exception, Norway) show IP rising over three months.

    Still, the queue standings for the various metrics in the table are uniformly low. Among the 18-rankings in the table, only three of them stand above their 50-percentile which puts them above their respective historic median year-over-year gains. Spain and Portugal show historical strong manufacturing IP gains while for Germany real orders have a standing above their historic median.

    On balance, it is another disappointing economic report for Germany. The manufacturing sector remains under pressure although there is some evidence of slightly better growth in other European economies. For the most part, the quarter-to-date readings show ongoing weakness.

  • German real orders fell by 1.5% in October after a surge of 7.2% in September. However, the September surge had followed a plunge of 5.4% in August. The German order series have been extremely volatile with volatility present both in the foreign series and in the domestic series. Foreign orders rose by 0.8% in October after jumping by 9.3% in September; that followed a 1.9% drop in August. Domestic orders fell by 5.3% in October after rising 4% in September. The September gain followed a 10.1% drop month-to-month in August. These have been extremely volatile times for orders.

    Sequential order patterns- Sequentially orders are up 5.8% over 12 months; they’re up at a 14.2% annual rate over six months but now they’re falling by 0.4% over three months. Foreign orders show a continuing strong and even accelerating trend with orders up by 13.7% over 12 months, then rising at a 25.4% annual rate over six months, stepping up to a 36.5% annual rate over three months. In contrast, domestic orders fall by 5.3% over 12 months but then trim that rate of decline to -1.5% at an annual rate over six months. However, over three months German real domestic orders are falling at a 38.5% annual rate. As you can see, the weak domestic orders and the strong foreign orders nearly cancel one another out with an overall order result of minus 0.4% over three months.

    Sales trends- Sales trends show a little bit more stability but still some volatility. Here we will focus on total manufacturing sales. Manufacturing sales fell by 1.2% in October after falling by 1.1% in September; in August real manufacturing sales had risen by 3%. I will not detail the growth rates here; you’ll find them in the table. However, looking at sales growth rates for consumer goods, consumer durables, consumer nondurables, capital goods, and intermediate goods, you see across each one of these sectors a significant amount of volatility in sales month-to-month from August to September to October.

    Sequential real sales- Sequentially manufacturing sales fall by 3.8% over 12 months; they step-up to a decline of 5.5% at an annual rate over six months and then, over three months, there’s a turnaround in the trend as real sales rise at a 2.6% annual rate. Overall consumer goods, capital goods, and intermediate goods show declines in sales over 12 months and over six months. Over three months, consumer goods sales make a small decline, while capital goods sales surge at an 11.4% annual rate, and intermediate goods sales rise at a 4.2% annual rate. The turnaround and stability to overall real sales by sector owes substantially to capital goods, and to some extent intermediate goods, where sales have firmed up over the last three months after having a legacy of declines over six months and 12 months.

    Europe – Beyond Germany The bottom of the table looks at industrial confidence readings from the European Commission for Germany, France, Italy, and Spain. All the readings for the last three months are negative readings and for each of the countries there’s a deterioration in October compared to September. All countries also showed deterioration from August to September. Spain in September is an exception. The sequential readings from 12-months to six-months to three-months show German industrial readings are negative and getting worse in each horizon. Italian readings are negative and getting worse on each shortened horizon as well. French readings are negative over 12 months; they’re worse over six months but then improve by just a tick over three months compared to six-month readings. For Spain, readings are negative and all the periods; however, they improve over six months compared to 12-months and then they improve again over three months compared to six-months although these improvements are stepwise small changes.

    Quarter-to-date- The quarter-to-date readings show that orders are increasing early in the fourth quarter at a 7.5% annual rate. Foreign orders are surging at a 43.6% annual rate and domestic orders are contracting at a 32.1% annual rate. Total manufacturing sales are falling at a 5.6% annual rate in Germany with consumer goods sales rising 2.6% at an annual rate. Intermediate goods sales are up at a 2.3% annual rate and capital goods sales are falling at a 1.6% annual rate.

    Europe’s rankings- For the industrial data, I present the queue standings for Germany, France, Italy, and Spain. We see Germany with the lowest industrial queue standings in their bottom 5.6 percentile. France stands in its 12.5 percentile; Italy stands in its 18.4 percentile; Spain has the relative strongest readings with a 32.7 percentile standing which puts Spain as the strongest respondent in the table even though in the lower third of its own historic queue of industrial readings. All of these are extremely weak readings, and these are the four largest economies in the European Monetary Union.

  • Overview: “MIXED” at weak levels of activity- The S&P composite PMI readings for November continue to show a mixed bag of activity globally among the 25 national jurisdictions in the table. The average reading in November slipped to 51.7 from 51.9 in October; the median reading slipped 51.7 in November from 51.8 in October. There are 7 reporting jurisdictions with diffusion readings below ‘50’ indicating a contraction in overall economic activity in November, the same number as in October but down from a count of 12 in September. The breadth of slowing in November is at 44%, which is more slowing than in October, when only 24% of the reporters were slowing month-to-month. But both of those readings are much stronger than in September when 84% of the reporting units slowed down on a month-to-month basis.

    Reading this table: In addition to summary data at the bottom of the table to provide some numerical benchmarking to the indications in the table (below), I use color-coding and shading to indicate other trends. The month-to-month or the period-to-period changes in activity are flagged by the word ‘better’ or ‘worse’ with ‘worse’ appearing in red and ‘better’ appearing in black to create an easier visual image of how countries are doing over these time horizons. Shading is used to reveal rankings below ‘50’ for diffusion data. Diffusion readings below 50 indicate contraction. At a glance, we can see that the weakness is really concentrated in the large western economies with the European Monetary Union, specifically, Germany and France, and sporadically, Italy, showing a proliferation of below ‘50’ readings. Sweden, Russia, and Australia have below ‘50’ readings in September but have since shaken those off in subsequent months. Zambia and Egypt have been consistently below ‘50’ readings and Nigeria is in that same club except for its 12-month average. Kenya and Ghana had a below ‘50’ reading in September but have since shaken those off.

    Queue standings are WEAK! - The queue standing data take the diffusion readings and place them in a queue of data over nearly the last five years. The far-right hand column labeled “queue %” provides these standings. The benchmark here is that a standing of 50% identifies the median for the period so any reading above 50% is above its five-year median; anything below 50% is below its five-year median. I color-code these to make them easier to summarize at a glance with the below 50% readings in red in the above 50% in readings in black. Fourteen of the 25 readings have standings below their approximate 5-year medians. This weakness is concentrated in large economies with the U.S. as a clear exception having a 66.7 percentile standing, but the European Monetary Union, Germany, France, and Italy all have standings below their 50th percentile, as does the United Kingdom. In Asia, Japan and China have standings that are slightly below their respective 50th percentiles.

    The bigger they are, the harder they fall? - The largest economies are having the biggest problem shaking off the weakness in the wake of COVID and in the wake of their COVID policies. Sequential data that compare three-month, six-month, and 12-month periods and the changes in activity over those periods show that the overall average has really been quite static although there is a very slight erosion in play with the overall average at 51.9 over 12 months slipping to 51.8 over six months and to 51.7 over three months. This is sequential hair-splitting weakness. The median values follow in step with a median of 51.3 for the 12-month average, slipping to 51.1 for the six-month average and staying at 51.1 for the three-month average of the cross-section median values. Over 12-to-6-to-3 months, the number of jurisdictions below ‘50’ fluctuates between 6 and 7; across these periods, there is not much change. Beyond the sequential movements of the average and the median, we can look at the percent slowing; the percent slowing has been creeping up. Over 12 months 43.5% of the reporting units are slowing, over six-months 60.9% of them are slowing, and over three months 78.3% of them are slowing. While the aggregate data on medians and averages show only a very slight erosion across jurisdictions, the count of areas where activity is actually slowing has actually been rising demonstrably.

  • Money growth is accelerating globally as money growth is positive over 12 months in all countries in the table as money supply completes the transition from contracting to expanding in the wake of the Covid disruption. European Monetary Union money growth is up by 2.6% over 12 months, U.S. money growth is up by 3.1%, U.K. money growth is up by 3.4%, and Japan's M2 plus CDs is up by 1.2% over the last year.

    In the United States and the euro area both show money growth accelerating from 12-months to six-months to three-months. The U.K. shows fairly steady increases in the growth rate of money supply with a slight step down over six months; that then has speeded up over three months. Japan's money growth shows positive growth rates over each horizon without a clear trend developing from 12-months to 3-months.

    In inflation-adjusted terms (or real terms), the euro area shows accelerating money supply growth. The U.S. shows the same trend with money growth picking up from 12-months to six-months and then holding that higher growth rate over three months. In the United Kingdom, real money supply growth is slowing - but only very slightly. Japan's real money supply growth shows contractions over 12 months, over six months, and over three months. Japan doesn't exactly show a trend but the declines over three and six months are deeper than the annual rate decline over 12 months.

    The euro area shows positive credit growth in nominal terms over three months, six months, and 12 months. In real terms, the euro area shows positive credit growth over three months and six months, after shaking off a decline over 12 months.

    The year-over-year chart of money growth shows some clear trends for money growth where the U.S., the euro area, and the U.K. demonstrate clear accelerating trends in money growth are underway. For Japan, money growth continues on a very long and slow decelerating path that dates back to 2021 and then shows a slight pick up the pace of deceleration in 2024.

  • Globally unemployment rates are continuing to move sideways or falling but the main exception is the United States with some recent increase in unemployment; unemployment in the U.S. has recently picked up from its cycle low in the wake of the Covid recession and government policies to deal with it.

    In the European Monetary Union, the unemployment rate has had its low and it's been stuck here for several months. Despite some disquieting and weak economic data for the monetary union, unemployment has stayed at an extremely low level- its all-time low.

    Among the 12 countries listed in the table, 5 of them have higher unemployment rates month-to-month with only Italy seeing the unemployment rate fall in October compared to a month ago. Countries experiencing a rise in their local unemployment rates are Finland, France, Luxembourg, Ireland, and Greece.

    In terms of the monetary union aggregates, total unemployment continues to fall in the union as a whole over 12 months, over six months, and over three months.

    Unemployment rates fell in only three of the EMU countries listed in the table one month ago. Two months ago, in August, unemployment rates fell in seven EMU member countries, while unemployment rose month-to-month in only three. The impetus for unemployment rates to drop is running out of steam while the list of countries experiencing higher rates of unemployment is rising.

    Over broader periods, trends are less clear as there are the same number of countries with unemployment rates falling over three months as there are over six months. Over 12 months, there's one more country that experiences a decline in its unemployment rate compared to the count over three- and six-month horizons. Over three and six months, unemployment falls compared to the previous period in four countries; over 12 months compared to 12 months ago, unemployment rate falls in five countries. So the process of unemployment reduction has slowed then stabilized, based on comparing these trends.

    The overall trend as well as the trend for countries in the EMU as well as for the U.S. and Japan shows mostly tempered unemployment rates with unemployment falling or low but with nine showing 12-month increases. Finland and the U.K. show the sharpest 12-month increases. However, global PMI data, for example, and other global data, continue to show more economic weakness. So far that weakness has not permeated the job market that continues to be strong globally, despite some -so far- not very significant backtracking.

  • The GfK reading dropped to a seven-month low, a fall of 4.9 points month-to-month, the 8th largest month-to-month drop in the last 20 years.

    In May 2022, the GfK index fell sharply from a level of -15.7 to -26.6. From that point, the reading migrated down to levels as low as -42.8, but it's continued with only a few exceptions to remain at readings of -20 or lower during this period. November 2024 had logged only the second reading that was stronger than -20 during this long episode at -18.4. But now the climate reading is back to -23.3. The German economy is struggling without any clear new shock to blame it on. The two shocks responsible for sending GfK confidence into such a tizzy were, of course, the arrival of COVID and the government response to that pandemic, and then Ukraine's invasion by Russia. The COVID and Russian episodes brought on a surge of global inflation. Globally, central banks are still dealing with it. Inflation continues to linger at a too-high level and the European Monetary Union, although the ECB has been reducing rates steadily and is focused on trying to stabilize the economy and as well as to be mindful of its 2% inflation target.

    The global situation has resulted in the unseating of many governments around the world including in Germany. This disruption extended to a long-standing domination of politics by the LDP in Japan. These circumstances are causing many governments around the world to blame their ouster on global economic conditions rather than to engage in self-introspection necessary to reconstitute their political parties. Time will tell how the new arrangements are going to work out. In the U.K., the new government is already floundering. The Jury is out on what Germany’s new administration will do. One thing will be to interact with a new more forceful president in the United States.

    The GfK confidence/climate measure provides indications for economic and income expectations as well as an assessment of the propensity to buy environment. The components of the GfK index lag by one month so we have observations for these metrics in November. In November, each of these 3 readings drops and negative readings are recorded for all of them. Income expectations fall the most sharply month-to-month. The queue-percentage or count-percentile standing of the climate index overall is in its 9.5 percentile that tells us it has been this weak or weaker 9.5% of the time historically. The economic gauge has been this week or weaker 29.7% of the time, income expectations have been this weak or weaker 28.5% of the time, and their propensity to buy has been this weak or weaker 30.8% of the time. Conditions across these metrics are consistently weak coalescing around lower 30 percentile standing, which, of course, is a poor result. There is a significantly lower standing for the overall climate gauge; that is reflective of the fact that these three gauges are not usually this weak at the same time. The combination of these three low rankings help to push the overall climate reading even lower.

    We also present in this table data on confidence for Italy, France, and the United Kingdom. U.K. and French data are up to date as of November (the same as the components for the GfK index), while Italy lags two months. Italy’s most recent observation is for October. The queue- or count-percentile standings show France, and the U.K. are low and similar to the standings of the components of the GfK index. The U.K. standing is at its 32.8 percentile and the French confidence measure is at the 45th percentile. In Italy, the ISTAT index of confidence has a 77-percentile standing, leaving it much stronger in its historic range. When we look at standings, any metric below the 50% mark is below its historic median; all of these measures are showing below-median values except for Italy.

    On balance, it's a very disappointing report from GfK. It is not surprising because other economic data have remained weak, particularly for Europe, and for Germany during this recent period. The GfK reading is a look-ahead reading for December. As such it's our first reading/projection for December and it isn't good news.

  • The U.K. Distributive Trades Sector Struggles Quarterly data from the United Kingdom distributed trades survey for the fourth quarter show mixed results from participants although data are still quite clearly weak across the board and, when at their very best, are no better than neutral.

    Distributive Trades: Retailing The distributive trades survey shows that imports improved in the fourth quarter to a reading of -6 from -15 in the third quarter. The four-quarter average has been around -11 so this is an improvement relative to the average. Capital spending for the year ahead also made some improvement in retailing to a -27 reading from -35 previously; however, that's still weaker than the four-quarter average of -24. The business situation expected over the next six months; however, deteriorated to -21 from -13 and that's much worse than the four-quarter average of -7. Inflation continues to be an issue in the U.K. although it is moderating. It may be an important reason the business situation is eroding. However, selling prices in the fourth quarter are weaker than in the third quarter at a +24 reading compared to +30 in the third quarter; however, that's a lower reading than the four-quarter average of +32. Employment expectations strengthened to -18 from -25 in the third quarter and that's better than the four-quarter average of -22, indicating some ongoing improvement, the survey on employment. Expected data show that price inflation is expected to be weaker at a +15 reading in the fourth quarter compared to +30 in the third quarter- this compares to a four-quarter average of +43 so inflation progress is being made. Employment expectations, however, are weakening at a -28 reading for the fourth quarter compared to -18 in the third quarter; compared to a four-quarter average of -16. The negative expectations for employment are getting worse.

    Distributive Trades: Wholesaling Turning to wholesaling, reported imports are deteriorating, the opposite result that we saw for retailing, with a +7 reading in the fourth quarter compared to a +14 reading in the third quarter; however, the +7 reading is only a tick weaker than the +8 four-quarter average for imports. Capital spending is slightly improved in the fourth quarter compared to the third quarter although slightly weaker than its four-quarter average with a -15 reading for the fourth quarter and a -12 four-quarter average. The business situation expected over the next 12 months deteriorates sharply in the fourth quarter, falling to -12 from a +20 in the third quarter; those readings compare to a four-quarter average of +10, confirming that business expectations are a problem. The selling price for wholesaling ticked up in the fourth quarter to +14 from +12 in the third quarter, but that's significantly lower than the four-quarter average of +24. Inflation progress is being made but HICP data show that inflation, while better, continues to run at a pace above trend. Employment fell off sharply in the fourth quarter; the fall was to a net reading of zero after +14 in the third quarter; those metrics compare to a +9 reading over the last four quarters. Expected prices in the fourth quarter improved significantly (slowing their gain) to +11 from +31 in the third quarter and that survey compares to a +28 over four quarters. Employment expectations in the fourth quarter also declined to +11 from +18 in the third quarter, but they continue to sit on their four-quarter average.

    Summing up The rankings are presented in the table and there are but two exceptions where rankings stand above the 50th percentile. Most readings stand below a ranking at the 50th percentile, which puts them below their historic medians calculated from data back to the first quarter of 1990. Only wholesaling imports at a 51.4 percentile standing and expected employment in wholesaling at a 70 percentile standing, have standings above their 50th percentiles. However, wholesaling employment trends over the past have a 49.3 percentile standing, fairly close to neutral, but everything else in the table shows numbers that are quite significantly below the 50th percentile, frequently and most commonly, below the 30th percentile standing. These are readings that have been weaker than their fourth quarter values less than 30% of the time for the most part. Some of them are much weaker than that. The U.K. clearly is experiencing difficulty. There's barely any evidence of any rebound in this survey and only a few categories are improving somewhat in the fourth quarter compared to the third quarter. None of this is very convincing on trend. The ranking data tell us the conditions continue to be extremely weak. The trends tell us that there's very little improvement and still much deterioration going on. It's a grim report for distributive trades survey from the United Kingdom for the fourth quarter. Wholesaling rankings stand broadly higher than those for retailing but without much meaning since both are so weak.

  • Covid slammed the global economy and hit Germany hard. But the German economy recovered as the chart shows. Then the Russian invasion of Ukraine occurred and sent a second, more lasting, shock wave across the German economy. Government restrictions during Covid were put on and then taken off. But the Russian invasion occurred as a shock and continues to play out disrupting European energy markets, trade, and trade patterns, as well as leaving heightened international tensions in play.

    This month’s report includes a table column that ranks the IFO diffusion gauges across industries and concepts since the Russian invasion of Ukraine. The climate gauges are all low ranking on a 1991-to-date basis as well as ranked just since the invasion. Wholesaling, retailing, and services do rank slightly higher over the post invasion period than overall, but the ranking changes are not really meaningful. What these rankings point out is how weak conditions got after the invasion compared to historic lows and how substantially that weakness has persisted.

    The current conditions index shows deterioration month-to-month for the overall (all-sector) reading as well as for two individual sectors (construction and services). However, the current rankings over data since the invasion are universally and substantially lower than the rankings made on data since 1991. The all-sector current index is on a post invasion low. Manufacturing, construction and services in the past invasion period are still extremely low.

    What has fared better are expectations. The November expectations standing on data back to 1991, the overall ranking is at its 14.2 percentile. But ranking expectations since the February 2022 invasion shows that expectations have lifted substantially from the post-invasion lows with readings largely in the 60th to 70th percentiles. However, even with these rebounds, the overall ranking shows how extremely low the current reading stands in November.

    Apart from the rankings, the all-sector diffusion readings are weaker in each of the three ranking environments of climate, current conditions, and expectations. Month-to-month expectations worsen for manufacturing, construction, and services even though those sectors show much higher rankings since the invasion compared to their overall rankings back to 1991.

    These comparisons simply point out that there is little in the way of lasting improvement underway. Conditions are better relative to their median values since the invasion for expectations, but not for climate or current conditions. And despite this improved relative standing for expectations, the expectations readings are especially adverse and without an improving trend.

  • Global| Nov 22 2024

    S&P Flash PMIs Sag Globally

    Manufacturing readings fall by a 'tick' in November, but service sector metrics eased by nearly a full point on average. These calculations are for unweighted averages of the above observations. US trends are opposite, so that the overall averages become worse when the US is excluded.

    In November the eight reporters in the table have stronger composite readings reported in only three countries, in Japan, India, and the US. The US is the only reporter in the table to show improvements in manufacturing, services, and for the composite at the same time, in November. The UK, France, and EMU each report increased weakness across the composite, the manufacturing sector and in services in November. Among the 24 readings across eight reporters (…and three sectors for each reporter) in November only nine of these twenty-four are stronger month-to-month. This compares to ten in October and eight in September. Weakness has dominated strength over the past three-months across these readings.

    Sequentially we look at 12 month, 6-month, and 3-month averages of finalized data, we see only six of twenty-four stronger over three-months compared to 6-months, after the 6-month averages were broadly stronger showing weakening in only seven of twenty-four cases. Over 12-months there were only nine weakening compared to 12-months ago and they were all confined to three economies: Germany, France and Japan. The unweighted averages of these reporters show little change in the averaging of these sector reading over 3-months, 6-months and 12-months.

    The queue rankings underscore the sense of weakness. Assessed among the most industrialized countries, the US is starting to gain separation as its service sector is carrying it to a better overall (composite) standing. The US composite standing is at 69.5% and compares to Japan, the UK, France, Germany and EMU whose highest standing for the composite among these five reporters is a reading of 42.4% -as the group produces an average standing at the 26.1%.

    The US is still strongly ‘plugged into’ the global economy as its manufacturing sector is still the third weakest by queue percentile standing in the table. But the vibrant US services sector is the economy’s guiding light – plus manufacturing has improved for two months in a row. The global economy is still floundering while the US shows signs of strengthening.

  • UK improvement is shallow - The UK total orders position improved in November, but the reading went up to -19 from -27 in October, remaining deeply in negative territory. Looking ahead over the next three-months, finds volume improved to a +9 reading from -1 in October, while prices expected over the next three-months move sharply higher to a reading a + 11 from a reading of zero in October. The month-to-month movements show changes in the positive direction; however, the readings show that orders are still net negative readings and the broader standings for these assessments are still low.

    Orders- Total orders in November that moved to a - 19 reading also represent an improvement from the 12-month average of -25, export orders that were unchanged month-to-month at -27 we're also stuck at the same average value they've had over 12-months at -27. On the export front, orders reveal that nothing has changed at all.

    Stocks assessments- Stocks of finished goods rose to a + 21 level from +17 in October and compare to a 12-month average of 13. Rising inventories at a time when orders are not improving may be an ominous indication of what lies ahead. The outlook for volume three-months ahead improved month-to-month but the +9 reading from November compares to a +8 reading over its six-month average and a + 8 reading for its 12-months average. November shows an improvement from October but not much of an improvement from what had been the main conditions over the last 6- and 12-months.

    Prices firm- Meanwhile prices are showing some pressure with the reading of +11 that is stronger than the +6 that we've seen over three-months and the average of +9 over 6-months. The November reading is slightly weaker than the +13 reading over 12-months. However, this sequence of readings seems to suggest that the disinflationary forces are abating and inflation at some level once again is going to become an issue.

    Broader standing evaluated in November- Backing away from the diffusion levels and the survey levels per se, we can look at the queue standings for these levels to get a better assessment of where this months’ survey responses lie and a broader historic perspective than just month-to-month or over 12-months. Total orders evaluated over data back to 1992 have a standing in their 35th percentile. Export orders occupy their 31st percentile. The stocks reading for finished goods has a very high, 93.9 percentile standing, which, as I noted above, is not good news in an environment where the outlook for sales and orders is not expanding solidly. Output volume for three months ahead has a 46-percentile standing which is below the median value that occurs at a percentile standing of 50%. And while that's slightly below median, it's not dramatically below the median, and it comes closer to putting the UK economy back into some kind of moderate equilibrium even though there's a modest shortfall form the median in November. On the price front, the percentile standing is about at its 65th percentile, which makes it mildly inflationary. Inflation forces are above their median value on data back to 1992, however, a reading in the 65th percentile is only moderately firm. The more pressing issue is that it comes in a period where the UK has been running persistently excessive rates of inflation.

    Compared to lagging IP trends- UK industrial production data are up-to-date through September. September showed a decline in industrial production of 1%, the three-month decline in this lagged industrial production reading is at about -4% annualized; over 6-months it's -2 1/2% annualized, and over 12-months it's a little bit less than a 1% decline. These sequential readings are not reassuring because they show that industrial production has been declining at increasingly faster rates of change rather than at diminishing rates of change. Output does not seem to be righting itself, even though in the CBI survey the outlook for volume has been firming back to 12-month average levels.

    Summary and assessment- The outlook for volume has been oscillating in a very low range for the last two-years after going through a bust and boom cycle related to COVID and its aftermath. The expected volume series now is making some upward adjustment after a minor downturn that seems to have followed a modest upswing. There's nothing in this report that suggests that there's any kind of lasting improvement in the works, although it's reassuring to see that the recent weakness is dissipating. The order book balance, however, remains in deeply negative territory and while the CBI order readings had been much weaker during the COVID period, apart from the COVID period, we are looking at a string of consistent weakness that otherwise hasn't been seen at least back to 2014. In addition, there is some resurging pressure on inflation. All this makes picture for UK industry less than positive, despite some month-to-month improvement in November.