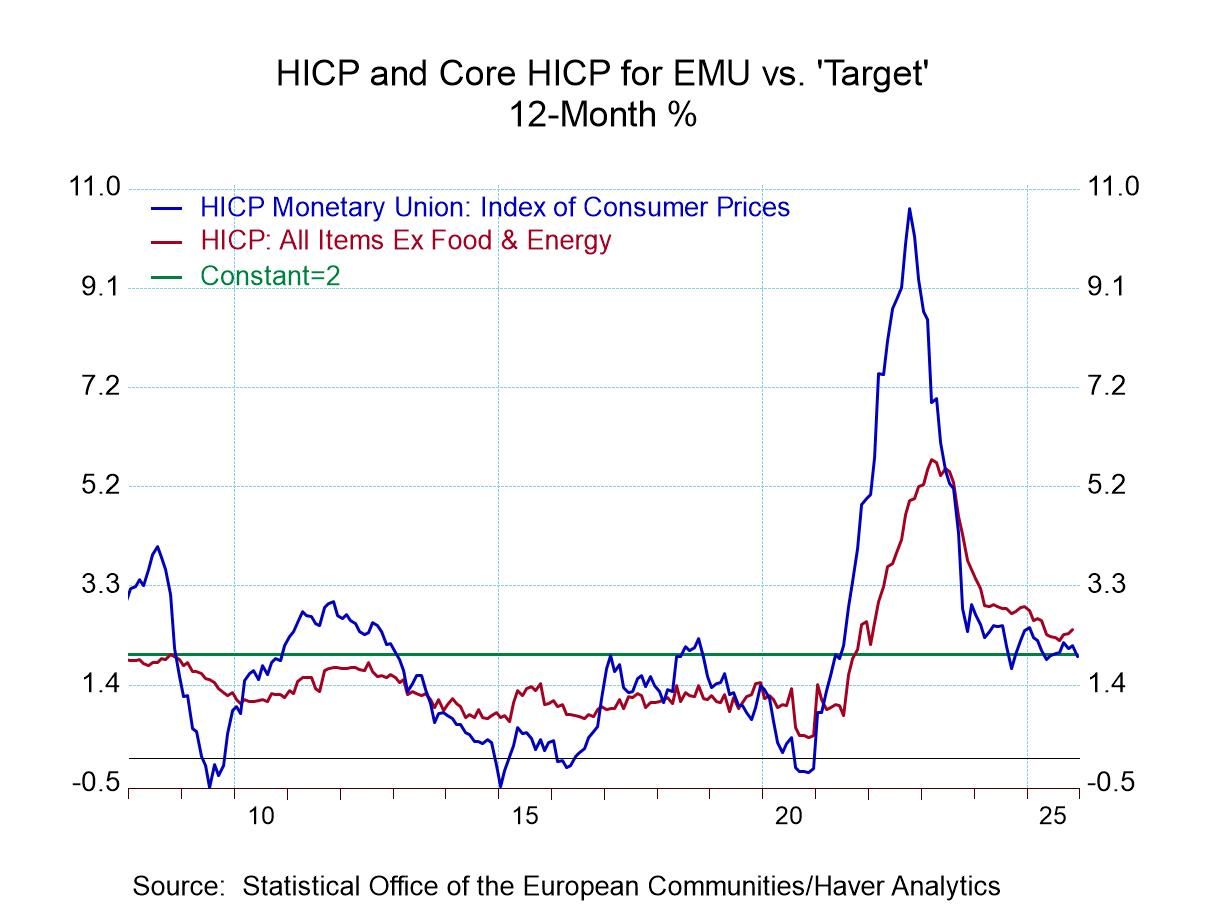
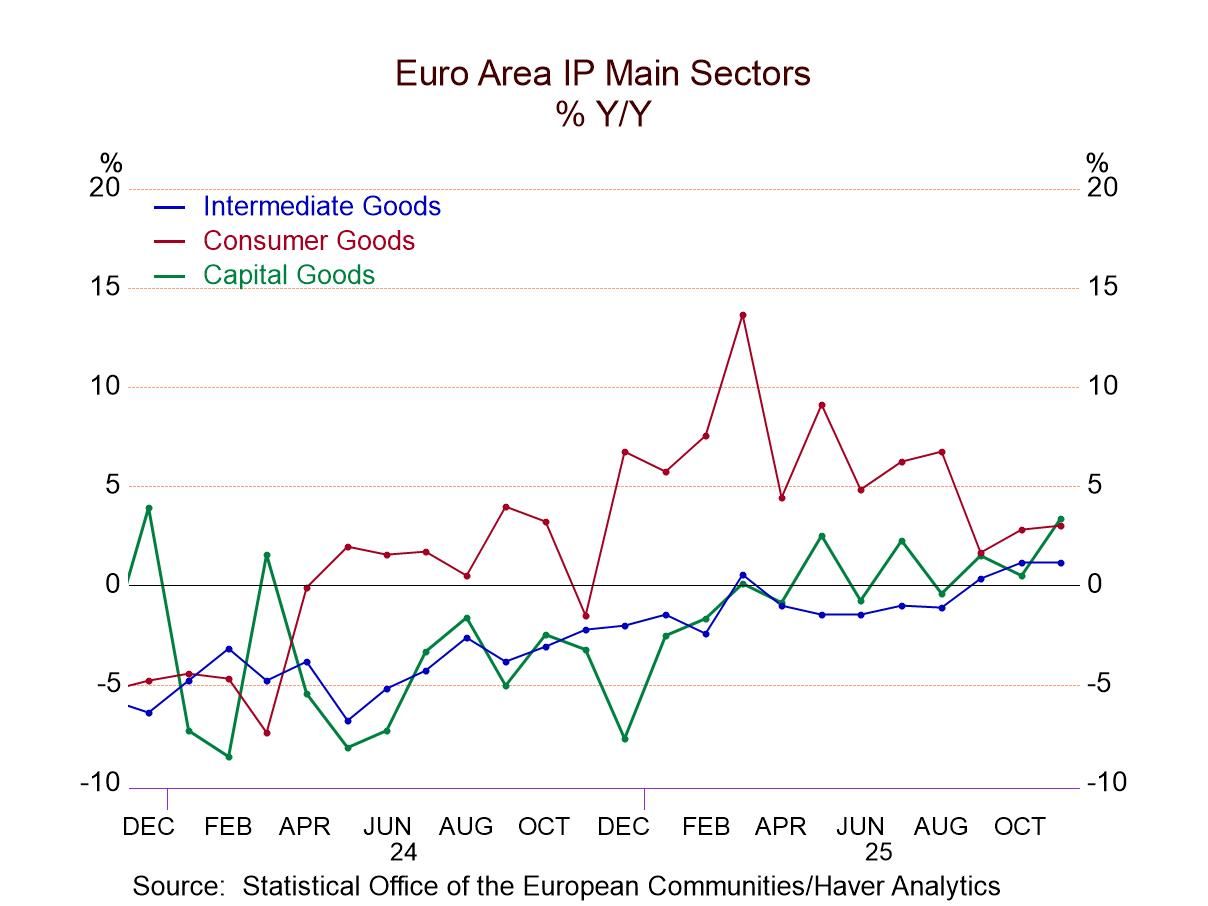
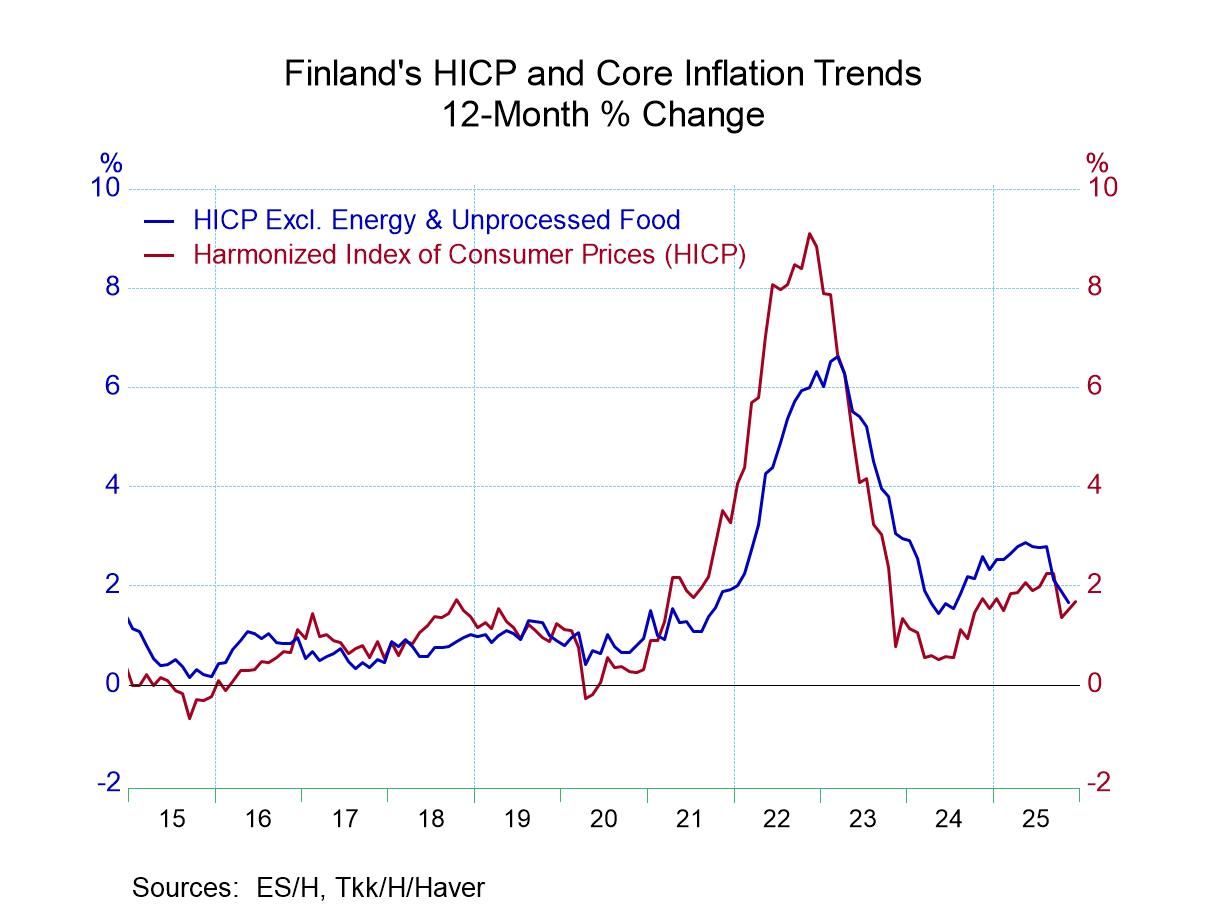
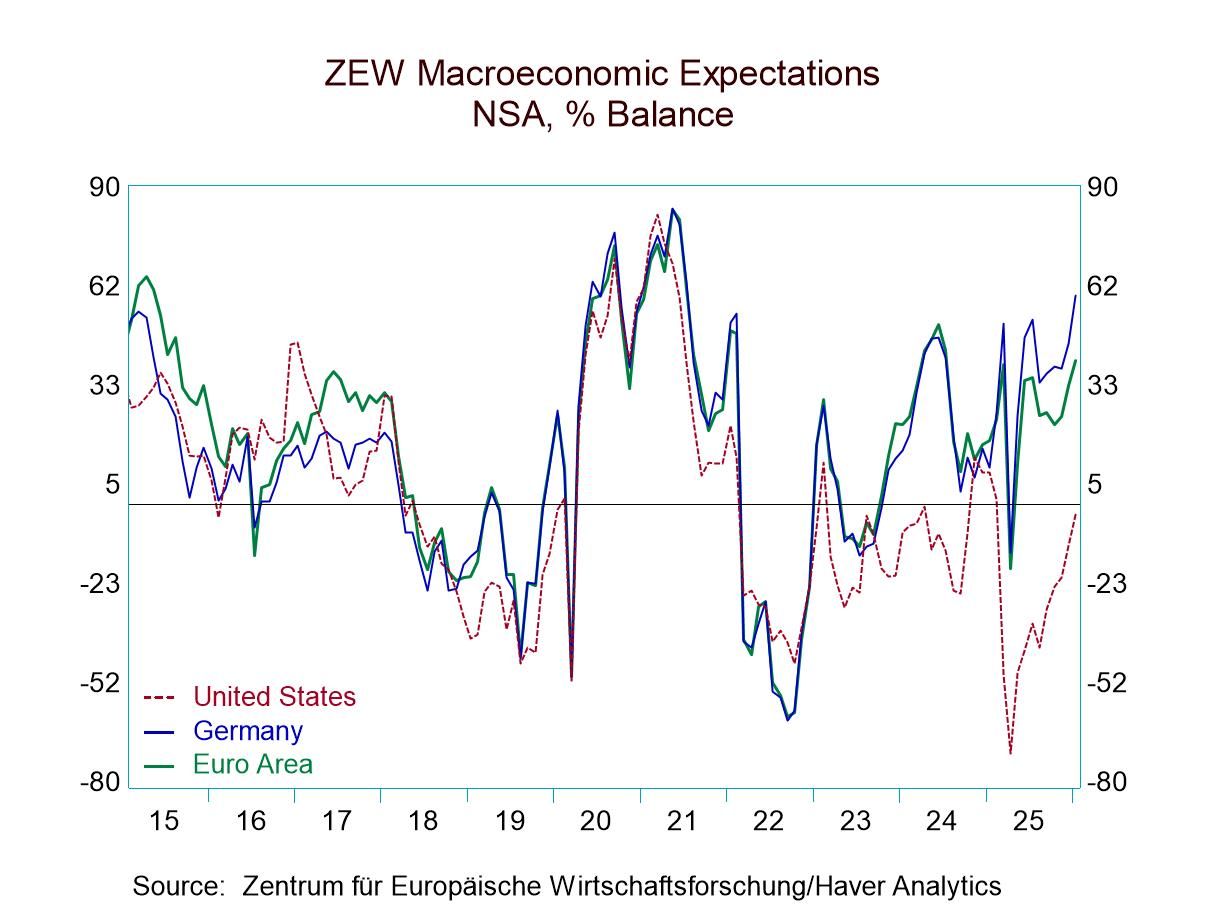
Haver Analytics
Haver Analytics

Introducing

Robert Brusca

Robert A. Brusca is Chief Economist of Fact and Opinion Economics, a consulting firm he founded in Manhattan. He has been an economist on Wall Street for over 25 years. He has visited central banking and large institutional clients in over 30 countries in his career as an economist. Mr. Brusca was a Divisional Research Chief at the Federal Reserve Bank of NY (Chief of the International Financial markets Division), a Fed Watcher at Irving Trust and Chief Economist at Nikko Securities International. He is widely quoted and appears in various media.   Mr. Brusca holds an MA and Ph.D. in economics from Michigan State University and a BA in Economics from the University of Michigan. His research pursues his strong interests in non aligned policy economics as well as international economics. FAO Economics’ research targets investors to assist them in making better investment decisions in stocks, bonds and in a variety of international assets. The company does not manage money and has no conflicts in giving economic advice.

Publications by Robert Brusca

  • The INSEE household confidence indicator in January 2025 rose to 91.7 from 88.6 in December; the index sits now at a three-month high; it's still below its October level of 93.5.

    • Living standards over the next 12 months are expected to show improvement as the reading moves to -47 in January from -58 in December. • Unemployment expected over the next 12 months is lower with a net diffusion reading of 47 in January compared to 54 in December.
    • Price developments show expectations for weaker inflation ahead over the last 12 months. Past price developments move from a reading of three in December to two in January. Looking ahead to the next 12 months, the reading falls to -43 from -33, a significantly weaker outlook for inflation. • The ability to save over the next 12 months is unchanged in January compared to December. The favorability of the savings environment is slightly better at 38 in January compared to 34 in December. • The favorability of the environment for making a major purchase is slightly better but little change, with a reading of -28 in January, up from -29 one month ago. • And the financial situation over the past 12 months as well as the next 12 months is improved slightly from what it was in December. Over the past 12 months, conditions were assessed at -22 compared to -23 a month ago; over the forward-looking next 12 months, the outlook has a reading of -10 in January, an improvement from -14 in December.

    Some monthly improvement but still a weak report On balance, however, the household confidence index is weak. We rank it among its various values since January 2001 (Rank % column); the ranking is in its 36th percentile, barely above the lower one-third of its historic queue of data. Living standards over the next 12 months mark a 27.6 percentile standing while the expectation for unemployment over the next 12 months is a relatively high 67-percentile, leaving it in the top one-third of its historic rankings – an uncomfortable level for ‘expected’ unemployment. Note that it does not mean that two-thirds of the respondents expect unemployment. The ranking just means that whatever the level of unemployment that is expected that expectation is higher only about one-third of the time.

    Price developments showed that over the past 12 months, the inflation expectation stood in its 52.5 percentile. However, looking ahead, that has dropped-down to its 18.6 percentile; a significant improvement in the outlook for inflation.

    The favorability and ability to save over the next 12 months are both high readings and their high, 97th percentile responses to this question, often indicate economic impairment. When the rankings are high for savings, conditions are often under stress. The favorability to spend to execute a major purchase improved slightly month-to-month, as we saw above, but has only a 20-percentile standing, a lower one-fifth reading for the favorability to spend.

    The financial situation over the last 12 months had a 54-percentile standing; looking ahead to the next 12 months, it seemed to be slightly weaker with a 48-percentile standard, slightly below its historic median.

  • The IFO climate gauge deteriorated in January, falling to -26.7 from an index value of -26.0 in December. Climate deteriorated in manufacturing, construction, and retailing; it improved in wholesaling and in services. The wholesale gauge improved from -35 in December to -32.4 in January while services improved to -2.2 in January from -5.6 in December. Clearly, the economy is experiencing cross currents with the important services sector improving but deterioration having a larger impact on overall climate.

    Current conditions showed improvement in January with the all-sector index improving to -3.9 from a reading of -6.2 in December. Current conditions improved across the board for all reporting sectors. The largest month-to-month improvements by sector are for wholesaling and services.

    Expectations worsened over-all month-to-month. The all-sector reading fell to -23.4 in January from -23 in December. All sectors deteriorated with the exception of services that improved to -17.0 in January from -19.7 in December and wholesaling where expectations were flat at -34.8 in both January and December.

  • The S&P composite PMIs in January improved across the board, with the exception of India and the United States. In the U.S., the PMI headline dropped back sharply on sharp weakness in the services sector in the month in the face of what had been resiliency and strength.

    From roughly February to July of 2024, the persistence of declines by sector especially in manufacturing diminished. However, now things have shifted, and we are again in a period when there seems to be more deterioration. The prevalence of manufacturing AND service sector deterioration together has reappeared.

    The Russian invasion was a real catalyst of change for the EU, Germany, France, the United Kingdom, Japan, and the United States. Before Ukraine, the recovery from COVID was under way and both services and manufacturing sectors were running policies that left each sector with 50% or higher ranking in 60% to 100% of countries. After Russia’s aggressive action, both sectors were crushed across all these countries; the service sector rebounded first and from March 2024 to date services stood at a ranking above 50% or more in 60% to 100% of the countries. But in the post-invasion environment, the manufacturing sectors showed only about 20% of reporters above a 50% queue standing for manufacturing. Manufacturing continues to be hard hit and well short of normalcy.

    Currently we are in another round of weakness looking at a broader group of early reporters that adds India and Australia into the mix. Still, six-month changes show weakness in at least two of three months or three of five months for manufacturing and service sectors. Together they are falling over the same six-months. The ‘best performance’ on this metric apart from the U.S. is Australia where manufacturing has improved on balance over six months for two months running but only after three months of deterioration on that basis.

    U.S. performance is an outlier in several ways. The US service sector fell sharply in January, depressing services as well as the composite metric. But over six-months both US services and manufacturing have failed to worsen together for 16-months in a row.

    The U.S. has been an anomaly in terms of international performance characteristics. U.S. manufacturing is weakening on balance over six months in six of the last seven months. But the service sector has risen on balance (over the previous six months) in 12 of the last 13 months.

    The new sharp weakness in U.S. services (month-to-month) is an issue of it has any staying power.

    The four-year queue standing of the manufacturing across eight countries and three sector readings (for each: two sectors plus a composite) shows only five of 24 of these rankings with standings above the 50% mark (above their respective medians) over the past four years. These readings are manufacturing in India (79.6%), services in Germany (63.3%) and services in the EMU (barely…. at 51.0%), and a 59.2 percentile standing for Japan’s service sector (the same for its composite).

  • United Kingdom
    | Jan 23 2025

    U.K. Order Trends Are Still Eroding

    EU order trends ‘improved’ slightly in January as the net diffusion reading rose from -40 to -34. Still, that improvement leaves orders below their 3-month, 6-month, or 12-month averages. The queue standard of January orders is in the lower 14th percentile of its historic queue of data. Obviously, it remains a historically weak reading. The order series is volatile as the chart shows. But it is still in a clear downtrend even with the uptick this month.

    Export orders have approximately the same profile as for orders overall. But export orders weaken slightly in January compared to December. Export orders overall have a slightly weaker queue standing than total orders at a 13.4 percentile level.

    The diffusion readings for stocks of finished goods weakened in January but even with its weaker January assessment, stocks have a firm-to-strong 72.5 percentile standing.

    Looking ahead, the outlook for output volume over the next three months improved sharply from its stunning weak reading of -31 in December. However, the rise to -19 in January represents only a 4.8 percentile standing.

    Unfortunately, average output prices for three months ahead has reading of +27 in January, up from +23 in December and +11 in November; the backtracking in prices expected, has brought the expectation level for the current reading to a high, 90-percentile standing. These rising inflation expectations are going to be a real problem for the Bank of England.

    IP data lag the CBI survey responses. The manufacturing IP growth rate, year-on-year, has a 17.4 percentile standing as of its most recent observation in November 2024. That is also very weak. The CBI results are not giving a different message from the industrial production data, but they are timelier.

    The ramp up in inflation expectation is not good new with CPI-H inflation at 3.5% year-over-year and with the core pace at 4.2%. Core inflation, sequentially, is looking stable around the 4.2% pace; for the headline, the pace has accelerated from 3.5% over 12 months to a pace of 5.4% over three months. These results, coupled with the rise in CBI expectations, are not good news for the U.K. or for the BOE.

  • New Zealand’s CPI shows an acceleration in the fourth quarter of 2024 compared to the third quarter. The year-over-year increase is at a relatively modest 2.2%; however, the New Zealand core that excludes food and household energy as well as vehicle fuels is running at 3.1% over four quarters. The inflation progression for the core takes inflation down to 2.5% over two quarters then back up to a 2.9% annual rate over one quarter. The graph shows that the decline in the year-over-year core and headline inflation rates have stopped in this most recent quarter; that raises the question about where inflation goes next.

    There is nothing final about the pause that we see in the drop in inflation. It might be a pause that then continues its downward move, or it might not. However, as you can see from the chart, taking away the big inflation hump that we had during COVID and extrapolating a trend line from before COVID inflation puts inflation on an accelerating path. In fact, inflation, whether measured by the headline or the core, shows both above those previous trends even if we set aside the bulge of inflation during COVID.

    However, inflation news is resplendent for its ability to give us mixed signals! The more that we look at it, the more it stares back in confusion. If we look at the CPI categories, we see inflation acceleration is not common: over four quarters it's occurring in only 8% of the categories; over two-quarters it's occurring in 25% of the categories; over one quarter it's occurring in only 42% of the categories. Comparing inflation month-to-month, the accelerations are below 50% for the fourth quarter, the third quarter, and the second quarter. Second-quarter inflation breadth was especially narrow even though the headline increase was slightly more in Q2 than it was in Q3. Such is inflation.

  • Assessments and expectations This ZEW survey for January shows mixed results. The economic situations in the euro area, Germany, and the United States, as currently perceived, improved month-to-month while expectations in the U.S. were essentially unchanged and economic expectations for Germany deteriorated. The U.S. had the largest increase in the assessment of the current economic situation. The U.S. diffusion reading rose by 9.1 points, the German situation improved by 2.7, points and in the euro area it improved by 1.2 points.

    Inflation expectations Inflation expectations rose in all three areas with the euro area seeing expectations rise by 9.1 points, Germany is seeing an increase of 9.7 points, and the U.S. experiencing an increase of 11.9 points. Given that, economic reports have been somewhat uneven, as you can see the assessment of the current situation has nonetheless improved. Along with that, inflation expectations are beginning to rise more or less across the board. Inflation is generally already above levels that central banks are targeting.

    Interest rates- short-term expectations Short-term rate expectations rose in the euro area by 12.5 diffusion points and by a whopping 32.6 diffusion points in the United States. With the election of Trump and expectations that there will be tariffs imposed, and tax cuts extended, and pro-growth policies implemented, there is a decided turn to the expectation for higher inflation and for that to create knock on effects for higher short-term interest rates. At the last policy meeting, the Federal Reserve cut its policy rate; the Federal Reserve is still looking for rate cuts sometime later in the year even though it's not looking to get back down to its inflation target this year, creating a somewhat strange perspective on Fed policy. Policy continues its inflation overshoot; yet, it continues to cut interest rates. I suspect we're on the cusp of seeing that policy change, but it has not changed yet. Here we see the ZEW experts seem to be on board for that policy undergoing some substantial changes in the months ahead.

    Long-term rate expectations Long-term rate expectations declined in Germany and in the U.S. and despite the outlook for somewhat higher inflation the outlook for higher short-term interest rates may be enough to mollify expectations on longer term rates and also may be a vote of confidence that central banks will do the right thing when inflation rises by raising short-term rates enough. This survey seems to conform the expectation to contain more distant inflation pressures and allow long-term rates to hold in.

    Stock markets That view would be consistent with the stock market assessments that are lower in all three areas. In the euro area, the stock market assessment falls by 5.5 diffusion points; in Germany, it falls by 12.7 diffusion points; in the U.S., it falls by 1.8 diffusion points. That means that the ZEW financial experts are looking for stock market cap performance to back off despite better current economic conditions lowered expectations for Germany but not for the U.S. and in the midst of this expectation for higher inflation and substantially higher short-term interest rates as well. It's an interesting changing view from the ZEW experts and it paints a picture of the future that seems to be increasingly likely.

    Queue standings U.S. queue standings- The table also includes the queue standings for the various measures in the top part of the table. There we see only the U.S. has queue standings for some measures that are above 50% placing them above their longer-term medians (above 50% standings). Those are for the economic situation, for economic expectations and for stock market expectations. U.S. inflation expectations, however, are getting higher at 43.8%, closing in on their historic median, while short-term rate expectations are still relatively low at 13.2% and the level of long-term expectations in the U.S. is at 17.3% also relatively low.

    German queue standings- Germany has an economic situation at its the 4.9 percentile standing - extremely weak. Expectations are better with the 35.6 percentile standing with inflation at the 22.7 percentile standing. The euro area short-term rate expectations (EC) are at 5.8% and the German long-term rate expectation is at 8.2%; both of those are low. The expectation for the German stock market is extremely poor with the 1.9 percentile standing.

    The euro area queue standings- Compared to Germany, the euro area has a 24.9 percentile standing for the current situation. Inflation expectations are at a 20.6 percentile standing, with short-term rate expectations at a 5.8 percentile standing and stock market expectations in the eurozone around 8% still quite low.

  • United Kingdom
    | Jan 17 2025

    U.K. Retail Sales Volumes Slide

    U.K. sales volume for retail sales has been slipping roughly since mid-2024. The 3-month volume index is falling at a 4.4% annual rate over three months. Sales are up at a scant 0.2% annual rate over six months and by 3.5% year-over-year. Passenger car registrations show weakness falling at a 7.6% annual rate over three months, gaining at a 4.6% pave over six months, and then showing contraction at a minor -0.1% rate over 12 months.

    Volume Trends Apart from the sequential data, the monthly volume results show a decline in December, a gain in November and a drop in October. The monthly nominal data show small nominal gain in November and December against a sharper nominal decline in October.

    U.K. nominal sales QTD relative nominal decline in the fourth quarter with retail sales volumes also show decline dropping at a 2.9% annual rate overall. Passenger car registrations are falling at a 12.4% annual rate in the fourth quarter.

    Surveys and Confidence U.K. surveys on retailing for the ‘time of year’ and the ‘volume of orders’ from the Confederation of British Industry (CBI) show sputtering monthly results. The CBI reading for time of year (TOY) and volume of orders (VoO) both show net decline of three months. VoO also falls over six months whereas TOY sales are higher over six months. Both TOY and VoO sales are higher over 12 months. TOY sales are up by 2-index points while VoO sales are up by 28 of their index points. While the year-on-year survey results show short-term agreement, their year-on-year signals seem different. But their long-term ranking results alone again show similarity at the TOY sales log a 21.8 percentile standing vs. VoO that is even weaker at a14-percentile mark. It is an even weaker full-sample standing despite the better 12-month gain. We often see this sort of thing in data comparisons. But if surveys are well-constructed, they usually track but there often are still disparities. That is true here as well and we can nit-pick the details but the overarching message here is that conditions are weak. Consumer confidence from GfK has been volatile over the span but when we rank the confidence index, it stands at 40.5 percentile level, which is stronger than for the surveys but still below its median and barely over half the standing of real retail sales growth.

    Rankings/Standings The consumer confidence standing is interesting at 40.5% but it is not ‘close’ to the volume ranking which is at its 77-percentile. The confidence ranking is still slightly below its median. The retail sales ranking is applied to real sales and their 12-month growth rate. The ranking of sales volume is much higher than any ranking registered by CBI surveys or by consumer confidence. Passenger car registrations are weak, too, at a 47.2 percentile standing. In contrast, nominal retail sales have a 60.6 percentile standing. Part of that is the boost they get from the 80.9 percentile standing from the CPI-H, from inflation.

  • Industrial output in the European Monetary Union continued to struggle. In November, it has advanced (for the headline series excluding construction) for the second month in row. However, a sharp drop in September leaves the three-month change in output falling at a 4.8% annual rate. Output still grows by 0.2% at an annual rate over six months but falls by 1.9% year-over-year. The output path is not draconianly weak, it is not even clearly weakening further, it is simply still challenged, fighting what appears to be still-stiff headwinds.

    Manufacturing sector trends- Manufacturing output results are nearly the same as for the headline. Manufacturing sectors show progressive weakening from 12-months, to 6-months, to 3-months for consumer goods output. Both consumer durables and nondurable goods output show sporadic weakens but it is only when they are combined that consumer goods output as a total makes the progressive nature of weakening apparent. Intermediate goods output declines on all horizons from 12-months to 6-months to 3-months, but it is not clearly trending. Capital goods output drops over 12 months and falls even more sharply over three months but manages to make a gain over six months preventing a clear statement about the trend being made.

    EMU PMI for MFG- The manufacturing PMI for the EMU is below 50 for each of the last two months and over three months, six months, and 12 months as well.

    QTD: Quarter-to-date- Quarter to date IP tracking shows declines in all sectors except capital goods output. Tracking output developments since COVID arrived from January 2020-to-date, output is higher only for overall consumer goods and that is driven only by the component consumer nondurable goods output. However, capital goods output is nearly unchanged on that horizon; the current level of capital goods output is lower than its January 2020 level by only 0.5%.

    Growth rankings- The ranking of year-on-year growth rates for November compared to all year-on-year growth rates since early-2007 shows no sector ranking higher than 38%. All rankings are below their median rates of growth over this period. The growth ranking for overall IP and for manufacturing are near their 25th percentiles marking them essentially lower quartile growth results.

    Country data The country data for 13 EMU members show four declines in November month-to-month following five with month-to-month declines in October and seven in September. The breadth of weakness on this measure has been diminishing. The country of declining output over 12 months, six months, and three months has been progressively falling as well -another good sign. And the median annualized growth rate has been rising over this span. However, quarter-to-date as of November, there are still seven countries showing output declines in progress with one at unchanged. Output is rising QTD in only five of thirteen EMU nations. However, in terms of growth rankings, there is relatively stronger growth only for the smallest countries in the EMU.

    Summing up Growth rankings are above the 50% median mark only for Finland, Greece, Belgium, and Malta. The big four economies Germany, France, Italy, and Spain, each have growth rankings below their respective historic medians with an average ranking of 26.5% - again near the lower quartile border. The EMU area is performing poorly with growth sputtering and weak growth still the order of business across sectors as well as across member nations.

  • The plot of the economy watchers readings since mid-2024 paints a pretty clear picture of the performance of the economy according to this metric. The chart shows the summary. The future conditions index, the current conditions index, and the reading for current conditions employment, have all been below diffusion values of 50 on a fairly steady basis. In addition, there has been little tendency for trend to take hold; there appears to be some modest up trending going on from early-2024 to later in the year. However, more recently we see some backfilling in terms of that progress. All told it's hard to make too much out of these readings other than to note that diffusion values have been slightly below 50, indicating slight deterioration in current conditions, in the employment market, and for expected future conditions. The results are not draconian. It's really just been a period of slight underperformance by the economy and for expectations for the future and in terms of the job market.

    December Current Index In December, among the nine component readings for the current index, four of them produced diffusion values above 50, indicating some net expansion. Corporate nonmanufacturers registered 50.5, the household sector generated a rating of 50.2, retailing came in at 50.4, while the services sector produced the highest reading at 51.1. All of these are readings very close to 50 and are not showing much in the way of growth. But being above 50, they are signaling some small net expansion. The contracting side of the ledger in December shows eating and drinking places with the diffusion value of 46.9, housing at 46.5, corporate manufacturers at 47.2, the overall corporate reading at 49.1, and the employment reading at 49.7. The current reading is an echo of the performance of the headlines plotted in the chart at the top, indicating a close clustering around the value of 50. There are a few sector readings with diffusion values slightly above 50 and a few with readings below 50. However, over 12 months we have net declines for all of the readings except for housing and for retailing.

    Diffusion ratings pertain to month-to-month activity comparisons while the queue standings describe the December diffusion index ranked among its historic data on a longer timeline back to 2002. The ranking data put a slightly different spin on events because the current index, which is at 49.9, showing the barest decline in terms of the diffusion index, also has a queue standing at 69.6% which tells us that over this span the index has been stronger only about 30% of the time. A modest contraction is actually significantly stronger reading than Japan has been used to seeing over this 20-plus year period. Looking at the rankings across the components, we find only two have a percentile standing below their 50%-mark, employment at 29.2% along with corporate manufacturers at 47.8%.

    December Future Index The future index has a diffusion reading of 48.8; that shows a weakening compared to November's reading at 49.4. In December only two components have readings above the 50th percentile, services at 52.8 and nonmanufacturing corporations at 50.1; the latter is as bare bones a reading above 50 as possible. The remaining readings are below 50 indicating net contractions. The lowest being housing at 44.5, with three readings in the 47-diffusion range for corporate manufacturers, for eating and drinking establishments, and for retailing. As we saw with the current index, the 12-month change in the future index also shows a drop in the headline of 1.6 points with drops logged across most components with an increase only in nonmanufacturing corporations and an unchanged reading for retailing.

    Queue percentile standings are weaker for the future index than for the current index. Its standing is only at 51.4% for the headline with four components having readings below the 50% mark, but for the most part, significantly below the 50% mark corporate manufacturers have a percentile standing at 45.1%, eating and drinking places have a ranking at 41.5%, housing has a ranking at 40.7%, and on the outlook for employment there is a reading at 30%.

    On balance, the economy watchers index does not indicate much change in Japan's economy in December. The outlook deteriorates slightly from November, but it's still roughly unchanged in its diffusion value showing only slight deterioration; that continues to be the overall picture just as for the current index where deterioration continues to be the picture despite some reduction in the pace of slowing this month. The queue standings, however, show that the current index is posting numbers that are relatively firmer compared to what they've been over the last 20 years or so. The future index is much more modestly positioned compared to its historic readings.

  • Global| Jan 13 2025

    OECD LEIs Creep Ahead

    The OECD seven-country LEI rose in December and is gaining at an annual rate of 1.1% over three months, up marginally from a pace of 0.9% over six months and doubling its growth rate over 12 months. Still, all of these are modest numbers. Japan’s LEI was flat in December and shows LEI declines over three months, six months and 12-months. The U.S. shows a gain of 0.2% in December with a 1.8% annual rate rise over three months, a 1.3% pace over six months and the same 0.5% gain year-over-year as for the OECD7. The index levels show an OECD7 queue standing in its 66.8 percentile, the U.S. a tad stronger at its 68.2 percentile and Japan much weaker and below tis median pace at a 36-percentile standing.

    The OECD likes to judge these indicators over six months. So, I construct six-month averages, and we see the same 0.4% U.S. and OECD7 gains on this average for its change month-to-month in December and November for both. Japan turns up flat in December on this metric and shows declines over three months and 12 months. In contrast, China shows declines on this averaged gauge in December and in November but shows growing momentum from 12-months to 6-months to 3-months. The 6-month growth rate show strength in the rankings for the U.S., China, and the OECD7. But Japan also sputters in terms of growth rates on 6-month changes with a 36-percentile standing.

    The amplitude adjusted metrics show only France persistently with a reading below 100 - but Japan walks the line. The ratio to six months ago shows only Japan and Germany weakening. The queue standings show only Japan and Germany, with readings below their respective medians (values below 50%).

    The OECD data are not very reassuring. While conditions show basic advancing trends, they are advancing slowly with little evidence of strength. The U.S. has the strongest standing on OECD index levels and growth rates, and they are largely in the 68th and 81st percentile ranges. Germany and Japan sport 36-percentile standings for their LEI index levels on amplitude adjusted readings. These are very weak reading for two important economies.

  • French retail sales volumes fell by 0.1% in November after falling by 0.1% in October; July was the last month to produce a month-to-month increase in retail sales volumes. In July 2024, those volumes increased by 0.2%. Sales volume trends in France continue to be weak.

    Year-over-year growth rates for all products show a 0.1% decline in volume which has a 51.7 percentile rank on data back to mid-2007. Among the various categories, food purchases have a sub-50-percentile ranking as do electronics and the sales of new autos. These sub-50-percentile rankings indicate that the current year-over-year growth rates are below the median growth rate for year-over-year sales since mid-2007. It's unusual to see food rank so low; however, automobiles and electronics certainly count as discretionary purchases and if the economy is under pressure we would expect to see some weakness in electronics and in auto sales; that appears to be the case in France.

    Other categories show sales rankings that range from firm-to-strong. Strong sales emerged in footwear, a small-ticket item, where an 84.2 percentile standing derives from a year-over-year growth rate of 7.2%. Household appliances, a heftier household expenditure, show a 5.1% increase in sales volumes for an 81.8 percentile standing, also a strong result. Furniture sales, where the growth rate is a milder 1.3%, still scores a 71.3 percentile standing for this period. Textile sales are up by 1.5% year-on-year, which scores an above-median 67-percentile standing. For all industrial goods, a 0.5% increase in spending marks a 56.5 percentile standing overall, a small gain above its historic median rate.

  • German industrial output advanced in November but is currently riding a string of 18 straight months of year-over-year declines for output excluding construction (the headline series).

    The increase in monthly output marks ‘one in a row,’ two increases in the last four months, and three increases in the last six months. There have been six month-to-month increases in the last 12 months. Still, the year-on-year change is -2.8%, an improvement from drops of five-percent or so in September and October but August of 2024 showed a year-on-year drop of only 2.7%; yet, that was not a signal of coming improvement.

    Apart from output itself, order momentum is not improving. Real manufacturing orders fell by 5.4% in November after falling by 1.5% in October, but that series has risen a strong 7.2% month-to-month in September. Real orders show a progression toward less decline over three months, six months, and 12 months. Still, the quarter-to-date annualized change in real orders is falling at a 7.1% annual rate.

    On balance, it is hard to say that there is any light at the end of the tunnel for German output and its prospects based on IP trends or on real-order trends.

    Sales trends are not much better although real sales rose by 1.4% in November; the decline over three months, six months and 12 months and have ‘generally’ been weakening.

    Surveys show weakened trends from 12-months to 3-months.

    In addition, the queue standings of all the IP categories, orders, real sales and the relevant German surveys have low standings- in all cases below 50%- putting all of them below their historic medians. The surveys are especially weak with standings below the 15th percentile in all cases. Among manufacturing output, real orders, and real sales the strongest standing is orders with a percentile of 33%. For the IP headline series itself, the standing is at its 18.4 percentile; consumer goods is strongest at a standing of 31.2%, with capital goods at 22% and intermediate goods at 17.4%. The readings for manufacturing in Germany are weak no matter how you view them.

    The table also surveys early IP data for Portugal and Norway. These queue standings apply to year-on-year growth rates, and both are above the German standing of 18.4%, with Portugal at 39% and Norway at a 52.7 percentile standing above its historic median.

    The far-right column also assesses the current IP level relative to where it stood on January 2020. The IP headline index is 12 IP index points lower. Construction is 13 index points lower; manufacturing as a total is 10.8 points lower, similar to the drops for real manufacturing orders and for real manufacturing sales. The surveys are on very different scales. The ZEW current index is 81.9 points lower, with the IFO manufacturing index lower by 8.8 points. Despite the difference in the construction of these indexes, these drops both have percentile standings in the 4% to 5% range. Skipping down the table, we quickly see Portugal has fallen by 9.9 IP points compared to its January 2020 level, while Norway has risen by 1.1 point and has an above-median standing, as a result.

    These data are disappointing. Quite apart from the near-term momentum – which is weak- the big picture is severely impacted. And it is not getting better despite a small increase in the November output.