Asia| Apr 15 2025
Economic Letter from Asia: Game of Chicken
This week, we maintain our focus on global trade, particularly following the decision by the US administration to reverse its “reciprocal” tariffs coupled with its significant escalation of trade tensions with China. Markets have been understandably volatile over the past week (chart 1), with President Trump’s decision to hold “reciprocal” tariffs at 10% and pause a further increase offering a temporary reprieve. Still, China’s significantly increased exposure to US tariffs (chart 2) remains a key concern for investors, even as weekend announcements of exemptions for certain electronics and semiconductor products provide some relief—albeit a partial one. Nonetheless, the reality is that the US and China remain deeply interdependent when it comes to trade. Neither can be independent of the other without substantial economic costs. The latest escalation is reminiscent of a game of chicken between the two global powers—except this is not a game. It is real life, with real consequences for businesses, consumers, and economies around the world. That said, the degree of mutual reliance is not equal. The US is arguably more dependent on Chinese imports, particularly in goods trade, despite some signs of decoupling in recent years (chart 3). This becomes especially clear when looking at specific product categories: many of the US economy’s low export-to-import ratio goods (chart 4) are primarily sourced from China (chart 5). Without readily available and complete alternatives, the latest round of tariffs may soon be felt in the form of rising consumer prices. Looking beyond goods, however, the US continues to maintain a strong services trade surplus globally, including with much of Asia (chart 6). This may serve as an alternative channel for the US to manage its trade balance going forward.
Latest US-China trade developments Just days after US President Trump unveiled his sweeping “reciprocal” tariffs on April 2, he announced a 90-day pause for all economies except China, opting instead to maintain a 10% additional tariff on others in the interim. What followed was a flurry of tit-for-tat measures between the US and China. Within days, the US raised its additional economy-wide trade tariffs on China from 20% in March to a staggering 145%. In response, China’s retaliatory measures saw its additional tariffs on US goods jump from 0% (excluding product-specific tariffs) to 125%. Amid the escalation, China’s Customs Tariff Commission declared it would no longer respond to additional US tariff hikes. It explained that American exports to China are no longer economically viable under the latest tariffs, underscoring just how severely tensions have deteriorated. Unsurprisingly, the markets have been on a nerve-racking roller coaster over the past few weeks. Initial reactions to President Trump’s “reciprocal” tariffs were clearly negative, although a brief sense of relief emerged after he narrowed the scope of his most recent trade escalations to target China alone.
Chart 1: Timeline of major US-China tariff actions

Over the weekend, there was a development that may have offered some relief to investors focused on China. The US Customs and Border Protection agency clarified that certain electronics and semiconductor products will be exempt from the new “reciprocal” tariffs on China. This clarification comes amid understandable concerns over the recent sharp and rapid escalation in US-China trade tensions. Specifically, these exemptions apply to the additional 125% tariffs announced following Trump’s “Liberation Day” speech, not to the previous 20% tariffs that were already in place. While the previous tariffs remain unaffected, the exemptions mark a moderate rollback in China’s exposure to the newly imposed duties. Illustrative approximations of China’s tariff exposure are shown in chart 2. These are based on the effective dates of the tariffs and indicate that, even with the exemptions (highlighted in red), China still faces a sharp spike in tariff exposure following last week’s escalation.
Chart 2: China’s exposure to US tariffs

Relative exposures to the US-China tariffs As US-China tensions escalate, chart 3 underscores the stark imbalance in mutual goods reliance. Although the US initiated the latest round of trade measures, it remains far more dependent on Chinese goods imports than China is on US goods imports. But this presents a classic chicken-and-egg dilemma. Some argue that high tariffs on China are self-defeating and will only hurt the US. Others believe the US' heavy reliance on China justifies decoupling due to over-concentration risks. President Trump takes the latter view, citing concerns that China has long taken advantage of the US. That, however, is a flawed premise. The US' chronic trade imbalance is not simply the result of unfair trade practices. Rather, it stems from deeper structural features of the US economy. Nonetheless, some level of decoupling had already begun following President Trump’s initial trade war with China in 2018, but the US still exhibits a strong reliance on Chinese goods. In contrast, China’s dependence on US imports has remained relatively low over the past two decades. This suggests that, even as the US imposes steeper tariffs on Chinese products, China may endure less relative economic strain due to its lower reliance on US trade.
Chart 3: US-China import shares

US goods-specific reliance Next, we take a closer look at President Trump’s rationale for imposing aggressive tariffs in an effort to “correct” perceived imbalances—one of which is the goal of “bringing back” manufacturing jobs to the US. However, chart 4 reveals that the US remains heavily reliant on several categories of goods, as indicated by low export-to-import ratios. This ratio serves as a proxy—or rough indicator—of where the US depends significantly on external suppliers. A low ratio suggests strong import demand for a product the US exports relatively little of, either due to limited domestic production capacity or the economic infeasibility of producing it locally. It is worth noting that some raw or intermediate goods imported for use in US-based finished goods production are also reflected here. Nevertheless, the chart highlights many product categories—such as apparel and accessories, textiles, footwear, and similar items—that are typically considered “low-tech” and offer little value added beyond their raw inputs. These goods tend to benefit more from cost savings driven by large-scale production abroad. This raises a critical question: why would the US want to reshore such manufacturing, when it could instead focus on exporting higher-value-added goods to the world?
Chart 4: US export-import ratios

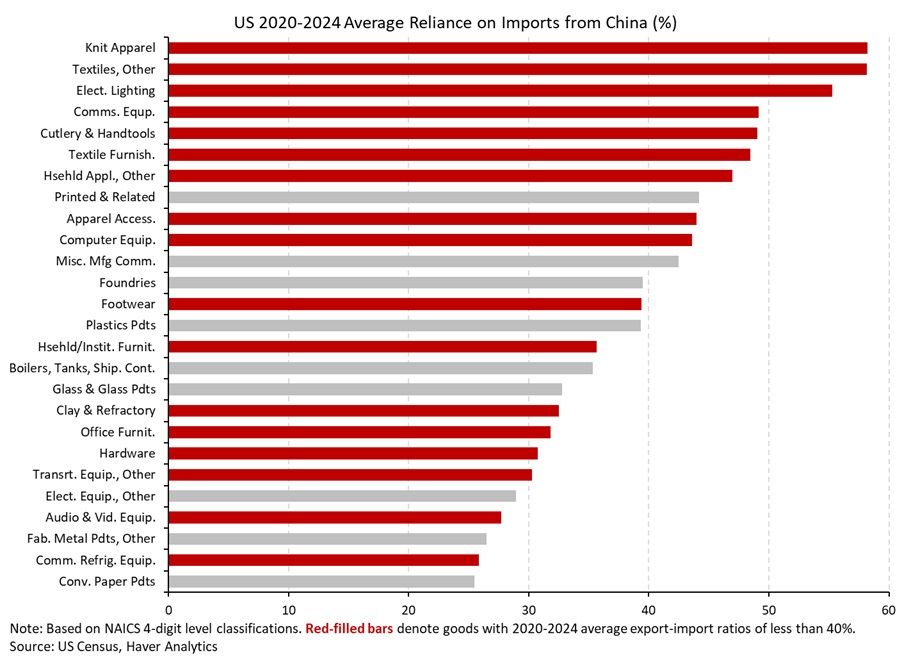
Digging even deeper, chart 5 shows that many of the goods the US is heavily import-reliant on—shaded in red—are largely sourced from China. This is evident from China’s disproportionately high share in US import sources for these products. As a result, steep US tariffs on Chinese goods would have an immediate effect. They would sharply increase the prices of many items the US relies on external suppliers for. A large share of these goods come directly from China. Without sufficient alternative suppliers to meet near-term US import demand—aside from drawing down existing inventories—these tariffs are likely to trigger a significant price shock for American consumers. Everyday items once considered affordable and mundane, such as shoes, clothing, and even furniture, could see notable price hikes. In short, the cost of trade tensions will quickly be felt in the purchasing power of average Americans.
Chart 5: US reliance on imports from China
Beyond goods trade Moving beyond goods, chart 6 highlights a major aspect of the US’ trade balance that has been largely overlooked in Trump’s approach—one that has focused almost exclusively on goods trade. While it's true that the US runs a significant goods trade deficit, the opposite is true for services. The US maintains a strong services trade surplus—not just with Asia, but with much of the world—and this surplus has been steadily recovering to pre-pandemic levels. Given this, one alternative path for narrowing the overall trade gap could be to expand services exports, rather than aggressively trying to reshore manufacturing. The latter approach risks being inefficient in terms of resource allocation, and the methods used to pursue it are already undermining US global leadership. Additionally, the US’ sporadic and seemingly arbitrary imposition of trade penalties, coupled with inconsistent messaging, may damage international trust—an essential foundation for the success of services trade.
Chart 6: US services trade balance with the Asia Pacific


Tian Yong Woon
AuthorMore in Author Profile »Tian Yong joined Haver Analytics as an Economist in 2023. Previously, Tian Yong worked as an Economist with Deutsche Bank, covering Emerging Asian economies while also writing on thematic issues within the broader Asia region. Prior to his work with Deutsche Bank, he worked as an Economic Analyst with the International Monetary Fund, where he contributed to Article IV consultations with Singapore and Malaysia, and to the regular surveillance of financial stability issues in the Asia Pacific region.
Tian Yong holds a Master of Science in Quantitative Finance from the Singapore Management University, and a Bachelor of Science in Banking and Finance from the University of London.
More Economy in Brief
 Global| Feb 05 2026
Charts of the Week: Balanced Policy, Resilient Data and AI Narratives
by:Andrew Cates