 Global| Feb 20 2006
Cross Currents in the Italian Economy: Industrial Sales and New Orders Rising, Trade Deficit Exploding
Summary
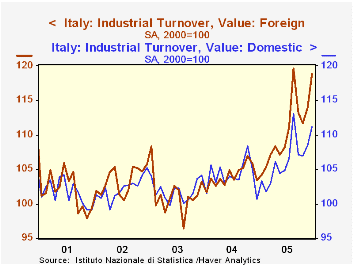
Italian industrial sales rose 2.3% in December and new orders rose 3.0%. At year end sales were 11.7% above December 2004 and new orders were up 3.3% The strong performance of industrial sales and new orders in 2005 is shown in the [...]

Italian industrial sales rose 2.3% in December and new orders rose 3.0%. At year end sales were 11.7% above December 2004 and new orders were up 3.3% The strong performance of industrial sales and new orders in 2005 is shown in the first chart.
The recovery in industrial sales has been one of the factors in the recent modest improvement in the Italian economy. After four years of decline, industrial production averaged an increase of 1.15% in 2005 and ended the year 2.0% above December 2004.
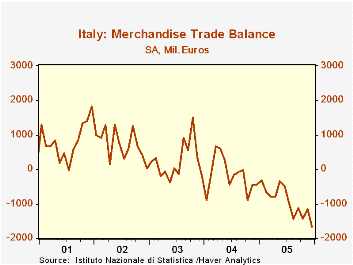
The cloud on the horizon is the merchandise trade balance. It was a negative 1,679 million euros in December, 2005, a deterioration of 530 million euros from November and one of 1,243 million euros from December, 2004. As a result of the growing monthly trade deficits, the merchandise trade deficit for all of 2005 rose to 11,169 million euros from a deficit of 1,946 million in 2004, as shown in the second chart. The problem that arises with the deficit is that one of the means to remedy a trade deficit, currency depreciation, is not available to the individual members of the Euro Zone.
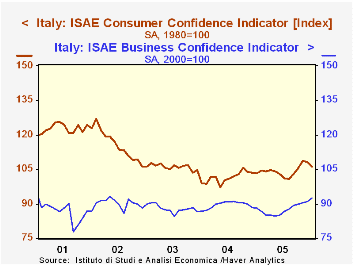
In spite of the cloud, business confidence has improved, albeit slowly, since early 2005 and in January, 2006, was at its highest level since May, 2002 Consumer confidence weakened in the last two months, but in January was still at the highest level since September, 2003.Business and consumer confidence measures are shown in the third chart.

| Italy | Dec 05 | Nov 05 | Dec 04 | M/M % | Y/Y % | 2005 | 2004 | 2003 |
|---|---|---|---|---|---|---|---|---|
| Industrial Sales (2000=100) | 113.2 | 110.0 | 101.4 | 3.00 | 11.74 | 107.6 | 104.1 | 101.8 |
| Industrial New Orders (2000=1000 | 107.2 | 104.8 | 103.8 | 2.29 | 3.28 | 102.8 | 98.9 | 95.4 |
| Industrial Production (200=1990 | 96.7 | 95.6 | 94.8 | 1.15 | 2.00 | 95.7 | 96.7 | 97.3 |
| Deficit on Merchandise Trade (Mil. Euros) | -1,679 | -1,141 | -436 | -538 | -1,243 | -11,169 | -1,946 | 2,974 |
| Jan 06 | Dec 05 | Jan 05 | M/M % | Y/Y % | 2005 | 2004 | 2003 | |
| Business Confidence (2000=100) | 92.7 | 91.2 | 88.2 | 1.65 | 5.10 | 87.5 | 89.5 | 88.0 |
| Consumer Confidence (1980=100) | 106.4 | 108.2 | 103.2 | -1.66 | 3.10 | 104.2 | 101.4 | 106.1 |
| Final goods | ||||||||
More Economy in Brief
 Global| Feb 05 2026
Charts of the Week: Balanced Policy, Resilient Data and AI Narratives
by:Andrew Cates


