 Global| Mar 08 2010
Economy Watchers In Japan Find Improvement In Current And Future Business Conditions
Summary
Economy Watchers in Japan found current business conditions improving in February for the third successive month. The diffusion index rose 8.5% from 38.8% in January to 42.1% in February. The index was more than twice--a 117.0% [...]

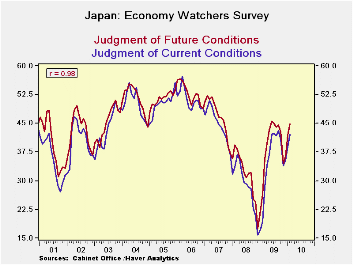
Economy Watchers in Japan found current business conditions improving in February for the third successive month. The diffusion index rose 8.5% from 38.8% in January to 42.1% in February. The index was more than twice--a 117.0% increase over--that of a year ago. The index for the total has almost recovered from the big drop last November as can be seen in the attached chart.
Current conditions in all the components improved in February as can be seen in the table below and, like the total, were substantially above February 2009. Eating and Drinking establishments and retail sales showed growth above the average in February. Substantial improvements were also found in the corporate sector and in employment The Current conditions index for Non manufacturing corporations increased 10.5% between January and February and was 164.4% above the February 2009 index. Comparable figures for manufacturing corporations were 6.9% and 161.6%. The diffusion index for employment increased 8.4% in February from January and was over 300% above February, 2009.
The Economy Watchers' overall appraisal of future conditions is generally more optimistic or less pessimistic that the appraisals of current conditions but the direction of changes in the future conditions index are much like those in the current conditions index. Apparently, the Economy Watchers estimates of future conditions are highly influenced by their appraisal of current conditions. The correlation between the two series is .98, as shown in the attached chart. As for the component series, they, too, show high correlations between current and future appraisals. Correlations between current and future conditions for the component series are shown in the table below. The correlations are high, the lowest being .82 for the Eating and Drinking establishments.
| ECONOMY WATCHERS SURVEY | Feb 10 | Jan 10 | Feb 09 | M/M % Chg | Y/Y% Chg | 2009 | 2008 | 2007 |
|---|---|---|---|---|---|---|---|---|
| Current Conditions (Diffusion Index %) | 42.1 | 38.8 | 14.4 | 8.51 | 117.01 | 34.6 | 28.9 | 44.9 |
| Future Conditions | 44.8 | 41.9 | 26.5 | 6.92 | 69.06 | 38.3 | 31.6 | 46.9 |
| Current Conditions | Correlation | |||||||
| Total | 42.1 | 38.8 | 19.4 | 8.51 | 117.01 | .98 | ||
| Households | 40.6 | 37.4 | 21.5 | 8.56 | 88.84 | .97 | ||
| Retail Sales | 40.6 | 36.8 | 21.1 | 10.33 | 92.42 | .97 | ||
| Eating and Drinking | 36.0 | 32.7 | 17.2 | 10.09 | 109.30 | .82 | ||
| Services | 42.1 | 39.3 | 22.6 | 7.12 | 86.28 | .93 | ||
| Housing | 39.7 | 38.6 | 25.0 | 2.85 | 58.80 | .96 | ||
| Corporations | 43.8 | 40.4 | 16.7 | 8.42 | 162.28 | .96 | ||
| Manufacturing | 45.0 | 42.1 | 17.2 | 6.89 | 161.63 | .94 | ||
| Nonmanufacturing | 43.1 | 39.0 | 16.3 | 10.51 | 164.42 | .97 | ||
| Employment | 48.0 | 44.3 | 11.9 | 8.35 | 303.36 | .98 | ||
More Economy in Brief
 Global| Feb 05 2026
Charts of the Week: Balanced Policy, Resilient Data and AI Narratives
by:Andrew Cates


