 Global| Nov 15 2007
EMU ‘Core’ Inflation Trends Are Mixed…But Still Poor
Summary
The EMU region shows accelerations in overall inflation as well as in core inflation (see table below). The goods sector (a sector that includes energy) shows inflation is steadily accelerating and services show the opposite, steady [...]
The EMU region shows accelerations in overall inflation as well as in core inflation (see table below). The goods sector (a sector that includes energy) shows inflation is steadily accelerating and services show the opposite, steady price deceleration. From the stand point of inflation this offset is good news. From the stand point of growth it may not be…
The weakness in services prices is suggestive of a domestic population besieged by rising goods prices (…some of them of inelastic demand such as food and energy) robbing spending from the services component of expenditures where relatively more of the discretionary funds may be spent. We will want to watch to see if the EMU service sectors reflect a growing weakness that would confirm that such an effect is in train.
The bottom of the table includes core inflation readings across main EMU countries and all of them show that their inflation acceleration is in train or above the ECB ceiling rate of 2%... or both.
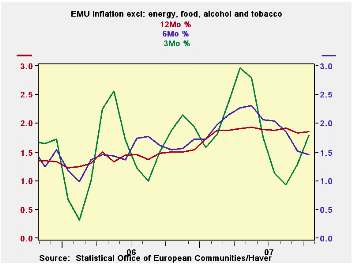
With this report a more detailed look behind the ‘seemingly benign’ core rate of inflation of 2.1% looks a lot grimmer. With the euro rising, and the ECB warning of spreading price pressures, it puts the EMU region and the ECB in a tough spot.
| Trends in HICP | |||||||
|---|---|---|---|---|---|---|---|
| % mo/mo | % saar | ||||||
| Oct-07 | Sep-07 | Aug-07 | 3-Mo | 6-Mo | 12-Mo | Yr Ago | |
| EMU-13 | 0.4% | 0.4% | 0.0% | 3.4% | 2.7% | 2.6% | 1.6% |
| Core | 0.3% | 0.2% | 0.2% | 3.0% | 2.2% | 2.1% | 1.6% |
| Goods | 0.8% | 1.0% | 0.0% | 7.6% | 2.2% | 2.6% | 1.3% |
| Services | 0.0% | -0.5% | 0.2% | -1.5% | 1.8% | 2.5% | 2.1% |
| HICP | |||||||
| Germany | 0.2% | 0.7% | -0.1% | 3.1% | 2.7% | 2.7% | 1.1% |
| France | 0.2% | 0.1% | 0.3% | 2.6% | 2.3% | 2.1% | 1.2% |
| Italy | 0.7% | 0.3% | 0.2% | 4.7% | 3.3% | 2.3% | 1.9% |
| Spain | 0.7% | 0.4% | 0.0% | 4.3% | 3.7% | 3.7% | 2.6% |
| Core: xFE&A | |||||||
| Germany | 0.2% | 0.3% | 0.1% | 2.4% | 2.4% | 2.2% | 0.9% |
| France | 0.2% | 0.1% | 0.3% | 2.7% | 1.9% | 1.7% | 1.3% |
| Italy | 0.5% | 0.4% | 0.2% | 4.3% | 2.7% | 2.1% | 2.0% |
| Spain | 0.7% | 0.2% | 0.3% | 4.8% | 3.5% | 3.1% | 2.8% |

Robert Brusca
AuthorMore in Author Profile »Robert A. Brusca is Chief Economist of Fact and Opinion Economics, a consulting firm he founded in Manhattan. He has been an economist on Wall Street for over 25 years. He has visited central banking and large institutional clients in over 30 countries in his career as an economist. Mr. Brusca was a Divisional Research Chief at the Federal Reserve Bank of NY (Chief of the International Financial markets Division), a Fed Watcher at Irving Trust and Chief Economist at Nikko Securities International. He is widely quoted and appears in various media. Mr. Brusca holds an MA and Ph.D. in economics from Michigan State University and a BA in Economics from the University of Michigan. His research pursues his strong interests in non aligned policy economics as well as international economics. FAO Economics’ research targets investors to assist them in making better investment decisions in stocks, bonds and in a variety of international assets. The company does not manage money and has no conflicts in giving economic advice.
More Economy in Brief


