 Global| Oct 29 2007
France's Service Sector Holds Its Strength
Summary
Readings are mostly firm, strong. France's service sector continues to claim strong readings. While Euro area and French manufacturing measures have softened, the service sector continues to post its strongest overall reading since [...]

Readings are mostly firm, strong.
France's service sector continues to claim strong readings. While Euro area and French manufacturing measures have softened, the service sector continues to post its strongest overall reading since 2000. The outlook index shows a bit more weakness, dropping by one point in October and holding to the 87th percentile in its range. Sales held to their second strongest reading on the period and were flat on the month. Expected sales (next 3-months) slipped by one point and remained in their 82nd percentile. Price expectations slipped and were in the 30th to 40th percentiles. Employment readings showed current of ‘observed' employment in only its 40th percentile but expected employment (3-mos) was at 100%. Viva la optimism!
The service sector readings indicate that for France at least
expectations remain somewhat compartmentalized. Manufacturing
indicators have been weakening but the services survey shows no hint of
this or fear of its consequences. The same goes for the unrelenting
rise in the euro which has brought forth a good deal of negative
commentaries from French officials. There appears to have been no
spillover impact into the services sector stemming from these sorts of
concerns. Still, the upward momentum in the services index has clearly
slowed both for the climate and the outlook indicators. We may soon see
if the service sector is really this strong or if survey participants
have just been excessively optimistic.
| France INSEE Services Survey Jan 2000-date | ||||||||||
|---|---|---|---|---|---|---|---|---|---|---|
| Oct 07 |
Sep 07 |
Aug 07 |
Jul 07 |
%tile | Rank | Max | Min | Range | Mean | |
| Climate Indicator | 113 | 112 | 113 | 113 | 100.0 | 1 | 113 | 83 | 30 | 102 |
| Climate: 3-Mo MAV | 113 | 113 | 112 | 111 | 100.0 | 1 | 113 | 85 | 28 | 102 |
| Climate: 12-Mo MAV | 110 | 110 | 110 | 109 | 100.0 | 1 | 110 | 91 | 20 | 101 |
| Outlook | 7 | 8 | 8 | 8 | 87.9 | 11 | 11 | -22 | 33 | -1 |
| Sales | ||||||||||
| Observed 3-mos | 18 | 18 | 16 | 13 | 96.7 | 2 | 19 | -11 | 30 | 6 |
| Expected 3-Mos | 13 | 14 | 15 | 16 | 82.1 | 12 | 18 | -10 | 28 | 7 |
| Sales Price | ||||||||||
| Observed over 3-Mos | 0 | 2 | 1 | 0 | 33.3 | 34 | 8 | -4 | 12 | 0 |
| Expected over 3-Mos | -1 | 1 | 1 | 2 | 40.0 | 59 | 5 | -5 | 10 | 1 |
| Employment | ||||||||||
| Observed over 3-Mos | 3 | 8 | 10 | 13 | 41.2 | 50 | 23 | -11 | 34 | 5 |
| Expected over 3-Mos | 17 | 9 | 8 | 6 | 100.0 | 1 | 17 | -5 | 22 | 5 |
by Robert Brusca October 29, 2007
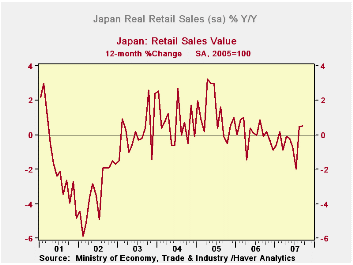
Real retail sales surged in August but they fell in September. Still, the combination leaves retail sales net better off over the past two months. The Yr/Yr chart (real retail sales) shows that the downtrend that has been in place is blunted by these recent movements. Still retail sales in the quarter are going to be lower; they are falling at a 3.2% annual rate in Q3. The main nominal measures show distinct slowing as well.
Japan continues to be caught in between as the central bank looks for recovery and anticipates rate hikes and as the government plans for tax hikes to address Japan's excessive fiscal situation. Yet the economy, after a few hopeful quarters, has failed to deliver on the promise of growth and failed to let either of these policy moves occur. Moreover, the backsliding on the inflation front is a clear reminder of how fragile this economy is. The ongoing weakness in the yen should be a constant reminder of Japan’s weakness as export growth continues to drive growth. In short, Japan’s retail sales in September are not so encouraging despite the fact that they let much of the August strength stand.
| Japan Real and Nominal Retail Sales | ||||||||
|---|---|---|---|---|---|---|---|---|
| Nominal | Sep-07 | Aug-07 | Jul-07 | 3-MO | 6-MO | 12-MO | YrAGo | QTR Q3 Saar |
| Retail Total | -0.6% | 3.6% | -2.8% | 0.8% | 1.6% | 0.5% | 0.5% | -3.0% |
| Motor Vehicles and Parts | -6.5% | 8.0% | -0.4% | 2.3% | -1.9% | 0.0% | -6.9% | 3.4% |
| Food Beverages & Tobacco | 0.9% | 1.2% | -1.0% | 4.7% | -1.4% | 0.4% | 1.8% | -2.6% |
| Clothing footwear | -0.4% | 8.7% | -8.3% | -3.1% | 0.4% | -1.1% | -1.5% | -10.9% |
| Real | ||||||||
| Retail Total | -1.5% | 3.9% | -2.5% | -0.8% | -0.2% | 0.5% | -0.1% | -3.2% |
by Louise Curley October 29, 2007
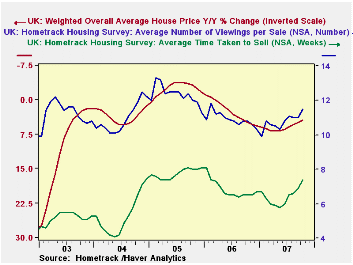
The average price of the quality adjusted house in the UK declined 0.11% in October to 176.1 thousands of British pounds, the first decline since December, 2005. Other measures of activity in the housing market revealed in the Hometrack Housing Survey also showed weakness. The ratio of the selling price to the asking price declined to 94.3 from 94.8 in September. The average time to sell a house rose to 7.4 weeks from 6.9 and the number of viewings before a sale rose to 11.5 from 11.0. These last two indicators are shown with the house price in the first chart. The house price is on an inverted scale.
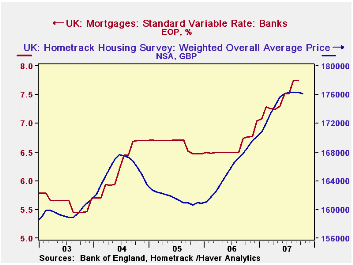
December, 2005 marked the end of a year and a half of year of almost constant year to year declines in the quarterly house prices. In spite of the price declines, which may well have resulted from rising interest rates at that time, the housing market did not collapse. Construction remained strong. Once again, there has been a period of rising interest rates that has now begun to affect the housing market. The standard average variable interest rate on mortgages is shown in the second chart together with the house price. The question now is: Will the current rise in interest rates leave the housing market as unscathed as it did in the 2004-5 period?
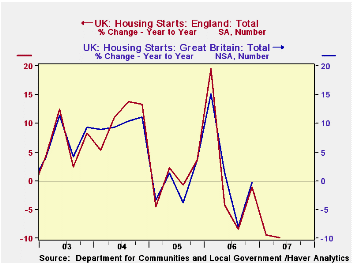
In one respect, that regarding housing starts, the effect is already apparent. There were only two year to year declines in England's quarterly housing starts in 2005, one of 4.6% in the first quarter and one of 0.74% in the third quarter. Contrast that with the current decline beginning in the second quarter of 2006 and continuing into the second quarter of 2007. Data for housing starts for all of Great Britain are available only through 2006, but data for England are available through the second quarter of 2007. Since the trend in activity in England largely determine the trend in activity for the whole United Kingdom, as the third chart attests, it is clear that there has already been a significant impact on actual housing starts.
| UK HOMETRACK HOUSING SURVEY | Oct 07 | Sep 07 | Oct 06 | M/M% Chg | Y/Y % Chg |
2006 | 2005 | 2004 |
|---|---|---|---|---|---|---|---|---|
| Weighted Average Price (1000 GBP) | 176.1 | 176.3 | 168.6 | -0.11 | 4.45 | 165.7 | 161.9 | 165.5 |
| Sale's Price as % of Asking Price | 94.3 | 94.8 | 94.9 | -0.5* | -0.6* | 94.7 | 93.3 | 95.1 |
| Average Time to Sell in weeks | 7.4 | 6.9 | 6.5 | 0.5* | 0.9* | 6.8 | 7.8 | 5.3 |
| Average Number of Viewings per Sale | 11.5 | 11.0 | 10.8 | 0.5* | 0.7* | 10.9 | 12.3 | 11.00 |
| Q2 07 | Q1 07 | Q2 06 | Q/Q Chg | Y/Y Chg | 2006 | 2005 | 2004 | |
| Housing Starts in England (000) | 39.7 | 42.8 | 47.2 | -7.18 | -9.92 | 178.5 | 177.0 | 176.6 |
| * difference |

Robert Brusca
AuthorMore in Author Profile »Robert A. Brusca is Chief Economist of Fact and Opinion Economics, a consulting firm he founded in Manhattan. He has been an economist on Wall Street for over 25 years. He has visited central banking and large institutional clients in over 30 countries in his career as an economist. Mr. Brusca was a Divisional Research Chief at the Federal Reserve Bank of NY (Chief of the International Financial markets Division), a Fed Watcher at Irving Trust and Chief Economist at Nikko Securities International. He is widely quoted and appears in various media. Mr. Brusca holds an MA and Ph.D. in economics from Michigan State University and a BA in Economics from the University of Michigan. His research pursues his strong interests in non aligned policy economics as well as international economics. FAO Economics’ research targets investors to assist them in making better investment decisions in stocks, bonds and in a variety of international assets. The company does not manage money and has no conflicts in giving economic advice.
More Economy in Brief


