 Global| Aug 30 2019
Healthy Spending Accompanies Modest U.S. Personal Income
Summary
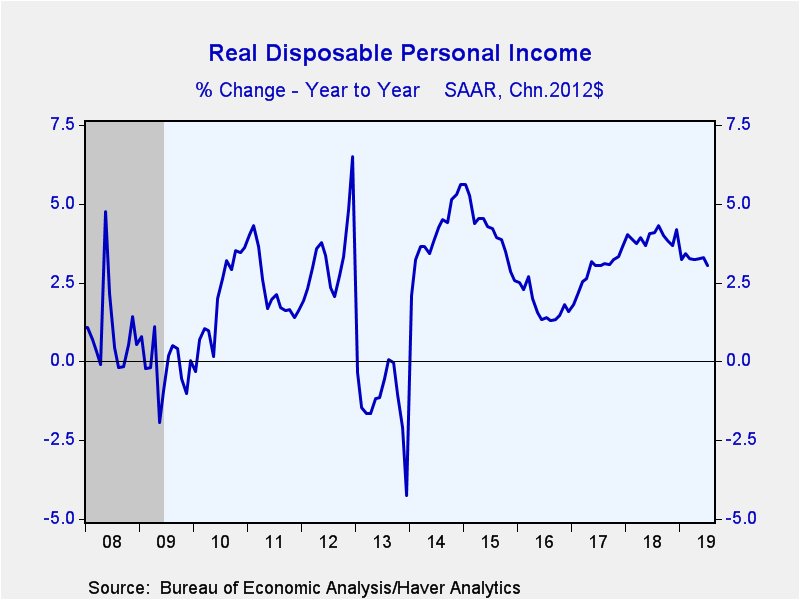
Personal income edged up 0.1% (4.6% year-on-year) in July after an upwardly-revised 0.5% gain in June (was 0.4%). The Action Economics Forecast Survey expected 0.3%. Employee compensation grew 0.2% (5.0% y/y), transfers were up a [...]
Personal income edged up 0.1% (4.6% year-on-year) in July after an upwardly-revised 0.5% gain in June (was 0.4%). The Action Economics Forecast Survey expected 0.3%. Employee compensation grew 0.2% (5.0% y/y), transfers were up a healthy 0.4% (7.1% y/y) and proprietors' income increased 0.5% (3.7% y/y). Meanwhile, receipts from assets fell 0.8% in June (+1.7% y/y). As a result of a 0.9% drop in tax payments (+5.8% y/y), disposable personal income rose 0.3% (4.5% y/y). When adjusted for inflation, disposable income ticked up 0.1% (3.0% y/y).
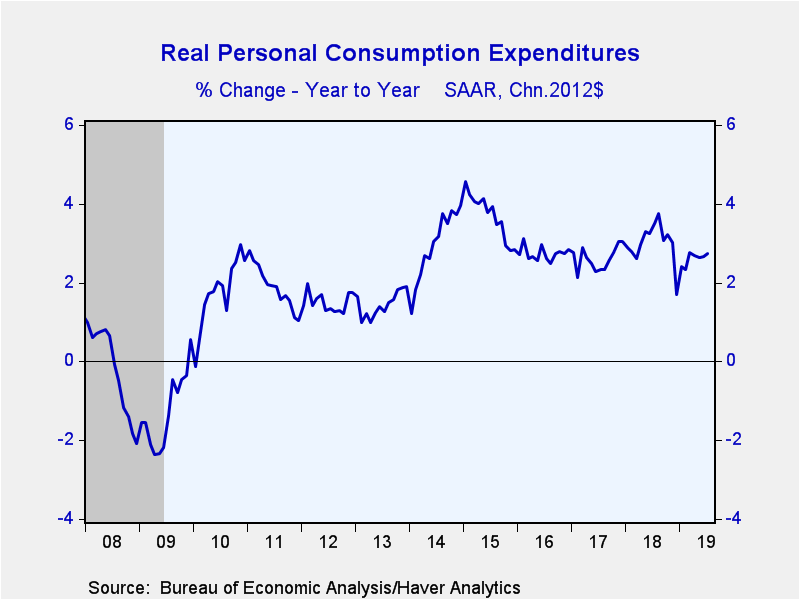
Personal consumption expenditures grew 0.6% in July, a tad better than the 0.5% anticipated by the Action Economics Forecast Survey. Inflation-adjusted consumption increased 0.4% (2.7% y/y) with goods and services spending up 0.8% (4.5% y/y) and 0.3% (2.0% y/y) respectively. Durable goods spending jumped 1.1% (5.7% y/y) despite a 0.2% decline in vehicles (+2.9% y/y) -- furniture as well as recreation goods and vehicles sales showed strong gains (1.1% and 2.4%; 2.7% and 12.2% y/y respectively).
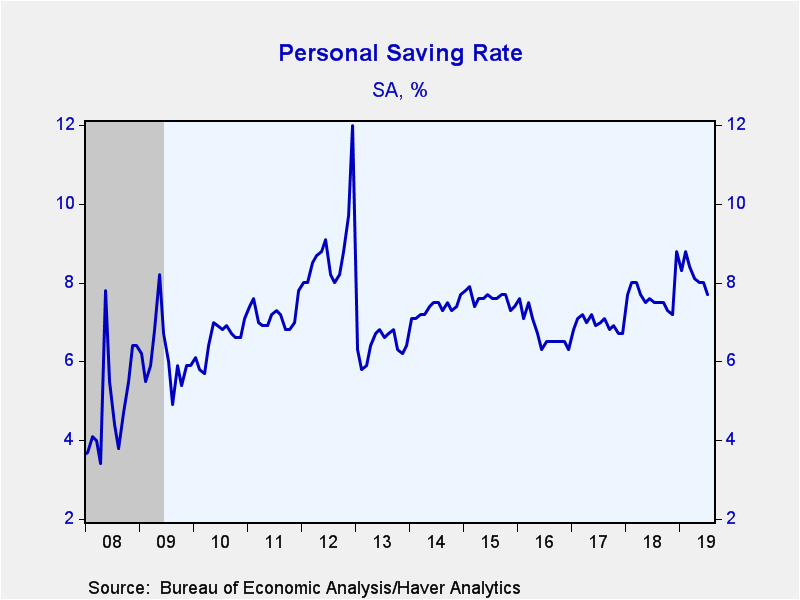
As a result of the combination of weak income growth and strong spending, the personal savings rate declined to a still healthy 7.7% in July from 8.0% in June.
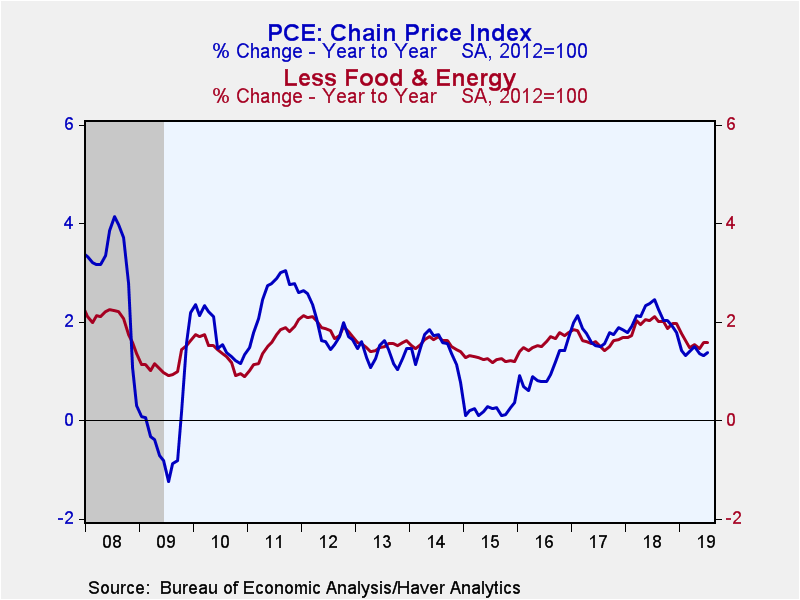
The personal consumption chain price headline and core indexes both rose 0.2% in July (1.4% and 1.6% y/y respectively).
The personal income and consumption figures are available in Haver's USECON database with detail in the USNA database. The Action Economics figures are in the AS1REPNA database
Gerald D. Cohen
AuthorMore in Author Profile »Gerald Cohen provides strategic vision and leadership of the translational economic research and policy initiatives at the Kenan Institute of Private Enterprise.
He has worked in both the public and private sectors focusing on the intersection between financial markets and economic fundamentals. He was a Senior Economist at Haver Analytics from January 2019 to February 2021. During the Obama Administration Gerald was Deputy Assistant Secretary for Macroeconomic Analysis at the U.S. Department of Treasury where he helped formulate and evaluate the impact of policy proposals on the U.S. economy. Prior to Treasury, he co-managed a global macro fund at Ziff Brothers Investments.
Gerald holds a bachelor’s of science from the Massachusetts Institute of Technology and a Ph.D. in Economics from Harvard University and is a contributing author to 30-Second Money as well as a co-author of Political Cycles and the Macroeconomy.
More Economy in Brief
 Global| Feb 05 2026
Charts of the Week: Balanced Policy, Resilient Data and AI Narratives
by:Andrew Cates


