 Global| Oct 30 2007
IFO Details Begin to Show Cracks…
Summary
The IFO indexes from Germany provide us with detail to their earlier release. The chart on the left shows that the EU indexes for Germany’s MFG sector track the result for the IFO. Both indexes are pointing lower with the IFO index [...]
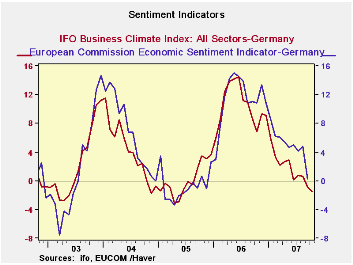
The IFO indexes from Germany provide us with detail to their
earlier
release. The chart on the left shows that the EU indexes for Germany’s
MFG sector track the result for the IFO. Both indexes are pointing
lower with the IFO index more up-to-date. The climate gauge is closing
in on a level that is near its position when Germany’s economy was
still struggling with EU debt limits and growth before the recent run
up in growth and optimism came to pass. The table below documents some
of the more worrisome elements of the new IFO survey
The percentile column (the last column) and red highlights
provide
the best overview for this table. While the strong and rising euro
seems to be one of the main risk factors to German growth, foreign
orders on hand continue to be buoyant (last listing in the table).
Foreign orders on hand rank high in terms of the individual sector
percentile readings. The foreign order series is just beginning to show
decline in its monthly measures (not encroaching red highlights)
whereas the more inclusive ‘orders on hand’ category has been dropping
for some time and shows percentile ranks for current readings that are
at or below the midpoint mark except for capital goods. We know that
capital goods is one area of strength for Germany That may be one of
the reason its export demand or orders are holding up better that
orders in general. But that is not all of it since all export orders
are holding up better than orders in general. With the euro so strong
that has to be viewed as a curiosity. Even though many German ‘foreign’
orders do not cross the exchange market at some point they are still
exports and subject to competition from weak currencies.
Capital goods also tend to work on longer lags and the longer
the
Euro remains high the greater the prospect for Germany to lose orders
to capital goods competitors like Japan and the US even though it does
not appear to have happened yet.
Percentiles for activity measures also have slipped to mid
range or
weaker except for capital goods. Despite this, expectations for the
next six months are generally upbeat even for consumer goods. The
percentile readings are generally around the 60% mark or higher with a
few exceptions. As for current conditions, the percentile sector
readings are solid to strong.
Today’s German survey on consumer optimism, a poll by the Forsa institute, was commissioned by Germany's RTL television. It was carried out among 2,503 respondents from October 22 to 26. Some 43% of those surveyed said they expected the state of the economy to worsen, up from 28% in the previous Forsa survey conducted in May. Only 26% in the current survey said they expected the economy to pick up further, down from 41% in the May survey. Clearly, conditions and expectations are in flux in Germany. The IFO components are only beginning to show some of the ill effects of these shifts. The optimism of past success seems to weigh heavily on new assessments for the future among the IFO respondents.
| IFO Survey: Germany | |||||||||
|---|---|---|---|---|---|---|---|---|---|
| Percent: Yr/Yr | Index Numbers | ||||||||
| Oct 07 |
Sep 07 |
Aug 07 |
Jul 07 |
Jun 07 |
Current | Average | Curr/ Avg |
%tile | |
| Biz Climate | -1.5% | -0.9% | 0.7% | 0.8% | 0.2% | 103.9 | 95.7 | 108.5% | 79.7% |
| Current Situation | -2.1% | -1.3% | 2.5% | 2.4% | 1.6% | 109.6 | 94.8 | 115.6% | 82.3% |
| Biz Expectations | -0.7% | -0.4% | -1.1% | -0.9% | -1.2% | 98.6 | 96.7 | 102.0% | 68.6% |
| Oct 07 |
Sep 07 |
Aug 07 |
Jul 07 |
Jun 07 |
Current | Average | Curr/ Avg |
%tile | |
| Biz Climate | -1.5% | -0.9% | 0.7% | 0.8% | 0.2% | 103.9 | 95.7 | 108.5% | 79.7% |
| Current Situation | -2.1% | -1.3% | 2.5% | 2.4% | 1.6% | 109.6 | 94.8 | 115.6% | 82.3% |
| MFG | 0.0% | 0.8% | 4.4% | 4.4% | 4.4% | 109.5 | 92.4 | 118.5% | 90.8% |
| Intermediate | -1.6% | -0.5% | 3.1% | 3.0% | 4.3% | 109.0 | 91.0 | 119.8% | 86.6% |
| Capital | 2.9% | -0.4% | 5.5% | 4.8% | 5.1% | 113.1 | 92.1 | 122.7% | 97.1% |
| Consumer | 1.0% | 4.3% | 5.4% | 5.3% | 5.3% | 105.5 | 95.9 | 110.0% | 81.3% |
| Construction | -5.9% | -6.0% | -2.2% | -3.1% | -4.0% | 112.3 | 103.0 | 109.0% | 64.0% |
| Wholesale | -5.9% | -2.2% | -1.9% | -0.8% | 0.0% | 114.4 | 99.3 | 115.2% | 68.7% |
| Retail | -4.4% | -6.6% | 2.1% | 1.1% | -4.1% | 103.3 | 95.4 | 108.3% | 77.7% |
| Next 6 Mos | |||||||||
| Biz Expectations | Oct 07 |
Sep 07 |
Aug 07 |
Jul 07 |
Jun 07 |
Current | Average | Curr/ Avg |
%tile |
| MFG | -2.4% | -1.5% | -1.9% | -0.5% | -2.8% | 97.4 | 96.5 | 100.9% | 67.4% |
| Intermediate | -6.5% | -4.8% | -2.8% | -2.3% | -4.2% | 94.2 | 96.0 | 98.2% | 51.7% |
| Capital | 2.4% | 2.1% | -1.4% | 4.4% | -2.7% | 100.6 | 96.4 | 104.4% | 75.4% |
| Consumer | -0.5% | 1.0% | 0.5% | -2.3% | 0.9% | 99.1 | 97.8 | 101.3% | 62.6% |
| Construction | 3.4% | 3.4% | 0.1% | 0.2% | 0.4% | 101.3 | 98.2 | 103.1% | 57.4% |
| Wholesale | -3.4% | 3.5% | 0.5% | -3.8% | 2.8% | 101.3 | 97.0 | 104.4% | 63.5% |
| Retail | 5.5% | -3.0% | -0.5% | -0.5% | -0.5% | 98.4 | 96.0 | 102.5% | 70.1% |
| (m/m) | |||||||||
| Activty(m/m) | Oct 07 |
Sep 07 |
Aug 07 |
Jul -07 |
Jun 07 |
Current | Average | Curr/ Avg |
%tile |
| MFG | -5.3% | -4.5% | 1.0% | -1.8% | -3.6% | 96.9 | 97.0 | 99.9% | 52.9% |
| Intermediate | -8.6% | -5.8% | 0.5% | -5.9% | -4.6% | 93.2 | 96.3 | 96.8% | 42.4% |
| Capital | -3.3% | -2.3% | 0.0% | 0.5% | -2.7% | 99.0 | 97.1 | 102.0% | 63.8% |
| Consumer | -3.9% | -3.3% | 3.5% | -0.5% | -2.4% | 99.3 | 98.4 | 100.9% | 50.9% |
| Demand M/M | Oct 07 |
Sep 07 |
Aug 07 |
Jul 07 |
Jun 07 |
Current | Average | Curr/ Avg |
%tile |
| MFG | -8.4% | -6.4% | -2.8% | -3.3% | -7.1% | 95.3 | 97.1 | 98.2% | 48.5% |
| Intermediate | -13.8% | -9.2% | -3.8% | -6.8% | -10.3% | 91.5 | 97.5 | 93.8% | 33.0% |
| Capital | -3.7% | -4.2% | -1.9% | -3.2% | -4.9% | 98.8 | 96.0 | 102.9% | 72.5% |
| Consumer | -9.5% | -6.4% | -2.8% | 6.0% | -7.4% | 93.3 | 96.6 | 96.6% | 35.2% |
| Orders on hand | Oct 07 |
Sep 07 |
Aug 07 |
Jul 07 |
Jun 07 |
Current | Average | Curr/ Avg |
%tile |
| MFG | -7.9% | -4.6% | -2.3% | -2.7% | -3.6% | 97.4 | 96.5 | 101.0% | 55.7% |
| Intermediate | -13.3% | -9.6% | -5.2% | -8.4% | -6.7% | 93.5 | 96.5 | 96.8% | 39.9% |
| Capital | -1.8% | -0.9% | -0.5% | 1.0% | 0.8% | 101.5 | 95.7 | 106.1% | 77.1% |
| Consumer | -6.3% | -2.4% | 0.5% | 1.0% | -5.1% | 98.2 | 98.5 | 99.7% | 40.4% |
| Fgn orders on hand | Oct 07 |
Sep 07 |
Aug 07 |
Jul 07 |
Jun 07 |
Current | Average | Curr/ Avg |
%tile |
| MFG | -0.4% | 0.5% | 2.4% | 1.9% | 2.0% | 111.0 | 94.6 | 117.3% | 95.2% |
| Intermediate | -3.4% | -2.0% | 0.0% | -0.5% | 0.0% | 107.2 | 93.7 | 114.3% | 83.3% |
| Capital | 3.2% | 2.9% | 6.1% | 5.3% | 6.3% | 114.7 | 93.5 | 122.6% | 97.6% |
| Consumer | -0.4% | 2.1% | 1.6% | 0.0% | -0.5% | 112.2 | 98.5 | 113.9% | 93.7% |
| Yr/Yr percentage changes in underlying Indices | |||||||||

Robert Brusca
AuthorMore in Author Profile »Robert A. Brusca is Chief Economist of Fact and Opinion Economics, a consulting firm he founded in Manhattan. He has been an economist on Wall Street for over 25 years. He has visited central banking and large institutional clients in over 30 countries in his career as an economist. Mr. Brusca was a Divisional Research Chief at the Federal Reserve Bank of NY (Chief of the International Financial markets Division), a Fed Watcher at Irving Trust and Chief Economist at Nikko Securities International. He is widely quoted and appears in various media. Mr. Brusca holds an MA and Ph.D. in economics from Michigan State University and a BA in Economics from the University of Michigan. His research pursues his strong interests in non aligned policy economics as well as international economics. FAO Economics’ research targets investors to assist them in making better investment decisions in stocks, bonds and in a variety of international assets. The company does not manage money and has no conflicts in giving economic advice.
More Economy in Brief

 Global| Feb 05 2026
Charts of the Week: Balanced Policy, Resilient Data and AI Narratives
by:Andrew Cates

