 Global| Oct 24 2007
Italy's Biz Index in a Small, Unconvincing Rebound
Summary
The ISAE business index did improve slightly in October from September. But the index, as well as its momentum, remain solidly in a down trend The ISAE business survey components tell a tale of a sector that is fading. For overall [...]
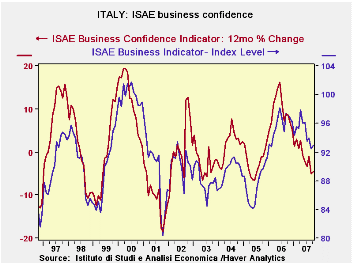
The ISAE business index did improve slightly in October from September. But the index, as well as its momentum, remain solidly in a down trend… The ISAE business survey components tell a tale of a sector that is fading. For overall industry the total order books and demand responses are at the 50% mark market and are dead neutral. Domestic and foreign demand are each rated a tick or so above neutral. Inventories are soaring and high. Production, as result, is below neutral at a reading of 49. The detail shows a story that has become old hat for the Euro area. The weakness is in intermediate goods and in consumer goods. Intermediate goods readings are below the 50% mark for the most part while consumer goods ratings cluster in the BOTTOM THIRD of their respective ranges. The sense of firmness that the overall measure retains is a function totally of capital goods where readings remains elevated at about the top third of their respective ranges with the notable exception of foreign orders for capital goods that are now little better that neutral. Cleary Italy is flashing some warning signals. The Euro area PMI for MFG was doing much the same today.
07
Aug
Jul
by Robert Brusca October 24, 2007
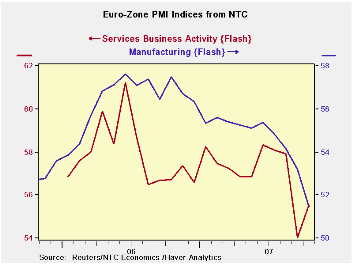
The NTC indexes are clear on the Euro area. It is weak. Manufacturing is showing progressively less lift. The service sector, hard hit in September, is up in October, but, were it not for the weak September this October reading would be the weakest on record (meaning since January ‘06 of course). But the manufacturing PMI has much longer history. It is on its lows over the past 22 months but is in its 48Th percentile since its inception going back to 1997, a period that includes a recession. Seeing the manufacturing reading on a two year low and below its range midpoint over the long haul is unsettling. On top of that the manufacturing PMI level is at 51.47 barely above the neutral reading of 50. The current manufacturing level stands that reading at about 97% of its full sample average and median. The charts make it clear that slippage is in train. The rebound in October for services is not something to take to the bank with manufacturing losing momentum especially since the services index is still bearing a low reading. Expect the ECB to remain afraid and on hold after these reports.
07
07 Aug
07 Jul
07 3Mo 6Mo 12Mo High Low %Range
by Carol Stone October 24, 2007
Oh, my.
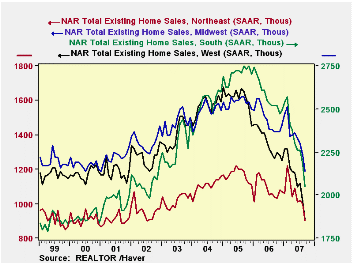
A month ago here, Robert Brusca made a fairly calm assessment of home sales in most of the country. "...holding their year-to-year declines to less than 10%" for instance. Only the drop in the West was nettlesome to him.
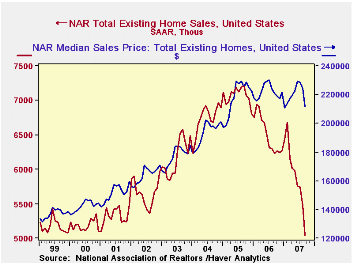
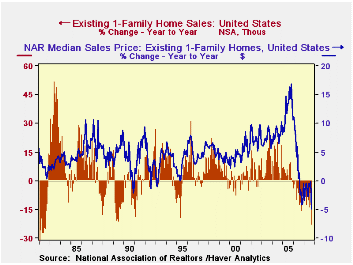
This month is different. Total existing home sales across the country fell 8.0% from August amounts. All regions had sharp declines, the smallest in the South, 6.0%. And the Northeast, which had held up pretty well, dropped the most, by 10.0%. All the regions now have quite substantial year-on-year declines, ranging from 16.9% in the Northeast to 31.4% in the West.
The National Association of Realtors counts these sales at time of closing. So the September transactions would have gone to contract in June mostly, with some from May or July and a few in other months. That is, the bulk of these sales reflect market conditions earlier in the summer, before the worst of July and August's financial market distresses. So possibly the reaction to that is yet to appear in these data. Alternatively, as some analysts suggest this morning, the reduced number of closed sales may also reflect an increase in the rate at which previously contracted sales fell through as market conditions worsened. The latter condition would actually be preferable going forward, since it would mean that some of the dislocations have already been absorbed. One can hope.
Meantime, of course, we can make numerous historically unattractive comparisons. Using single-family-home data, which has a far longer history than total existing home sales, we see that the current sales volume is the lowest since January of 1998; the not-seasonally- adjusted figures show the lowest September value, 356,000, since 1997 at 351,000. Sales have been down on a year-to-year basis for 19 months, the most protracted contraction in these data since the double-digit interest rate period in 1980-81. Home prices are presently down on a year-to-year basis for 14 consecutive months, a completely unprecedented situation in the nearly 40-year history of the series; the longest previous period of yearly price decline was two months at the end of 1990. Prices were sluggish during 1992 and late in 1994, but still dipped below year-earlier levels on only isolated occasions.
| Sept 2007 | Aug 2007 | Year Ago | 2006 | 2005 | 2004 | |||
|---|---|---|---|---|---|---|---|---|
| Number | M/M% | Y/Y% | ||||||
| Total Sales | 5,040 | -8.0 | -22.7 | 5,480 | 6,230 | 6,478 | 7,076 | 6,778 |
| Northeast | 900 | -10.0 | -16.9 | 1,000 | 1,040 | 1,086 | 1,169 | 1,113 |
| Midwest | 1,190 | -7.0 | -20.2 | 1,280 | 1,420 | 1,483 | 1,588 | 1,550 |
| South | 2,050 | -6.0 | -22.4 | 2,180 | 2,520 | 2,563 | 2,702 | 2,540 |
| West | 910 | -9.9 | -31.4 | 1,010 | 1,260 | 1,346 | 1,617 | 1,575 |
| Single-Family | 4,380 | -8.6 | -22.9 | 4,790 | 5,460 | 5,677 | 6,180 | 5,958 |
| Median Price, Total, $ | 211,700 | n.m. | -4.9 | 224,400 | 220,900 | 222,000 | 218,217 | 193,233 |

Robert Brusca
AuthorMore in Author Profile »Robert A. Brusca is Chief Economist of Fact and Opinion Economics, a consulting firm he founded in Manhattan. He has been an economist on Wall Street for over 25 years. He has visited central banking and large institutional clients in over 30 countries in his career as an economist. Mr. Brusca was a Divisional Research Chief at the Federal Reserve Bank of NY (Chief of the International Financial markets Division), a Fed Watcher at Irving Trust and Chief Economist at Nikko Securities International. He is widely quoted and appears in various media. Mr. Brusca holds an MA and Ph.D. in economics from Michigan State University and a BA in Economics from the University of Michigan. His research pursues his strong interests in non aligned policy economics as well as international economics. FAO Economics’ research targets investors to assist them in making better investment decisions in stocks, bonds and in a variety of international assets. The company does not manage money and has no conflicts in giving economic advice.
More Economy in Brief


