 Global| Aug 06 2007
June manufacturing New Orders in Germany Rise Sharply While Sales Show a Small Decline
Summary
German new orders for manufacturing in nominal terms rose 4.65% in June from May. This was the largest month to month rise since December, 2004. The rise was due almost entirely to a rise in foreign orders, which rose 8.90% from May [...]
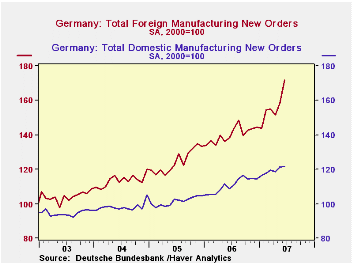
German new orders for manufacturing in nominal terms rose 4.65% in June from May. This was the largest month to month rise since December, 2004. The rise was due almost entirely to a rise in foreign orders, which rose 8.90% from May and 24.04% from June 2006. Domestic orders rose only 0.41% in June from May and were 11.75% above June 2006. Indexes for domestic and foreign new orders are shown in the first chart.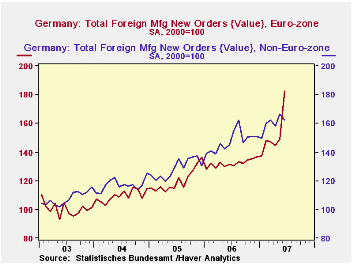
The rise in foreign orders came from a 22.39% increase in orders from other Euro Zone countries. Orders from non Euro Zone countries actually declined by 2.70% in June, due perhaps to the continued rise in the Euro. Indexes of new orders from Euro Zone countries and non Euro Zone countries are shown in the second chart
The composition of German manufacturing new orders is heavily weighted by capital goods, reflecting Germany's engineering expertise. Capital goods new orders increased 8.61% in June from May, while consumer goods new orders declined 1.48% in the same period. Manufacturing new orders of capital and consumer goods are shown in the third chart.
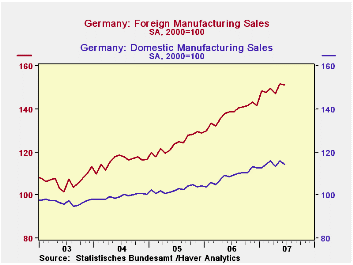
Manufacturing sales, in contrast to new orders, declined 0.77% in June from May and were 7.02% above June, 2006. Domestic manufacturing sales were down 1.21% in June, while foreign sales managed a small increase of 0.20%. Foreign sales continue to be more dynamic than domestic as can be seen in the fourth chart. The increase in sales to other Euro Zone countries was a mere 0.07% and sales to non Euro Zone countries declined 0.44%.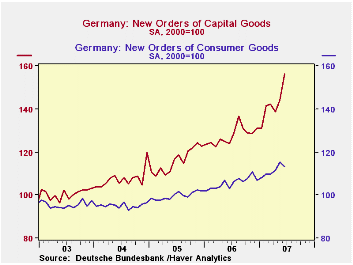
| GERMAN NEW ORDERS AND SALES (Nominal (2000=100)) | Jun 07 | May 07 | Jun 06 | M/M Chg | Y/Y Chg | 2006 | 2005 | 2004 |
|---|---|---|---|---|---|---|---|---|
| New Orders | 144.0 | 137.6 | 122.1 | 4.65 | 17.94 | 123.9 | 111.7 | 105.0 |
| Domestic | 121.7 | 121.2 | 108.9 | 0.41 | 11.75 | 110.9 | 101.4 | 98.3 |
| Foreign | 171.8 | 158.2 | 138.5 | 8.60 | 24.02 | 140.1 | 127.4 | 113.5 |
| Euro Zone | 182.6 | 149.2 | 131.3 | 22.39 | 39.07 | 132.1 | 120.4 | 109.6 |
| Non Euro Zone | 161.9 | 166.4 | 145.1 | -2.70 | 11.58 | 147.4 | 128.6 | 117.1 |
| Capital Goods | 156.5 | 144.1 | 123.9 | 8.61 | 26.31 | 127.5 | 116.1 | 107.5 |
| Consumer Goods | 113.5 | 115.2 | 102.9 | -1.48 | 10.30 | 105.7 | 99.8 | 95.1 |
| Sales | 128.1 | 129.1 | 119.7 | -0.77 | 7.02 | 119.6 | 110.6 | 105.5 |
| Domestic | 114.4 | 115.8 | 108.5 | -1.21 | 5.44 | 108.8 | 102.7 | 99.4 |
| Foreign | 151.3 | 151.6 | 138.5 | -0.20 | 9.24 | 137.8 | 123.9 | 115.8 |
| Euro Zone | 144.5 | 144.4 | 131.8 | 0.07 | 9.64 | 131.1 | 119.5 | 113.4 |
| Non Euro Zone | 157.8 | 158.5 | 145.0 | -0.44 | 8.83 | 144.2 | 128.1 | 118.1 |
by Tom Moeller August 6, 2007
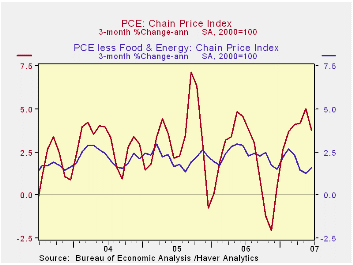
For all of the concern about rising prices that recently has been expressed in Washington by the Federal Reserve Board, the most recent price trends are quite favorable. That's even excluding the recent decline in gasoline prices
As on June, growth in the core (excluding food & energy) PCE chain price index has decelerated on a three month basis to 1.6% (1.9% y/y). Which is nearly half its growth rate a year ago.
Many attribute the good pricing news to the recently weak growth in GDP. Perhaps. But price inflation is first and foremost a monetary phenomenon, and the latest news comes at a time of strong growth in M2 (6.2% y/y) and MZM (8.4% y/y). Both those growth rates are roughly double the growth during last year which was up or double the growth during 2005. 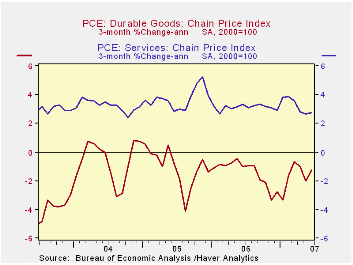
Historically, the cash in one's pocket has mattered for pricing pressure as much as how fast the economy is growing. the Fed's vigilance of this is comforting.
To follow is a review of recent pricing patterns. To the upside has of course been the recent pressure on prices for food & beverages (4.0% y/y), communication (-0.8% y/y) and personal care (3.1% y/y) led by faster growth in legal fees (5.1% y/y).
Easing price pressure is perhaps more pervasive. Growth in prices for durable goods are under downward pressure such as seen for prices of new vehicles (-1.0% y/y), household furniture (-0.8% y/y) and appliances (2.45 y/y).
Nondurables prices are showing easing price pressure as well in the apparel (-1.3% y/y) and shelter (3.7% y/y) areas.
To wrap up the areas where price pressure is easing are the medical care services (5.0% y/y), public transportation (-0.4% y/y), tenants & household insurance (0.6 y/y), and education (5.7% y/y), notably tuition.
The U.S. economy always has been one where some areas experiencing rising pressure are offset by areas of slack. That suggests that one is always at risk to focus on one and not the other. The cries of "depression" in the economy several years ago ignored the strength that was then being seen in housing and personal income, although these latter areas were growing at slower rates. It's never easy.
When Did Inflation Persistence Change? from the Federal Reserve Bank of Cleveland is available here.
UK IP Restores Momentumby Robert Brusca August 6, 2007
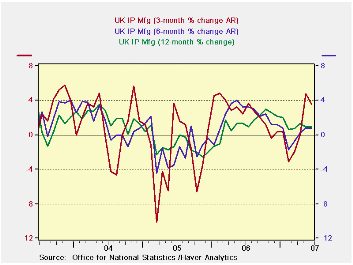
Year-over-year and six-month trends in UK IP are steady at a pacifistic 1%. But over the past three months UK IP has now accelerated strongly to a pace of just under 4% (at 3.6%).
UK IP is up strongly in Q2 (see end of the table). The overall gain in MFG is a rate of 2.8% Capital goods are leading the growth in Q2 with a quarterly rise at a pace of 4.9%; Consumer durables are the trailing category with a pace of just +0.3% in Q2. Vehicle sales have been firm, propelling vehicle output up at a 13.4% pace in Q2. Mining activity has been strong at 3.1% in the quarter but its growth patterns seems to show some cooling. Electricity, gas and water output have been weak, at a pace of 0.1% in the quarter, but apart from that the sector’s trends look solid.
| SAAR except M/M | M/M | Jun-07 | May-07 | Jun-07 | May-07 | Jun-07 | May-07 | |||
| UK MFG | Jun-07 | May-07 | Apr-07 | 3-Mo | 3-Mo | 6-mo | 6-mo | 12-mo | 12-mo | Q-to-Date |
| MFG | 0.2% | 0.4% | 0.3% | 3.6% | 4.8% | 0.8% | 0.8% | 1.0% | 1.0% | 2.8% |
| Consumer Durables | 3.4% | -0.9% | -1.5% | 3.9% | -2.3% | -3.2% | -8.6% | 0.5% | -3.1% | 0.3% |
| Consumer Nondurables | -0.6% | 0.6% | 0.4% | 1.6% | 4.1% | -2.6% | 0.2% | -0.2% | -0.1% | 1.4% |
| Intermediate | 0.2% | 0.7% | 0.0% | 3.9% | 2.6% | 3.9% | 1.3% | 0.3% | -0.1% | 2.1% |
| Capital | 0.5% | 0.5% | 0.6% | 6.4% | 7.6% | 3.0% | 1.8% | 3.0% | 2.9% | 4.9% |
| Memo: Detail | 1-Mo% | 1-Mo% | 1-Mo% | 3-Mo | 3-Mo | 6-mo | 6-mo | 12-mo | 12-mo | Q-to-Date |
| Food Drink & Tobacco | -0.2% | 0.3% | 0.1% | 0.8% | 2.4% | -2.3% | 0.0% | -0.4% | 0.6% | 0.4% |
| Textile & Leather | 1.4% | -0.9% | 0.5% | 3.8% | 3.4% | 0.0% | -0.7% | 0.2% | -0.2% | 3.5% |
| Motor Vehicles & Trailer | 2.1% | 0.5% | 1.3% | 17.1% | 17.0% | 13.5% | 9.5% | 4.3% | 2.7% | 13.4% |
| Mining and Quarry | -1.0% | 1.3% | 0.9% | 4.9% | -1.0% | 9.1% | 2.1% | -0.4% | -2.7% | 3.1% |
| Electricity, Gas & Water | 1.0% | 2.4% | -1.2% | 9.0% | 0.8% | 3.1% | 1.0% | 0.7% | 0.1% | 0.1% |
by Robert Brusca August 6, 2007
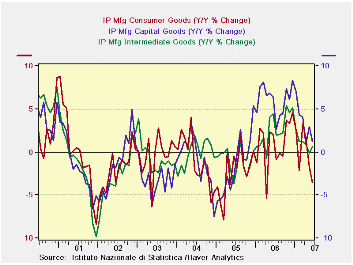
Unlike the strength in UK IP in June or the sharp rise in orders in Germany, Italy’s MFG sector is showing a broad-based slowing.
Italy’s three-month growth rates by sector tell the story of a slowdown across the board. Overall IP remains in a declining mode for both 3-month and 6-month growth rates and these are both much weaker even than its Y/Y decline. The consumer sector in Italy shows an accelerated decline in the output of both consumer durables and nondurable goods.. One minor exception is the three-month bounce back in intermediate goods, up by 2.1% over three months but still showing a six-month rate of decline of 3.4%. Transportation is the counter-trend sector with output up by a strong 9.5% over three months and up by 0.7% over six months; its Yr/yr pace stands at 4.2%.
Italy has been showing more irregularity than other Euro area countries for some time. While German industrial measures like its IFO survey show that Germany is well off peak, other measures like German orders (issued today) still show a lot strength - even acceleration. But Italy, one of the weaker EMU countries in terms of its competitiveness is showing its wear and tear more regularly. I wonder if this is the way the strong euro will undermine the Euro area, by gnawing away at its weakest members first…
| SAAR except m/m | Jun-07 | May-07 | Apr-07 | 3-month | 6-month | 12-month |
| IP-MFG | -0.7% | 0.6% | -1.0% | -4.4% | -5.5% | -0.3% |
| Consumer Goods | -1.5% | 0.3% | -2.0% | -11.8% | -9.7% | -3.5% |
| Capital Goods | -1.0% | 1.2% | -2.1% | -7.3% | -4.9% | 1.2% |
| Intermediate Goods | 0.4% | 0.8% | -0.7% | 2.1% | -3.4% | 0.6% |
| Memo: Transportation | 0.2% | 5.5% | -3.2% | 9.5% | 0.7% | 4.2% |
More Economy in Brief
 Global| Feb 05 2026
Charts of the Week: Balanced Policy, Resilient Data and AI Narratives
by:Andrew Cates


