 Global| Apr 01 2016
Manufacturing ISM Index Jumps on Production and Orders
by:Sandy Batten
|in:Economy in Brief
Summary
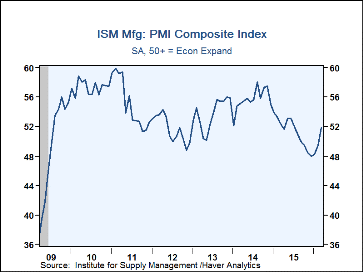
The ISM Composite Index of manufacturing activity rose more than expected to 51.8 in March from 49.5 in February. The Action Economics Forecast Survey had looked for an increase to 50.7. The data from the Institute for Supply [...]
The ISM Composite Index of manufacturing activity rose more than expected to 51.8 in March from 49.5 in February. The Action Economics Forecast Survey had looked for an increase to 50.7. The data from the Institute for Supply Management (ISM) are diffusion indexes where a reading above 50 indicates an increase. This is the first time the composite index has been above the critical 50 level since last August, and it is the highest reading since July 2015. The ISM estimates that the average composite index reading for January through March (49.8) is consistent with a 2.1% q/q AR increase in real GDP (to be released on April 28).
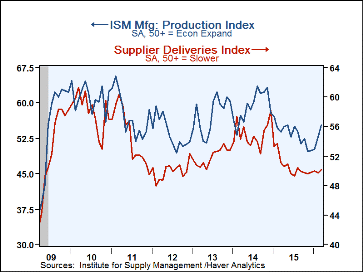
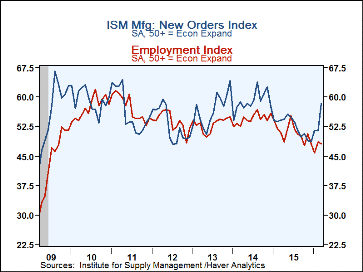
The March increase in the composite index was propelled largely by significant increases in the new orders and production subcomponents. (The composite index is an unweighted average of five subcomponent indexes--new orders, production, employment, supplier deliveries, and inventories.) New orders jumped to 58.3 in March from 51.5 in February. This is its third consecutive month above 50 and its highest reading since November 2014. The performance of the new orders index clearly reflected a boost from export orders. This subcomponent (not included directly in the calculation of the composite index) rose to 52.0 in March from 46.5 February, its first reading above 50 since last May and its highest since November 2014. The production index improved to 55.3 in March from 52.8 in February. This is also its third consecutive month above 50 and its highest reading since last May. The supplier deliveries index edged above 50 for the first time since last August. The March reading points to slower deliveries, which indicates an improvement in the pace of manufacturing activity.
The two laggards in the March report were the employment and inventories components. The employment index slipped to 48.1 in March from 48.5 in February. This is its fourth consecutive month below 50 and comports with the 29,000 decline in manufacturing employed indicated by the March employment report released earlier this morning. The inventories index rose to 47.0 in March from 45.0 in February but remained below 50 for the ninth consecutive month, indicating that the ongoing inventory correction appears to be continuing though at a slower pace.
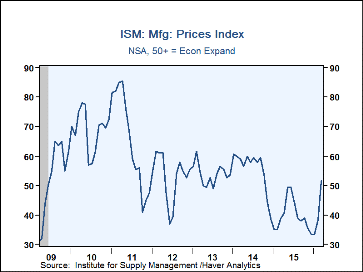
Of note in the other subcomponent indexes was the jump in the prices paid index to 51.5 in March from 38.5 in February. This is the first time this index has moved above 50 since October 2014. As energy in a product used by almost all of the purchasing managers surveyed and this is a diffusion index, the jump in this index in March likely reflects the slight rebound in oil prices that occurred during March.
The figures from the Institute for Supply Management can be found in Haver's USECON database. The expectations number is in Haver's AS1REPNA database.
| ISM Mfg (SA) | Mar | Feb | Jan | Mar '15 | 2015 | 2014 | 2013 |
|---|---|---|---|---|---|---|---|
| Composite Index | 51.8 | 49.5 | 48.2 | 52.3 | 51.3 | 55.6 | 53.8 |
| New Orders | 58.3 | 51.5 | 51.5 | 54.2 | 52.6 | 58.9 | 56.8 |
| Production | 55.3 | 52.8 | 50.2 | 53.9 | 53.5 | 59.2 | 57.5 |
| Employment | 48.1 | 48.5 | 45.9 | 50.9 | 51.0 | 54.4 | 53.1 |
| Supplier Deliveries | 50.2 | 49.7 | 50.0 | 51.1 | 50.7 | 55.0 | 51.9 |
| Inventories | 47.0 | 45.0 | 43.5 | 51.5 | 49.0 | 50.8 | 49.4 |
| Prices Paid Index (NSA) | 51.5 | 38.5 | 33.5 | 39.0 | 39.8 | 55.6 | 53.8 |
Sandy Batten
AuthorMore in Author Profile »Sandy Batten has more than 30 years of experience analyzing industrial economies and financial markets and a wide range of experience across the financial services sector, government, and academia. Before joining Haver Analytics, Sandy was a Vice President and Senior Economist at Citibank; Senior Credit Market Analyst at CDC Investment Management, Managing Director at Bear Stearns, and Executive Director at JPMorgan. In 2008, Sandy was named the most accurate US forecaster by the National Association for Business Economics. He is a member of the New York Forecasters Club, NABE, and the American Economic Association. Prior to his time in the financial services sector, Sandy was a Research Officer at the Federal Reserve Bank of St. Louis, Senior Staff Economist on the President’s Council of Economic Advisors, Deputy Assistant Secretary for Economic Policy at the US Treasury, and Economist at the International Monetary Fund. Sandy has taught economics at St. Louis University, Denison University, and Muskingun College. He has published numerous peer-reviewed articles in a wide range of academic publications. He has a B.A. in economics from the University of Richmond and a M.A. and Ph.D. in economics from The Ohio State University.


