 Global| May 26 2020
New Home Sales Surprise with Increase in April
by:Sandy Batten
|in:Economy in Brief
Summary
• New single-family edged up 0.6% m/m in April to 623,000, counter to expectations, with downward revisions to February and March. • Though down meaningfully so far this year, sales are still well above late-2018 lows. • Mortgage [...]
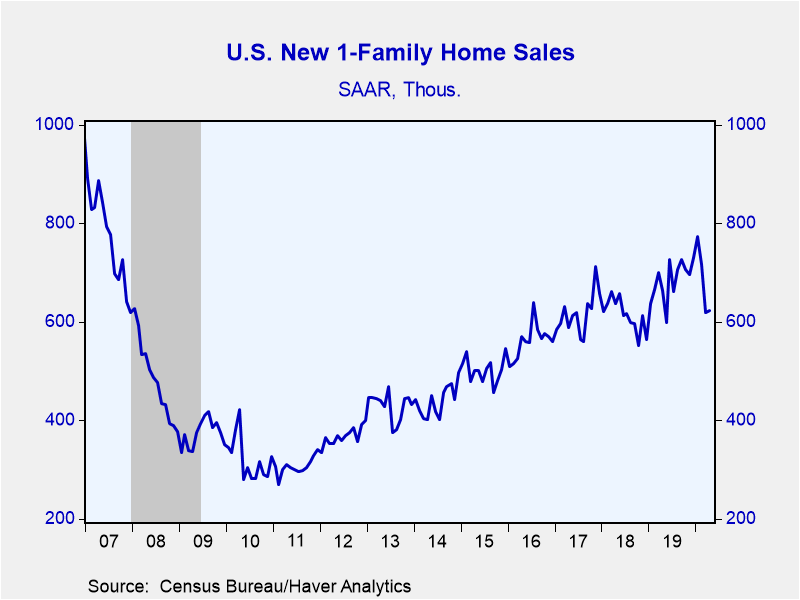
• New single-family edged up 0.6% m/m in April to 623,000, counter to expectations, with downward revisions to February and March.
• Though down meaningfully so far this year, sales are still well above late-2018 lows.
• Mortgage applications for purchase have risen for the past five consecutive weeks, offering the possibility of further gains ahead as the economy continues to reopen.
Sales of new single-family homes surprise market expectations with a 0.6% m/m rise (-6.2% y/y) to 623,000 in April. They had plummeted a revised 13.7% m/m in March to 619,000. The Action Economics Forecast panel had looked for a collapse in April sales to 493,000. Sales are down sharply from their expansion high of 774,000 in January 2020, but remain well above their recent low of 552,000 in late 2018. This report also contained annual revisions which generally lowered sales over the past few months from that initially reported.
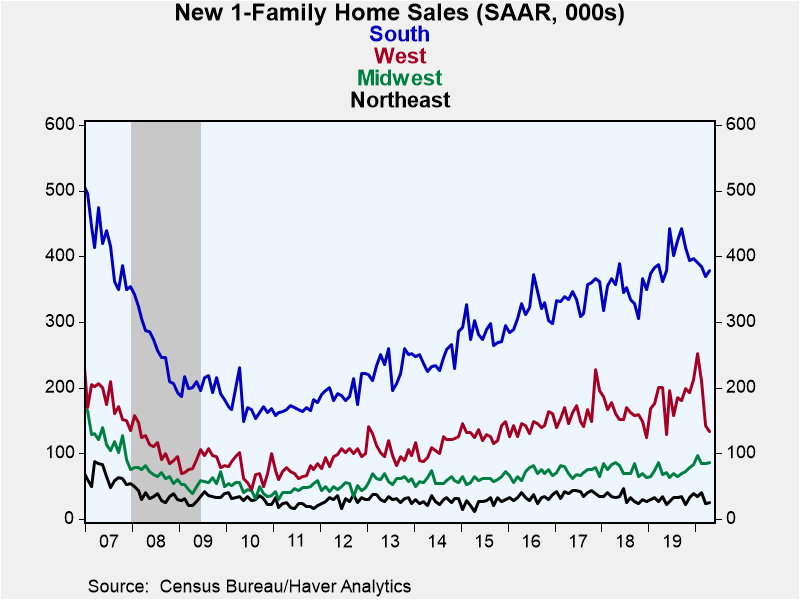
Weekly mortgage applications for purchase reported by the Mortgage Bankers Association have risen in each of the past five weeks and are now 41% above their early-April low, offering the possibility of further gains ahead as the economy continues to reopen. In April, sales rose in the Northeast (+8.7% m/m), the Midwest (+2.4% m/m) and the South (+2.4% m/m) and fell in the West (-6.3% m/m).
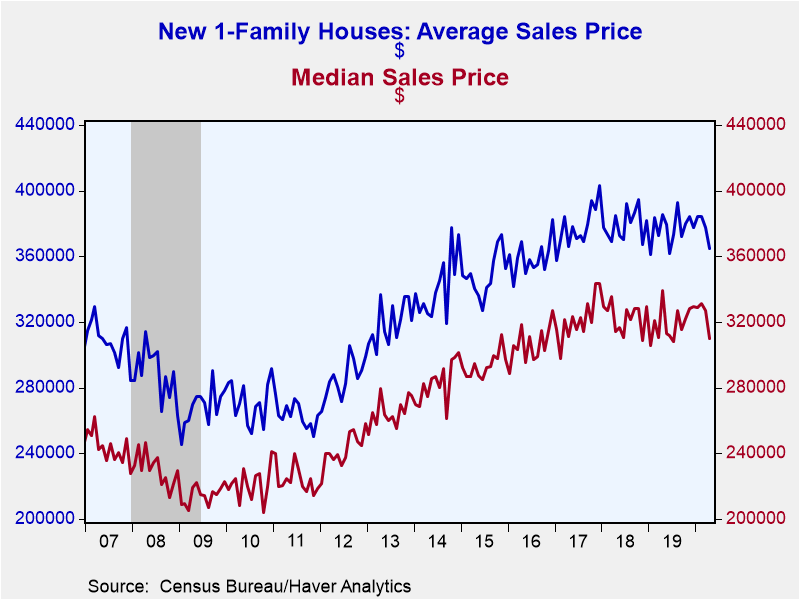
The median price of a new home declined to $309,900 in April (-5.2% m/m) while the average price of a new home decreased to $364,500 (-3.4% m/m). Home prices, which are not seasonally adjusted, have been range-bound for the past few years.
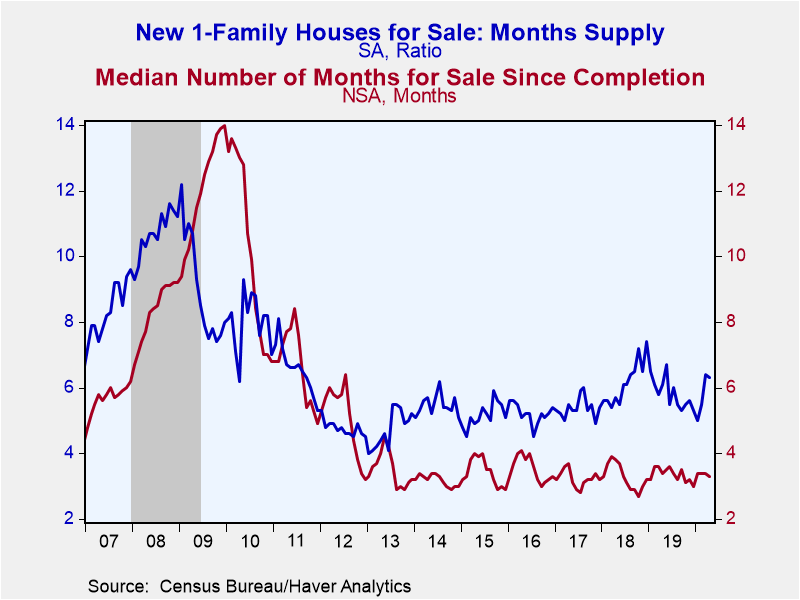
After having jumped up to 6.4 months in March, the months' supply of homes on the market eased back to 6.3 in April. This is still a troublesome level and is significantly higher than earlier this year, but is well below the nine-year high of 7.4 months seen in December 2018.
New home sales activity and prices are available in Haver's USECON database, while MBA loan applications can be found in SURVEYW. The consensus expectation figure from Action Economics is available in the AS1REPNA database.
| U.S. New Single-Family Home Sales (SAAR, 000s) | Apr | Mar | Feb | Apr Y/Y % | 2019 | 2018 | 2017 |
|---|---|---|---|---|---|---|---|
| Total | 623 | 619 | 717 | -6.2 | 684 | 615 | 617 |
| Northeast | 25 | 23 | 40 | -26.5 | 30 | 32 | 40 |
| Midwest | 86 | 84 | 84 | 26.5 | 72 | 75 | 72 |
| South | 379 | 370 | 384 | 4.7 | 399 | 348 | 341 |
| West | 133 | 142 | 209 | -33.5 | 183 | 160 | 164 |
| Median Price (NSA, $) | 309,900 | 326,900 | 331,400 | -8.6 | 321,500 | 326,400 | 323,100 |
Sandy Batten
AuthorMore in Author Profile »Sandy Batten has more than 30 years of experience analyzing industrial economies and financial markets and a wide range of experience across the financial services sector, government, and academia. Before joining Haver Analytics, Sandy was a Vice President and Senior Economist at Citibank; Senior Credit Market Analyst at CDC Investment Management, Managing Director at Bear Stearns, and Executive Director at JPMorgan. In 2008, Sandy was named the most accurate US forecaster by the National Association for Business Economics. He is a member of the New York Forecasters Club, NABE, and the American Economic Association. Prior to his time in the financial services sector, Sandy was a Research Officer at the Federal Reserve Bank of St. Louis, Senior Staff Economist on the President’s Council of Economic Advisors, Deputy Assistant Secretary for Economic Policy at the US Treasury, and Economist at the International Monetary Fund. Sandy has taught economics at St. Louis University, Denison University, and Muskingun College. He has published numerous peer-reviewed articles in a wide range of academic publications. He has a B.A. in economics from the University of Richmond and a M.A. and Ph.D. in economics from The Ohio State University.
More Economy in Brief
 Global| Feb 05 2026
Charts of the Week: Balanced Policy, Resilient Data and AI Narratives
by:Andrew Cates


