 Global| Jan 11 2008
OECD Leading Indicators Showing Declining Momentum
Summary
The OECD trend restores leading indicators show a slowing is in progress across the OECD area. The OECD prefers to look at 6-month changes in its indicators; these are presented for four separate non-overlapping periods at the bottom [...]

The OECD trend restores leading indicators show a slowing is
in progress across the OECD area. The OECD prefers to look at 6-month
changes in its indicators; these are presented for four separate
non-overlapping periods at the bottom of the table. All
regions/countries shown have declines over the recent past six months -
that indicates a loss of momentum. Over the previous 6-months only OECD
Europe was declining, although Japan barely avoided decline with a 0.1%
rise. Then over the previous two six month periods all regions saw
their trend restored leading indicators declining. What we have is a
slowdown that is broad-based.
It is very severe in some places. Japan’s six month drop of 7.5% is
sharp. The US drop of 3.8% is also considerable. The OECD Europe drop
of 2.4% is substantial.
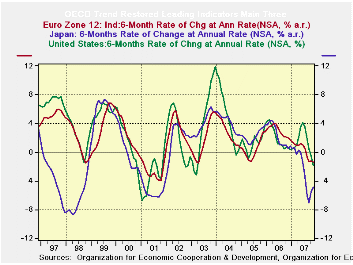
In the chart above we plot the various indices against the
recession bars for the US. The current US decline is not as severe as
it was the last time that the US went into recession. Japan’s decline
is on the same order of magnitude as it was the last time the US was in
recession, however. Europe’s decline is more like the sort of slowing
it had in 1996 than when the US was in recession in 2001. However, for
all these comparisons the situation is still in flux and in most places
flux means that conditions are still deteriorating.
| OECD Trend-restored leading Indicators | ||||
|---|---|---|---|---|
| Growth progression-SAAR | 3-Mos | 6-Mos | 12-mos | Yr-Ago |
| OECD | -3.1% | -3.1% | -0.3% | 2.2% |
| OECD 7 | -4.5% | -4.2% | -1.0% | 1.4% |
| OECD Europe | -1.8% | -2.4% | -0.7% | 2.4% |
| OECD Japan | -1.2% | -7.5% | -3.8% | 1.4% |
| OECD US | -6.6% | -3.8% | -0.1% | 1.5% |
| Six month readings at 6-Mo Intervals: | ||||
| Recent six | 6-Mo Ago | 12-Mo Ago | 18-Mo Ago | |
| OECD | -3.1% | 2.6% | 0.9% | 3.6% |
| OECD 7 | -4.2% | 2.2% | 0.1% | 2.6% |
| OECD Europe | -2.4% | 0.9% | 1.1% | 3.6% |
| OECD Japan | -7.5% | 0.1% | -0.5% | 3.3% |
| OECD US | -3.8% | 3.6% | 0.5% | 2.4% |
| Slowdowns indicated by BOLD RED | ||||
Robert Brusca
AuthorMore in Author Profile »Robert A. Brusca is Chief Economist of Fact and Opinion Economics, a consulting firm he founded in Manhattan. He has been an economist on Wall Street for over 25 years. He has visited central banking and large institutional clients in over 30 countries in his career as an economist. Mr. Brusca was a Divisional Research Chief at the Federal Reserve Bank of NY (Chief of the International Financial markets Division), a Fed Watcher at Irving Trust and Chief Economist at Nikko Securities International. He is widely quoted and appears in various media. Mr. Brusca holds an MA and Ph.D. in economics from Michigan State University and a BA in Economics from the University of Michigan. His research pursues his strong interests in non aligned policy economics as well as international economics. FAO Economics’ research targets investors to assist them in making better investment decisions in stocks, bonds and in a variety of international assets. The company does not manage money and has no conflicts in giving economic advice.
More Economy in Brief
 Global| Feb 05 2026
Charts of the Week: Balanced Policy, Resilient Data and AI Narratives
by:Andrew Cates


