 Global| Feb 21 2019
Philadelphia Fed Manufacturing Index Tumbles in February
by:Sandy Batten
|in:Economy in Brief
Summary
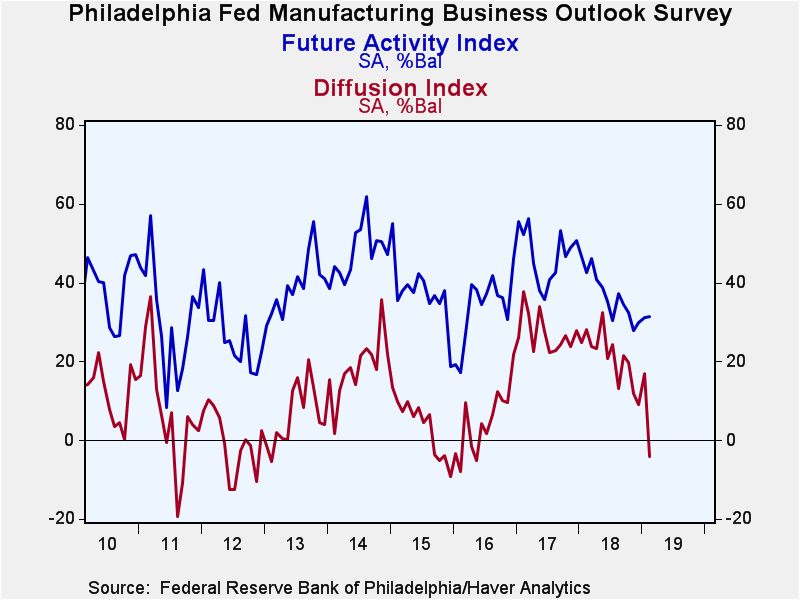
The Philadelphia Federal Reserve reported manufacturing conditions weakened considerably in February with its General Factory Sector Business Conditions Index falling to -4.1 from 17.0 in January. This was the first reading below the [...]
The Philadelphia Federal Reserve reported manufacturing conditions weakened considerably in February with its General Factory Sector Business Conditions Index falling to -4.1 from 17.0 in January. This was the first reading below the critical value of zero since May 2016. The Action Economics Forecast Survey median estimate was for a modest decline to 14.0. However, the index reflecting expectations of business conditions in six months edged up to 31.3 from 31.2 and has now risen for three consecutive months. These figures are diffusion indexes where readings above zero indicate expansion. The percentage of firms reporting an improvement in business activity slumped to 14.6% in February, the lowest reading since May 2009 in the midst of the Great Recession, from 30.4% in January. The percentage reporting weaker conditions rose to 18.7% from 13.4%.
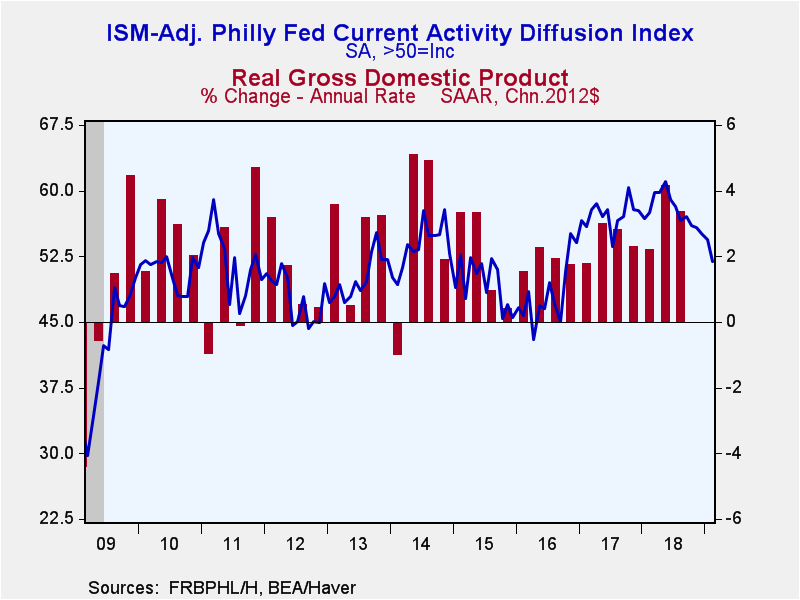
Haver Analytics constructs an ISM-Adjusted General Business Conditions Index. It declined to 51.9 in February from 54.4 in January and has been trending lower since it reached a cycle high of 61.1 in May of last year. Over the past eleven years, there has been a 65% correlation between the quarterly ISM-adjusted Philadelphia Fed Index and quarterly real GDP growth.
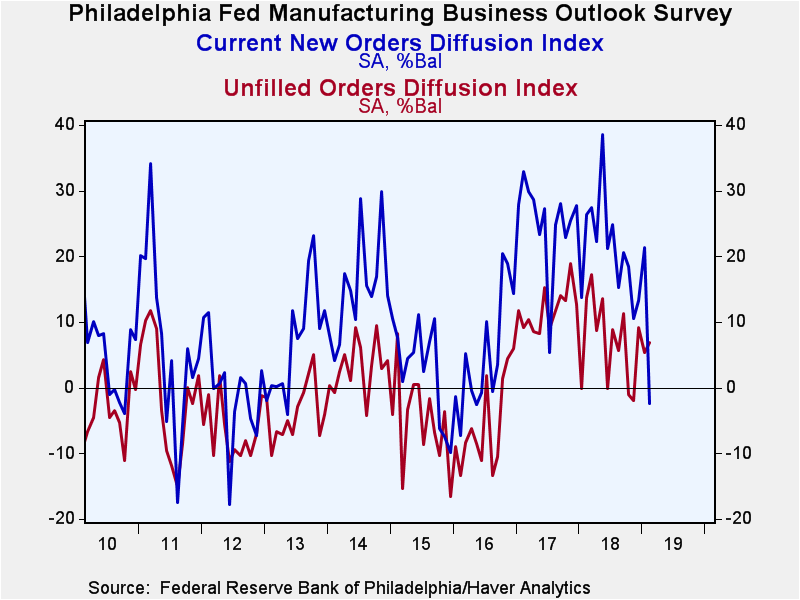
Leading the February decline in the overall index were the new orders and shipments components, which each fell markedly. The current new orders index decreased nearly 24 points to -2.4, the first reading below zero since August 2016 and the lowest reading since May 2016. The current shipments index decreased nearly 17 points to -5.3, its first reading below zero since September 2016. The movements of the other component indexes were, by comparison, more modest and mostly positive. The indexes for unfilled orders, delivery times, inventories, and employment all rose slightly in February while the workweek index fell a bit.
The employment index rebounded to 14.5 in February after having tumbled to 9.6 in January, the lowest level since September 2017. Over the past eleven years, there has been an 80% correlation between the employment index and the month-to-month change in factory sector payrolls. Nearly 24% of respondents reported increased hiring in February versus 22.1% in January. The percentage reporting a decline in hiring fell to 9.1% from 12.5%.
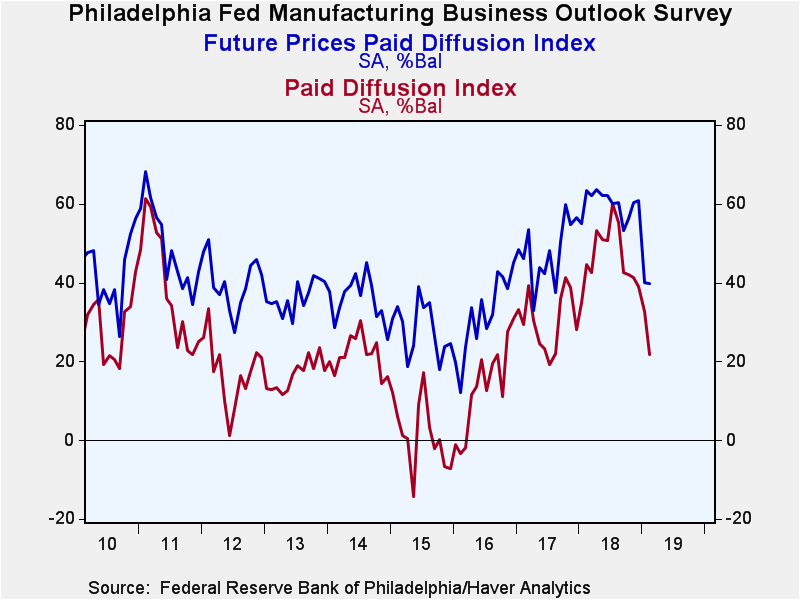
The index of prices paid declined sharply again in February, falling to 21.8 from 32.7. The February reading was the lowest since July 2017. Twenty-eight percent of firms reported paying higher prices, down sharply from 39.8% in January.
The survey panel consists of 150 manufacturing companies in the third Federal Reserve District (which consists of southeastern PA, southern NJ and Delaware). The diffusion indexes represent the percentage of respondents indicating an increase minus the percentage indicating a decrease in activity. The ISM-adjusted figure, calculated by Haver Analytics, is the average of five diffusion indexes: new orders, shipments, employment, delivery times and inventories with equal weights (20% each). Each ISM-adjusted index is the sum of the percent responding “higher” and one-half of the percent responding “same.”
The figures from the Philadelphia Federal Reserve dating back to 1968 can be found in Haver’s SURVEYS database. The expectation from the Action Economics Forecast Survey is available in AS1REPNA database.
| Philadelphia Fed - Manufacturing Business Outlook Survey (%, SA) | Feb | Jan | Dec | Feb'18 | 2018 | 2017 | 2016 |
|---|---|---|---|---|---|---|---|
| General Factory Sector Business Conditions | -4.1 | 17.0 | 9.1 | 28.1 | 21.1 | 27.3 | 4.9 |
| ISM-Adjusted Business Conditions | 51.9 | 54.4 | 55.1 | 57.5 | 57.7 | 57.3 | 48.2 |
| New Orders | -2.4 | 21.3 | 13.3 | 26.4 | 21.0 | 25.3 | 5.0 |
| Shipments | -5.3 | 11.4 | 12.4 | 20.1 | 22.8 | 26.8 | 6.9 |
| Unfilled Orders | 6.9 | 5.4 | 9.1 | 13.8 | 7.1 | 11.9 | -5.6 |
| Delivery Time | 13.6 | 13.4 | 5.5 | 6.9 | 9.5 | 10.6 | -4.6 |
| Inventories | 3.3 | -7.6 | 2.6 | 1.6 | 7.4 | 2.9 | -9.6 |
| Number of Employees | 14.5 | 9.6 | 19.1 | 23.6 | 21.6 | 16.1 | -5.6 |
| Average Workweek | 4.7 | 6.0 | 4.0 | 15.5 | 15.9 | 14.9 | -5.4 |
| Prices Paid | 21.8 | 32.7 | 38.9 | 44.7 | 46.4 | 30.4 | 13.5 |
| Expectations - General Business Conditions; Six Months Ahead | 31.3 | 31.2 | 29.9 | 42.5 | 36.9 | 47.1 | 33.7 |
Sandy Batten
AuthorMore in Author Profile »Sandy Batten has more than 30 years of experience analyzing industrial economies and financial markets and a wide range of experience across the financial services sector, government, and academia. Before joining Haver Analytics, Sandy was a Vice President and Senior Economist at Citibank; Senior Credit Market Analyst at CDC Investment Management, Managing Director at Bear Stearns, and Executive Director at JPMorgan. In 2008, Sandy was named the most accurate US forecaster by the National Association for Business Economics. He is a member of the New York Forecasters Club, NABE, and the American Economic Association. Prior to his time in the financial services sector, Sandy was a Research Officer at the Federal Reserve Bank of St. Louis, Senior Staff Economist on the President’s Council of Economic Advisors, Deputy Assistant Secretary for Economic Policy at the US Treasury, and Economist at the International Monetary Fund. Sandy has taught economics at St. Louis University, Denison University, and Muskingun College. He has published numerous peer-reviewed articles in a wide range of academic publications. He has a B.A. in economics from the University of Richmond and a M.A. and Ph.D. in economics from The Ohio State University.
More Economy in Brief
 Global| Feb 05 2026
Charts of the Week: Balanced Policy, Resilient Data and AI Narratives
by:Andrew Cates


