 Global| Nov 26 2013
September and October U.S. Housing Permits
by:Sandy Batten
|in:Economy in Brief
Summary
US housing permits for both September and October were released today, with the release of September data having been delayed by the federal government shutdown (October 1-16, 2013). However, housing starts data for September and [...]
 US housing permits for both September and October were released today, with the release of September data having been delayed by the federal government shutdown (October 1-16, 2013). However, housing starts data for September and October were not included in this release. According to the Census Bureau, "the lapse in federal funding affected the data collection schedule for the Survey of Construction, the source of data on new housing units started and completed. Accurate data collection for September and October 2013 could not be completed in time for the November 26 release. Data on housing units started and completed in September, October, and November 2013 will be released on December 18, 2013."
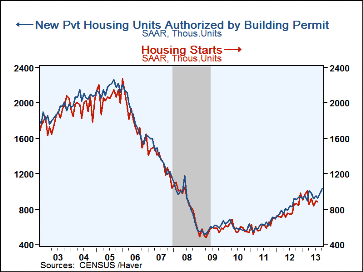
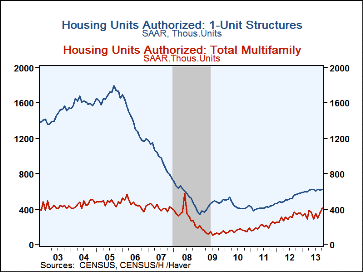
Building permits jumped more than expected in September and October, rising a cumulative 11.7% to 1,034k in October from an upwardly revised 926k in August. This is the highest reading on permits since August 2008 and reflects the ongoing recovery of the housing sector. This strength, however, was more than totally accounted for by increases in permits for structures with 5 or more units. Total permits increased 108k over this two-month period while permits for structures with 5 or more units jumped 111k.
The good and the not-so-good near-term implications of this report: On the positive side, housing starts have historically closely followed permits. So, the September/October jump in permits should be followed by a corresponding rise in starts in the ensuing several months. But the not-so-good news is that the multi-family driver of the September/October rise in permits is very volatile and lumpy, and hence will likely give back some of these gains going forward.
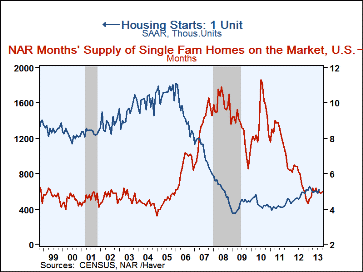
Over the medium term, the outlook for house building continues to be bright. Inventories of unsold homes (measured by months' supply on the market) have returned to levels observed before the housing bust. However, housing starts remain well below the pace observed in the pre-bust period, auguring more catch up ahead.
| Oct | Sep | Aug | Jul | Jun | |
|---|---|---|---|---|---|
| New Pvt Housing Units Authorized by Bldg Permits | 1034 | 974 | 926 | 954 | 918 |
| Housing Units Authorized: 1-Unit Structures | 620 | 615 | 627 | 609 | 625 |
| Housing Units Authorized: Total Multifamily | 414 | 359 | 299 | 345 | 293 |
Sandy Batten
AuthorMore in Author Profile »Sandy Batten has more than 30 years of experience analyzing industrial economies and financial markets and a wide range of experience across the financial services sector, government, and academia. Before joining Haver Analytics, Sandy was a Vice President and Senior Economist at Citibank; Senior Credit Market Analyst at CDC Investment Management, Managing Director at Bear Stearns, and Executive Director at JPMorgan. In 2008, Sandy was named the most accurate US forecaster by the National Association for Business Economics. He is a member of the New York Forecasters Club, NABE, and the American Economic Association. Prior to his time in the financial services sector, Sandy was a Research Officer at the Federal Reserve Bank of St. Louis, Senior Staff Economist on the President’s Council of Economic Advisors, Deputy Assistant Secretary for Economic Policy at the US Treasury, and Economist at the International Monetary Fund. Sandy has taught economics at St. Louis University, Denison University, and Muskingun College. He has published numerous peer-reviewed articles in a wide range of academic publications. He has a B.A. in economics from the University of Richmond and a M.A. and Ph.D. in economics from The Ohio State University.
More Economy in Brief
 Global| Feb 05 2026
Charts of the Week: Balanced Policy, Resilient Data and AI Narratives
by:Andrew Cates


