 Global| Sep 19 2019
U.S. Current Account Deficit Narrows as Income Surplus Increases
Summary
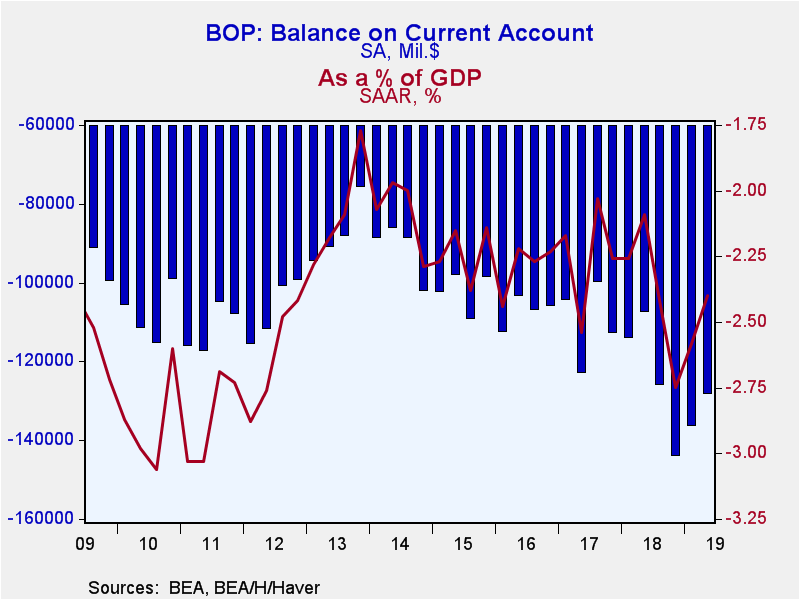
The U.S. current account deficit narrowed to $128.2 billion during Q2'19 from an upwardly-revised $136.2 bil. during Q1'19 (was $130.4 bil.). The Action Economics Forecast Survey anticipated a $127.4 bil. deficit. As a percent of GDP, [...]
The U.S. current account deficit narrowed to $128.2 billion during Q2'19 from an upwardly-revised $136.2 bil. during Q1'19 (was $130.4 bil.). The Action Economics Forecast Survey anticipated a $127.4 bil. deficit. As a percent of GDP, the deficit narrowed to 2.4% from an upwardly-revised 2.6% in Q1 (was 2.5%), and a six-and-a-half year high 2.8% in Q4'2018.
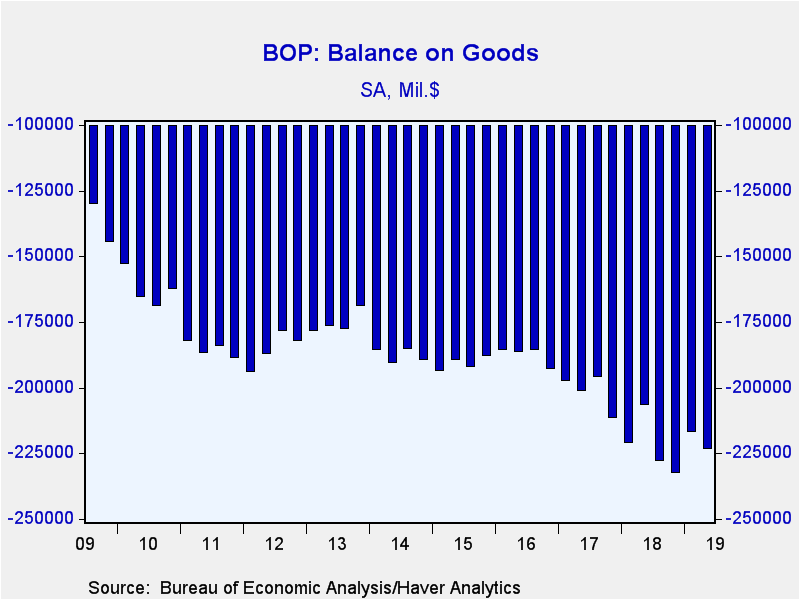
The smaller deficit last quarter was the result of an increase in the income surplus of $14.9 bil. which offset a $6.9 widening of the goods and services deficit. The goods trade deficit increased by $6.6 bil. to $223.3 bil. as exports fell 1.1% (-2.9% y/y) while imports increased 0.3% (0.7% y/y). Almost all categories of goods trade showed widening deficits, led by a $4.8 bil. worsening in the capital goods balance. The biggest improvement came from a $1.3 gain in foods, feeds and beverages, though that category still remains in deficit.
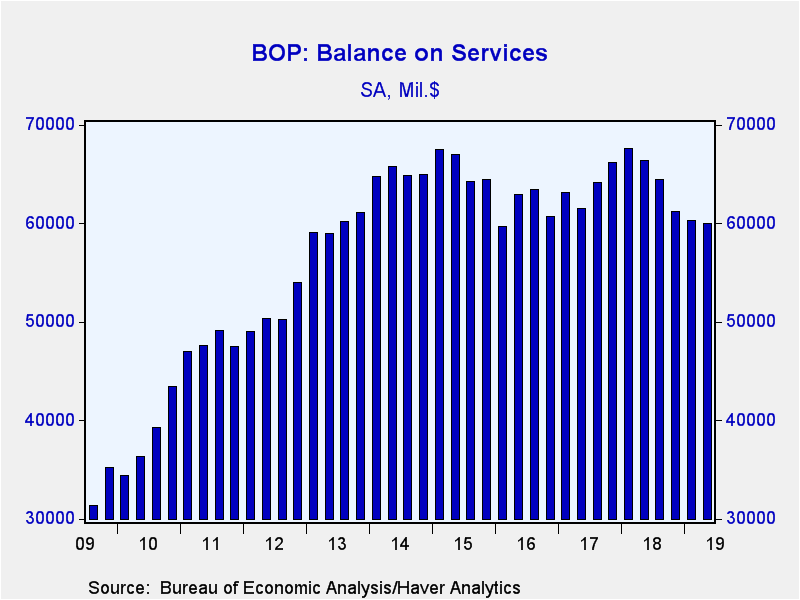
The surplus on services trade edged down to $60.0 bil. from a slightly downwardly revised $60.3 bil. (was $61.9 bil.). Services exports were unchanged in Q2 (+0.8% y/y) while service imports edged up 0.1% (5.8% y/y). Five of the nine services categories showed a worsening trade balance led by a $0.7 bil. decline in travel services. Meanwhile, the transportation services deficit narrowed by $0.7 bil.
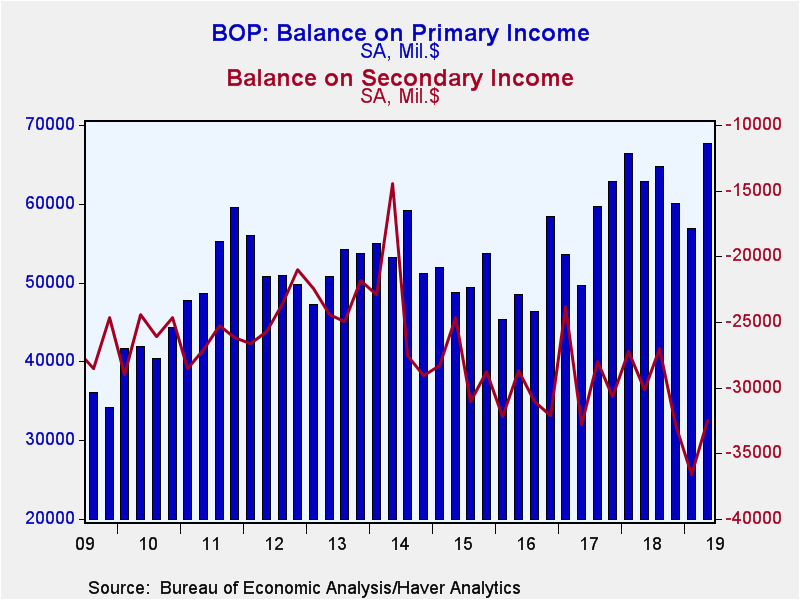
The surplus on primary income increased to a record high $67.6 bil. though as a share of GDP it has hovered around 0.3% since 2012. Despite higher interest rates in the U.S. versus much of the rest of the world, the investment income balance rose to a record $70.8 bil. -- it has also been range-bound around 0.3% of GDP since 2012. The deficit on secondary income narrowed to $32.5 bil. from last quarter's record $36.6 bil.
Balance of Payments data are in Haver's USINT database, with summaries available in USECON. The expectations figure is in the AS1REPNA database.
| US Balance of Payments SA | Q2'19 | Q1'19 | Q4'18 | 2018 | 2017 | 2016 |
|---|---|---|---|---|---|---|
| Current Account Balance ($ Billion) | -128.2 | -136.2 | -143.9 | -491.0 | -439.6 | -428.3 |
| Deficit % of GDP | -2.4 | -2.6 | -2.8 | 2.4 | 2.3 | 2.3 |
| Balance on Goods ($ Billion) | -223.3 | -216.7 | -232.3 | -887.3 | -805.2 | -749.8 |
| Exports (% Chg) | -1.1 | 0.5 | -0.6 | 7.8 | 6.6 | -3.6 |
| Imports (% Chg) | 0.3 | -2.1 | 0.3 | 8.6 | 6.9 | -2.9 |
| Balance on Services ($ Billion) | 60.0 | 60.3 | 61.2 | 259.7 | 255.1 | 246.8 |
| Exports (% Chg) | 0.0 | 0.5 | 0.0 | 3.5 | 5.3 | 0.4 |
| Imports (% Chg) | 0.1 | 1.4 | 2.4 | 4.3 | 6.3 | 4.0 |
| Balance on Primary Income ($ Billion) | 67.6 | 56.9 | 60.1 | 254.0 | 225.8 | 198.7 |
| Balance on Secondary Income ($ Billion) | -32.5 | -36.6 | -32.8 | -117.3 | -115.3 | -124.0 |
Gerald D. Cohen
AuthorMore in Author Profile »Gerald Cohen provides strategic vision and leadership of the translational economic research and policy initiatives at the Kenan Institute of Private Enterprise.
He has worked in both the public and private sectors focusing on the intersection between financial markets and economic fundamentals. He was a Senior Economist at Haver Analytics from January 2019 to February 2021. During the Obama Administration Gerald was Deputy Assistant Secretary for Macroeconomic Analysis at the U.S. Department of Treasury where he helped formulate and evaluate the impact of policy proposals on the U.S. economy. Prior to Treasury, he co-managed a global macro fund at Ziff Brothers Investments.
Gerald holds a bachelor’s of science from the Massachusetts Institute of Technology and a Ph.D. in Economics from Harvard University and is a contributing author to 30-Second Money as well as a co-author of Political Cycles and the Macroeconomy.


