 Global| Mar 19 2020
U.S. Current Account Deficit Narrows in Q4 as Goods Imports Fall More Than Exports
Summary
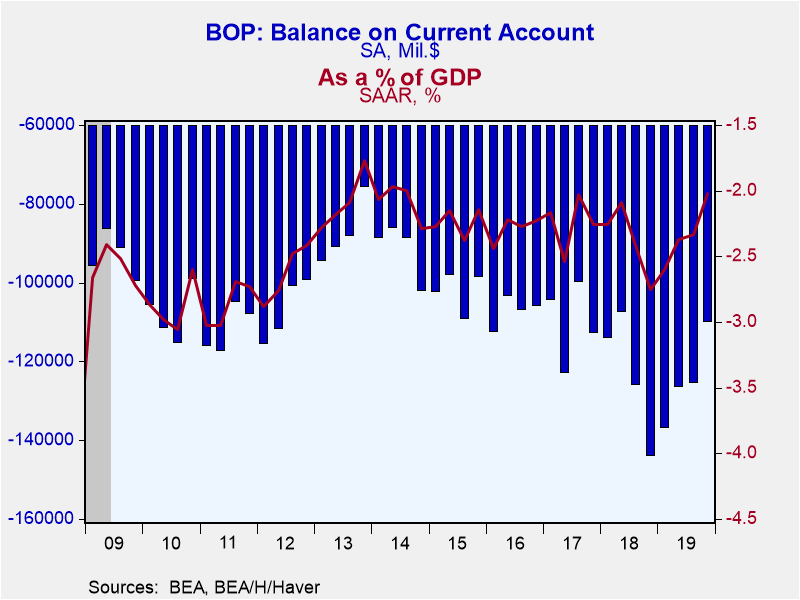
• Current account deficit narrowed to $109.8 billion, led by a decrease in the goods deficit. • Balance on services and income roughly unchanged. The U.S. current account deficit narrowed to $109.8 billion during Q4'19 from an [...]
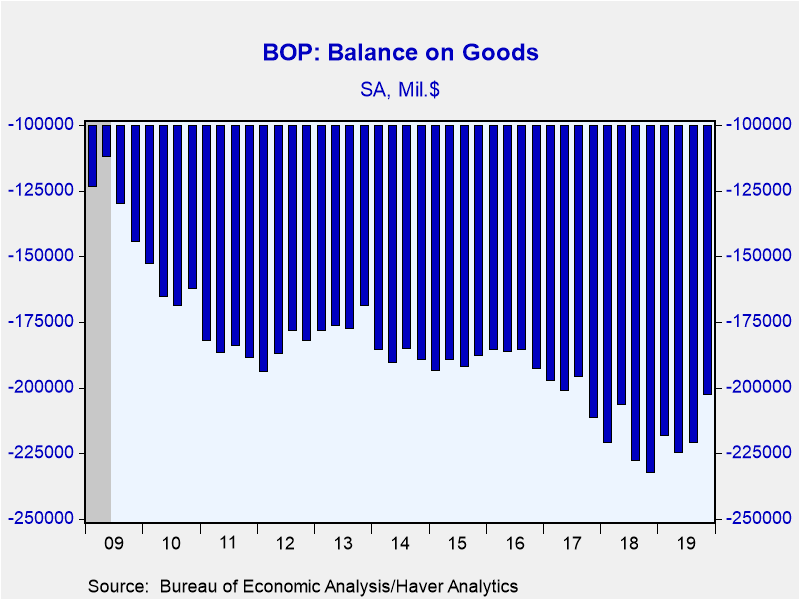
• Current account deficit narrowed to $109.8 billion, led by a decrease in the goods deficit.
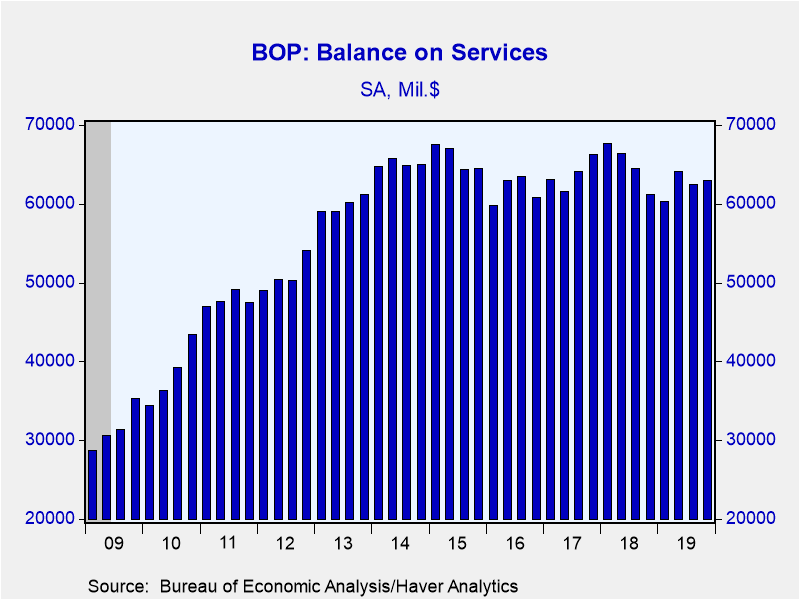
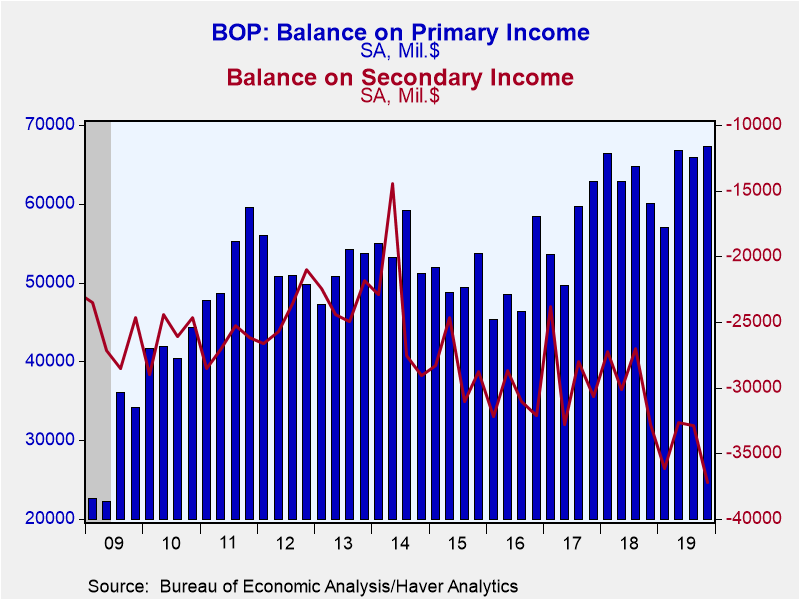
• Balance on services and income roughly unchanged.
The U.S. current account deficit narrowed to $109.8 billion during Q4'19 from an upwardly-revised $125.4 bil. in Q3'19 (was $124.1 bil.). The Action Economics Forecast Survey anticipated a $109 bil. deficit. As a percent of GDP, the deficit declined to 2.0% from an unrevised 2.3% in Q3, and a six-and-a-half year high 2.8% in Q4'2018. This is the smallest deficit as a share of GDP since Q3'2017.
The smaller deficit last quarter was the result of a $18.1 bil. improvement in the goods deficit, with the services surplus growing $0.5 bil., and income deteriorating by $3.0 bil. Goods imports fell more than exports, -3.3% versus -0.6% (-5.7% and -1.7% year-on-year respectively). Four out of the seven major categories of goods trade improved, led by $10.0 and $5.9 bil. gains in the consumer goods and industrial supplies balances. Meanwhile, the food deficit increased by $1.7 bil.
Services exports grew 1.3% while imports rose 1.6% (3.5% and 3.7% respectively). Four of the major services categories improved while five deteriorated.
The surplus on primary income increased to a record high $67.3 bil., though as a share of GDP it has hovered around 0.3% since 2012. Despite higher interest rates in the U.S. versus much of the rest of the world, the investment income balance rose to a record $70.8 bil. -- it has also been range-bound around 0.3% of GDP since 2012. The deficit on secondary income increased to a record $37.3 bil.
Balance of Payments data are in Haver's USINT database, with summaries available in USECON. The expectations figure is in the AS1REPNA database.
| US Balance of Payments SA | Q4'19 | Q3'19 | Q2'19 | 2019 | 2018 | 2017 |
|---|---|---|---|---|---|---|
| Current Account Balance ($ Billion) | -109.8 | -125.4 | -126.3 | -498.4 | -491.0 | -439.6 |
| Deficit % of GDP | -2.0 | -2.3 | -2.4 | -2.3 | -2.4 | -2.3 |
| Balance on Goods ($ Billion) | -202.8 | -220.9 | -224.5 | -866.2 | -887.3 | -805.2 |
| Exports (% Chg) | -0.6 | -0.2 | -1.1 | -1.3 | 7.8 | 6.6 |
| Imports (% Chg) | -3.3 | -0.7 | 0.3 | -1.7 | 8.6 | 6.9 |
| Balance on Services ($ Billion) | 62.9 | 62.5 | 64.1 | 249.8 | 259.7 | 255.1 |
| Exports (% Chg) | 1.3 | -0.5 | 2.1 | 2.2 | 3.5 | 5.3 |
| Imports (% Chg) | 1.6 | 0.4 | 0.4 | 5.0 | 4.3 | 6.3 |
| Balance on Primary Income ($ Billion) | 67.3 | 65.9 | 66.8 | 257.0 | 254.0 | 225.8 |
| Balance on Secondary Income ($ Billion) | -37.3 | -32.9 | -32.6 | -138.9 | -117.3 | -115.3 |
Gerald D. Cohen
AuthorMore in Author Profile »Gerald Cohen provides strategic vision and leadership of the translational economic research and policy initiatives at the Kenan Institute of Private Enterprise.
He has worked in both the public and private sectors focusing on the intersection between financial markets and economic fundamentals. He was a Senior Economist at Haver Analytics from January 2019 to February 2021. During the Obama Administration Gerald was Deputy Assistant Secretary for Macroeconomic Analysis at the U.S. Department of Treasury where he helped formulate and evaluate the impact of policy proposals on the U.S. economy. Prior to Treasury, he co-managed a global macro fund at Ziff Brothers Investments.
Gerald holds a bachelor’s of science from the Massachusetts Institute of Technology and a Ph.D. in Economics from Harvard University and is a contributing author to 30-Second Money as well as a co-author of Political Cycles and the Macroeconomy.


