Global| Feb 25 2008
U.S. Existing Home Sales Slipped & Prices Off More
by:Tom Moeller
|in:Economy in Brief
Summary
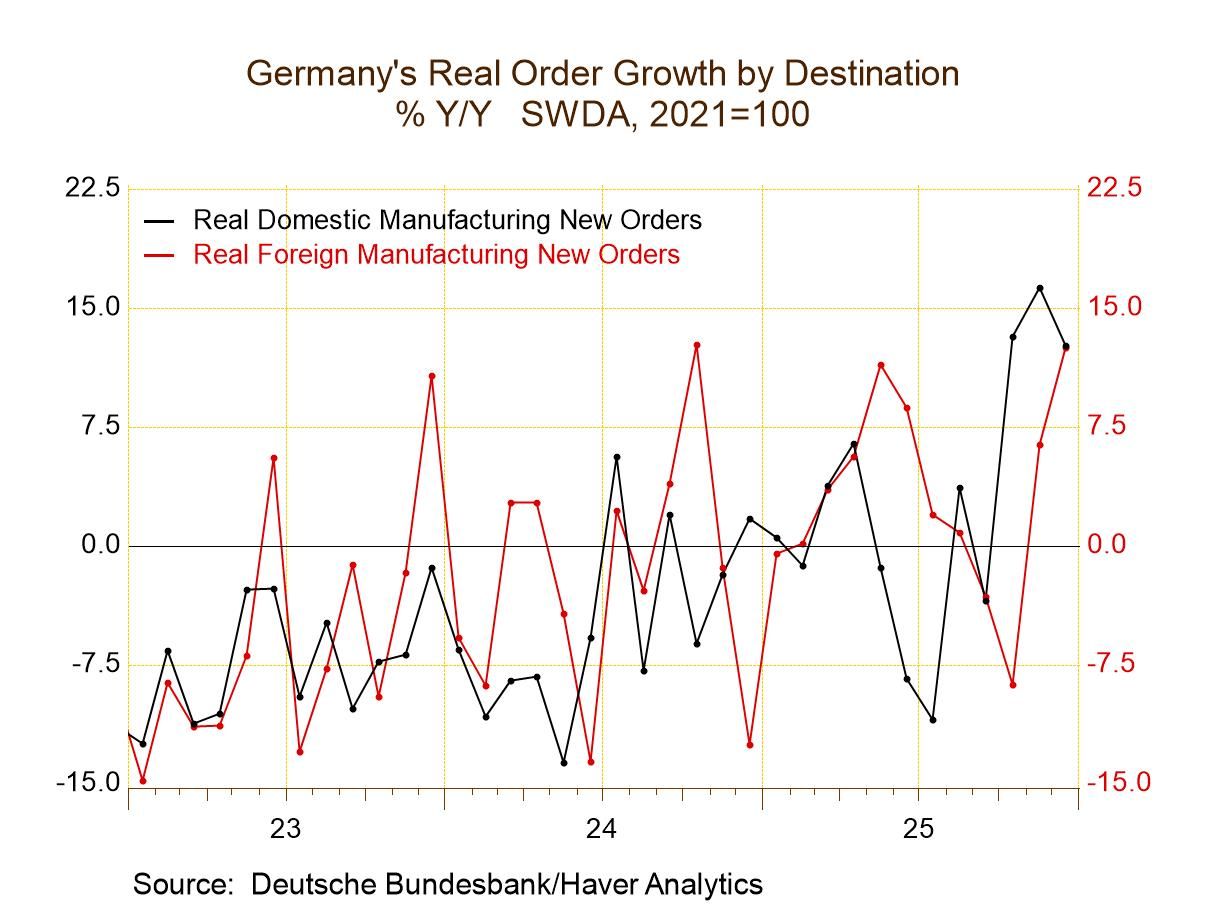
The National Association of Realtors reported that January sales of existing single family homes slipped 0.4% to 4.890M after a 2.2% decline during December. The decline was slightly less than general expectations and new seasonal [...]
The National Association of Realtors reported that January sales of existing single family homes slipped 0.4% to 4.890M after a 2.2% decline during December. The decline was slightly less than general expectations and new seasonal factors revised past data just slightly.
Sales of existing single family homes ticked up 0.5% last month, the first m/m increase in nearly one year.
By region, home sales in the Northeast fell 3.6% (-25.7% y/y). In the Midwest January sales rose 3.4% (-20.0% y/y) and sales in the South also rose 0.6% (-20.9% y/y). Single family homes in the West fell 1.2% (-28.0% y/y) after no change during December.
The median price of an existing single family home fell 2.9% (-4.6% y/y) last month. Home prices were off 12.2% in January from their peak last June.
| Existing
Single Family Home Sales (Thous) |
January | y/y % | December | January '07 | 2007 | 2006 | 2005 |
|---|---|---|---|---|---|---|---|
| Total | 4,890 | -23.4 | 4,910 | 6,380 | 5,672 | 6,508 | 7,076 |
| Northeast | 810 | -25.7 | 840 | 1,090 | 1,008 | 1,090 | 1,168 |
| Midwest | 1,200 | -20.0 | 1,160 | 1,500 | 1,331 | 1,491 | 1,589 |
| South | 1,950 | -22.0 | 1,960 | 2,500 | 2,240 | 2,576 | 2,704 |
| West | 930 | -28.5 | 930 | 1,300 | 1,093 | 1,353 | 1,617 |
| Single-Family | 4,340 | -22.4 | 4,320 | 5,590 | 4,958 | 5,703 | 6,181 |
| Median Price, Total, $ | 201,100 | -4.6 | 207,000 | 210,900 | 216,617 | 222,000 | 218,217 |
by Tom Moeller February 25, 2008
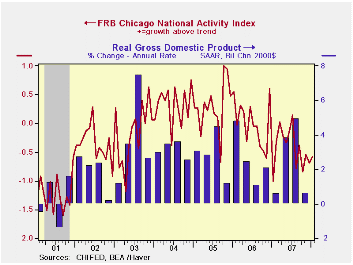
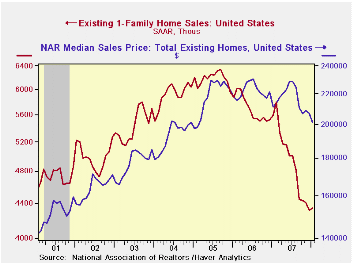
The Federal Reserve Bank of Chicago reported that its January National Activity Index (CFNAI) remained negative, at -0.58. The three month moving average of the index also remained negative at -0.60 which was near the lowest since 2003.
The Bank indicated that the negative value of the three month
moving average suggests low inflationary pressure from economic
activity.
A zero value of the CFNAI indicates that the economy is expanding at its historical trend rate of growth of roughly 3%. During the last twenty years there has been a 68% correlation between the level of the CFNAI and q/q growth in real GDP.
During January, each of the four broad categories of indicators — employment, production, consumption and housing — continued to make negative contributions to the CFNAI.
The CFNAI is a weighted average of 85 indicators of economic activity. The indicators reflect activity in the following categories: production & income, the labor market, personal consumption & housing, manufacturing & trade sales, and inventories & orders.
The complete CFNAI report is available here.
The Globalization of U.S. Business Investment from the Federal Reserve Bank of Dallas is available here.
| Chicago Fed | January | December | January '07 | 2007 | 2006 | 2005 |
|---|---|---|---|---|---|---|
| CFNAI | -0.58 | -0.69 | -1.00 | -0.42 | 0.01 | 0.28 |
by Tom Moeller February 25, 2008
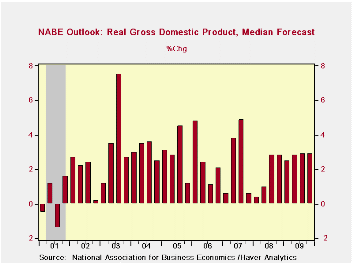
According to the National Association For Business Economists (NABE), the U.S. economy will skirt an economic downturn in 2008. During 1Q08 and 2Q08 growth on average is, however, expected to be the lowest since the end of the last recession in 2001.
Helping the economy to avoid a recession will be further cuts in the Federal funds rate to a low of 2.5% next quarter. There it is expected to remain until yearend.
Yields on the 10 Year Treasury note are expected to bottom at 3.70% this quarter.
The late '08 recovery in quarterly economic growth is expected to be at a moderate, near trend rate of just under 3.0%. For the full year, growth this year 1.8% is forecast to be the weakest since 2001.
The NABE Outlook is available in Haver's SURVEYS database.
Improving Risk Management in Light of Recent Market Events is today's speech by Fed Governor Randall S. Kroszner and it can be found here.
| NABE Forecast | 1Q 08 | 2Q 08 | 3Q 08 | 4Q 08 | 2009 | 2008 | 2007 |
|---|---|---|---|---|---|---|---|
| U.S. Real GDP (%, AR) | 0.4% | 1.0% | 2.8% | 2.8% | 2.9% | 1.8% | 2.5% |
by Louise Curley February 25, 2008
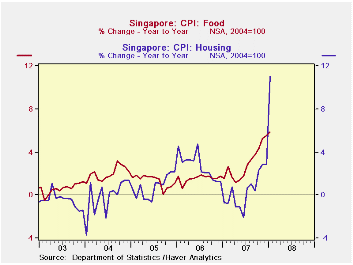
Inflation in Singapore rose more than expected to 6.61% in January of this year, 2.2 percentage points above the 4.41% in December. A big part of the rise was due to the government's increasing the valuation of public housing on which imputed rents are partly based. The housing component rose 11.03% in January after rising only 2.88% in December.
While the jum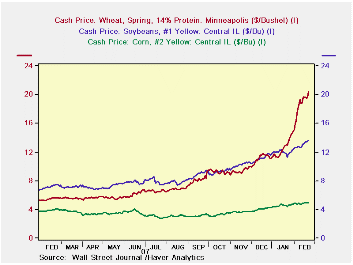 p in
housing cost in December was somewhat of an anomaly, the rise in food
prices has become a regular feature in the cost of living ever since
mid 2007. The first chart shows that, except for the spike in the
housing component in January, the food component has been increasing in
importance relative to the housing component since early 2007.
p in
housing cost in December was somewhat of an anomaly, the rise in food
prices has become a regular feature in the cost of living ever since
mid 2007. The first chart shows that, except for the spike in the
housing component in January, the food component has been increasing in
importance relative to the housing component since early 2007.
World grain prices rises have been pushing up the cost of food. The second chart shows the daily world prices of corn, soybeans and wheat for the past year. The continued rise in these prices in February suggests that further food inflation is in the works, not only for Singapore, but for most other countries.
| INFLATION (Y/Y %Chg in CPI) | Jan 08 | Dec 07 | Nov 07 | Oct 07 | Sep 07 | Jul 07 | Jun 07 | 2007 | 2006 |
|---|---|---|---|---|---|---|---|---|---|
| Singapore | |||||||||
| Total | 6.61 | 4.41 | 422 | 3.63 | 2.76 | 2.96 | 2.56 | 2.10 | 0.96 |
| Food | 5.84 | 5.50 | 5.22 | 4.27 | 2.75 | 3.30 | 2081 | 1.56 | 1.33 |
| Housing | 11.03 | 2.88 | 2.88 | 2.30 | 0.39 | 1.06 | 9.67 | 0.45 | 2.67 |
by Robert Brusca February 25, 2008
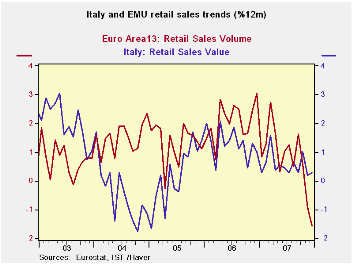
Italy’s retail sales rose in December by a thin 0.1%. The three month advance was at annual rate of 0.4% even below the six month pace of 0.6% and near the Yr/Yr pace of 0.2% - rotten growth rates all. These nominal sales gains clearly imply persisting declines in volume terms. Italy’s nominal retail sales have been in long, slow, declining growth phase.
The chart on the left plots nominal Italy retail sales Vs the EMU volume index for retail sales. The EMU Volume index shows volume plunging at the end of 2007. Italy shows nominal sales steadily eroding with real sales likely falling at an accelerated pace at the end of 2007 since inflation flared at year end as energy prices rose strongly throughout the Euro Area. With the Q4 numbers in, nominal Italian retail sales fell by 0.4% saar in Q4 as food sales advanced by 0.6%. Obviously the Italian consumer is under stress. And that is a theme for the whole of the Euro Area as well.
| Italy Retail Sales Growth | ||||||||
|---|---|---|---|---|---|---|---|---|
| Nominal | Dec-07 | Nov-07 | Oct-07 | 3-MO | 6-MO | 12-MO | YrAgo | Q-2-Date |
| Retail Trade | 0.1% | -0.3% | 0.3% | 0.4% | 0.6% | 0.3% | 1.0% | -0.4% |
| Food, Beverages & Tobacco | 0.1% | -0.1% | 0.3% | 1.4% | 1.5% | 1.0% | 1.3% | 0.6% |
| Clothing & Fur | 0.5% | -2.0% | 2.1% | 2.3% | -0.4% | -0.9% | 1.6% | -2.2% |

Tom Moeller
AuthorMore in Author Profile »Prior to joining Haver Analytics in 2000, Mr. Moeller worked as the Economist at Chancellor Capital Management from 1985 to 1999. There, he developed comprehensive economic forecasts and interpreted economic data for equity and fixed income portfolio managers. Also at Chancellor, Mr. Moeller worked as an equity analyst and was responsible for researching and rating companies in the economically sensitive automobile and housing industries for investment in Chancellor’s equity portfolio. Prior to joining Chancellor, Mr. Moeller was an Economist at Citibank from 1979 to 1984. He also analyzed pricing behavior in the metals industry for the Council on Wage and Price Stability in Washington, D.C. In 1999, Mr. Moeller received the award for most accurate forecast from the Forecasters' Club of New York. From 1990 to 1992 he was President of the New York Association for Business Economists. Mr. Moeller earned an M.B.A. in Finance from Fordham University, where he graduated in 1987. He holds a Bachelor of Arts in Economics from George Washington University.
More Economy in Brief
 Global| Feb 05 2026
Charts of the Week: Balanced Policy, Resilient Data and AI Narratives
by:Andrew Cates