 Global| Aug 27 2019
U.S. FHFA House Price Appreciation Continues to Slow
Summary
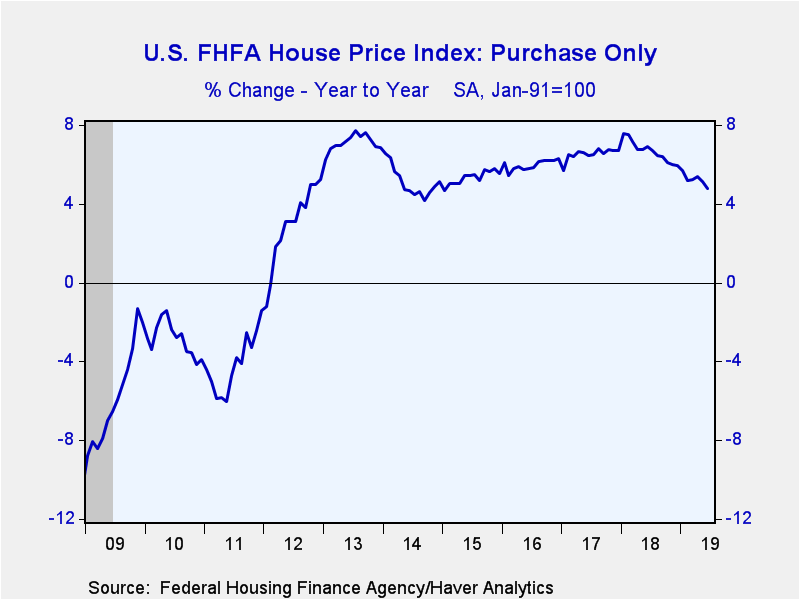
The Federal Housing Finance Agency (FHFA) Price Index edged up 0.1% in June, following a 0.2% increase in May. Over the last year, home prices are up 4.8%, the slowest rate of increase and the first time home price appreciation has [...]
The Federal Housing Finance Agency (FHFA) Price Index edged up 0.1% in June, following a 0.2% increase in May. Over the last year, home prices are up 4.8%, the slowest rate of increase and the first time home price appreciation has been below 5.0% year-on-year since late 2014. Over the last six months, prices have increased at a 4.0% annual rate. Based on this measure, home prices are up 21.9% from their 2007 peak. Adjusted for consumer price inflation, home prices are unchanged from 2006-07 levels.
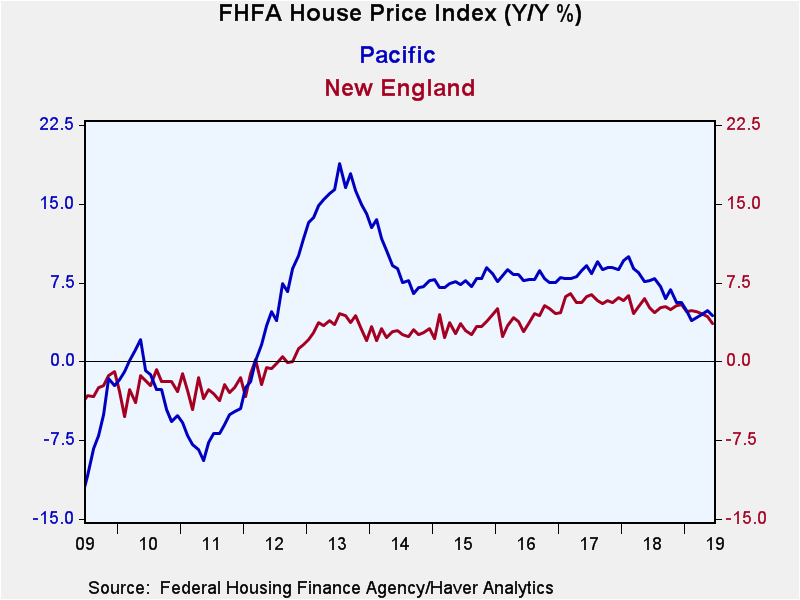
Home prices increased month-on-month in five of the nine census divisions, with price increases ranging from 0.1% in the West North Central and Mountain regions (4.5% and 5.7% year-on-year respectively) to 1.0% in the West South Central (4.8% y/y). Prices were unchanged in the South Atlantic region (5.6% y/y), while they fell in three regions, ranging between the East North Central, which was down 0.1% (+4.9% y/y) and New England -0.6% (+3.6% y/y).
The FHFA house price index is a weighted purchase-only index that measures average price changes in repeat sales of the same property. An associated quarterly index includes refinancings on the same kinds of properties. The indexes are based on transactions involving conforming, conventional mortgages purchased or securitized by Fannie Mae or Freddie Mac. Only mortgage transactions on single-family properties are included. The FHFA data are available in Haver's USECON database.
| FHFA U.S. House Price Index, Purchase Only (SA %) |
Jun | May | Apr | Jun Y/Y | 2018 | 2017 | 2016 |
|---|---|---|---|---|---|---|---|
| Total | 0.1 | 0.2 | 0.4 | 4.8 | 6.7 | 6.5 | 6.0 |
| New England | -0.6 | 0.2 | 0.5 | 3.6 | 5.3 | 5.8 | 4.1 |
| Middle Atlantic | -0.3 | 0.5 | 0.0 | 3.5 | 5.5 | 4.8 | 3.6 |
| East North Central | -0.1 | 0.4 | 0.5 | 4.9 | 6.5 | 6.0 | 5.2 |
| West North Central | 0.1 | 0.3 | -0.3 | 4.5 | 6.2 | 5.3 | 5.5 |
| South Atlantic | 0.0 | 0.4 | 0.3 | 5.6 | 7.3 | 6.7 | 6.8 |
| East South Central | 0.6 | -0.9 | 1.0 | 4.7 | 6.2 | 5.7 | 5.0 |
| West South Central | 1.0 | -0.4 | 0.4 | 4.8 | 5.4 | 6.4 | 5.6 |
| Mountain | 0.1 | -0.3 | 1.3 | 5.7 | 9.2 | 8.6 | 7.8 |
| Pacific | 0.3 | 0.4 | 0.6 | 4.3 | 7.6 | 8.6 | 8.0 |
New England: Maine, New Hampshire, Vermont,
Massachusetts, Rhode Island and Connecticut.
Middle Atlantic: New York, New Jersey and Pennsylvania.
5East North Central: Michigan, Wisconsin, Illinois, Indiana and Ohio.
West North Central: North Dakota, South Dakota, Minnesota, Nebraska,
Iowa, Kansas and Missouri.
South Atlantic: Delaware, Maryland, D.C., Virginia, West Virginia,
North Carolina, South Carolina, Georgia and Florida.
East South Central: Kentucky, Tennessee, Mississippi and Alabama.
West South Central: Oklahoma, Arkansas, Texas and Louisiana.
Mountain: Montana, Idaho, Wyoming, Nevada, Utah, Colorado, Arizona and
New Mexico.
Pacific: Alaska, California, Hawaii, Oregon, Washington.
Gerald D. Cohen
AuthorMore in Author Profile »Gerald Cohen provides strategic vision and leadership of the translational economic research and policy initiatives at the Kenan Institute of Private Enterprise.
He has worked in both the public and private sectors focusing on the intersection between financial markets and economic fundamentals. He was a Senior Economist at Haver Analytics from January 2019 to February 2021. During the Obama Administration Gerald was Deputy Assistant Secretary for Macroeconomic Analysis at the U.S. Department of Treasury where he helped formulate and evaluate the impact of policy proposals on the U.S. economy. Prior to Treasury, he co-managed a global macro fund at Ziff Brothers Investments.
Gerald holds a bachelor’s of science from the Massachusetts Institute of Technology and a Ph.D. in Economics from Harvard University and is a contributing author to 30-Second Money as well as a co-author of Political Cycles and the Macroeconomy.
More Economy in Brief
 Global| Feb 05 2026
Charts of the Week: Balanced Policy, Resilient Data and AI Narratives
by:Andrew Cates


