 Global| Sep 10 2019
U.S. Gasoline Prices Fall Further While Crude and Nat Gas Prices Rise
by:Sandy Batten
|in:Economy in Brief
Summary
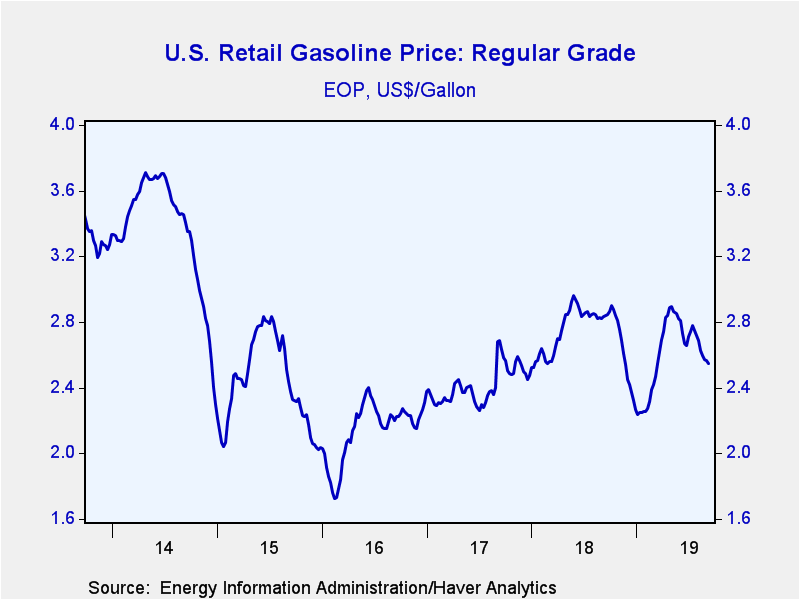
The U.S. pump price for gasoline slipped to $2.55 per gallon (-10.0% y/y) in the week ended September 9 from the prior week's $2.56 per gallon. Prices have fallen for eight consecutive weeks. Haver Analytics adjusts price figures for [...]
The U.S. pump price for gasoline slipped to $2.55 per gallon (-10.0% y/y) in the week ended September 9 from the prior week's $2.56 per gallon. Prices have fallen for eight consecutive weeks. Haver Analytics adjusts price figures for seasonal variation. The seasonally adjusted price fell to $2.41 per gallon from $2.44 in the previous week. This was the lowest seasonally adjusted price since January 7.
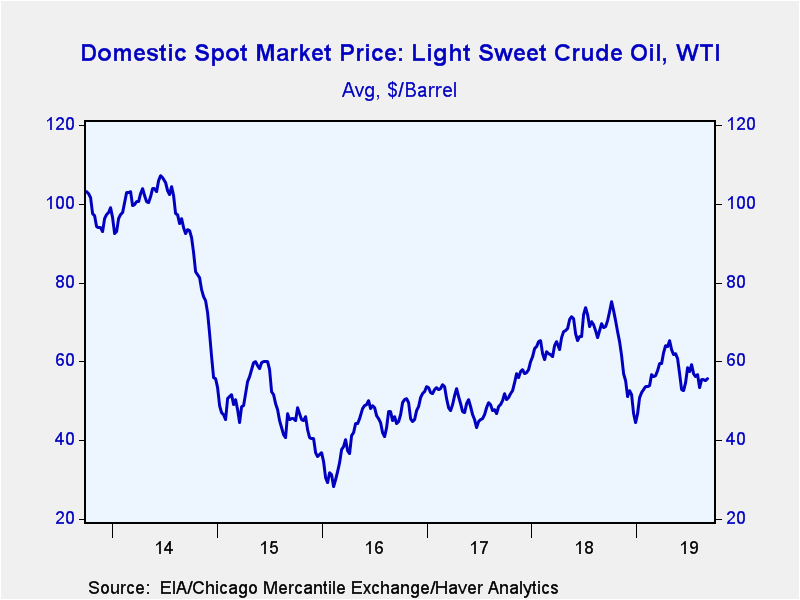
The price of West Texas Intermediate crude oil rose to $55.74 per barrel (-18.7% y/y) in the week ended September 6 from $55.22 the previous week. Prices have been relatively steady over the past few weeks but remain well below the recent peak of $65.26 reached in April. Yesterday, the price of WTI jumped up to $57.85 per barrel from $56.52 on Friday. The price of Brent crude oil rebounded in the week ended September 6, rising to $60.00 per barrel (-22.4% y/y) from $59.68 in the previous week. Yesterday, the price rose to $62.63 per barrel, its highest since July 31, from $61.64.
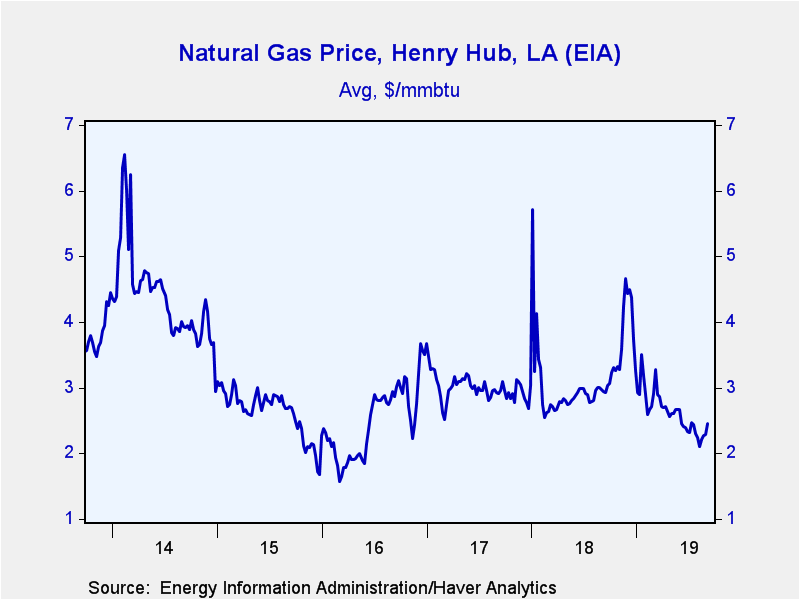
The price of natural gas jumped up to $2.46 per mmbtu (-16.3% y/y) in the week ended September 6 from $2.28/mmbtu in the previous week. This was the fourth consecutive weekly increase and the largest weekly rise since March 8.
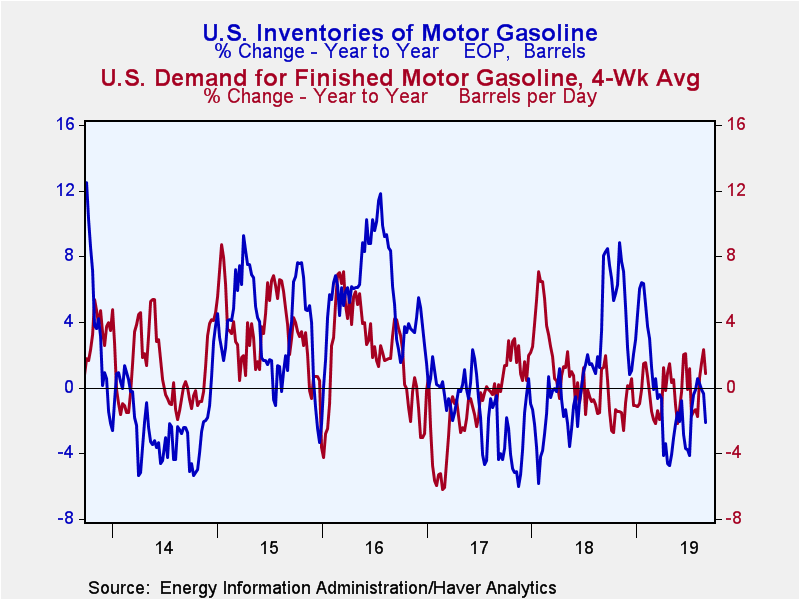
For the four-weeks ending August 30, U.S. gasoline demand increased 0.8% y/y, the fourth consecutive yearly gain but down from 2.3% y/y the previous week. Total petroleum product demand rose 1.6% y/y. In the week ended August 30, U.S. gasoline inventories fell 2.1% y/y while inventories of all petroleum products increased 3.0% y/y. Crude oil input to U.S. refineries fell 1.8% y/y.
These data are reported by the U.S. Department of Energy. The price data can be found in Haver's WEEKLY and DAILY databases. More detail on prices, demand, production and inventories, including regional breakdowns, are in OILWKLY.
| Weekly Energy Prices | 9/9/2019 | 9/2/2019 | 8/26/2019 | Y/Y % | 2018 | 2017 | 2016 |
|---|---|---|---|---|---|---|---|
| Retail Gasoline ($ per Gallon Regular, Monday Price, End of Period) | 2.55 | 2.56 | 2.57 | -10.0 | 2.27 | 2.47 | 2.31 |
| Light Sweet Crude Oil, WTI ($ per bbl, Previous Week's Average) | 55.74 | 55.22 | 55.51 | -18.7 | 64.95 | 50.87 | 43.22 |
| Natural Gas ($/mmbtu, LA, Previous Week's Average) | 2.46 | 2.28 | 2.27 | -16.3 | 3.18 | 2.99 | 2.51 |
Sandy Batten
AuthorMore in Author Profile »Sandy Batten has more than 30 years of experience analyzing industrial economies and financial markets and a wide range of experience across the financial services sector, government, and academia. Before joining Haver Analytics, Sandy was a Vice President and Senior Economist at Citibank; Senior Credit Market Analyst at CDC Investment Management, Managing Director at Bear Stearns, and Executive Director at JPMorgan. In 2008, Sandy was named the most accurate US forecaster by the National Association for Business Economics. He is a member of the New York Forecasters Club, NABE, and the American Economic Association. Prior to his time in the financial services sector, Sandy was a Research Officer at the Federal Reserve Bank of St. Louis, Senior Staff Economist on the President’s Council of Economic Advisors, Deputy Assistant Secretary for Economic Policy at the US Treasury, and Economist at the International Monetary Fund. Sandy has taught economics at St. Louis University, Denison University, and Muskingun College. He has published numerous peer-reviewed articles in a wide range of academic publications. He has a B.A. in economics from the University of Richmond and a M.A. and Ph.D. in economics from The Ohio State University.


