 Global| Mar 17 2020
U.S. Home Builder Sentiment Eases Again in March
by:Sandy Batten
|in:Economy in Brief
Summary
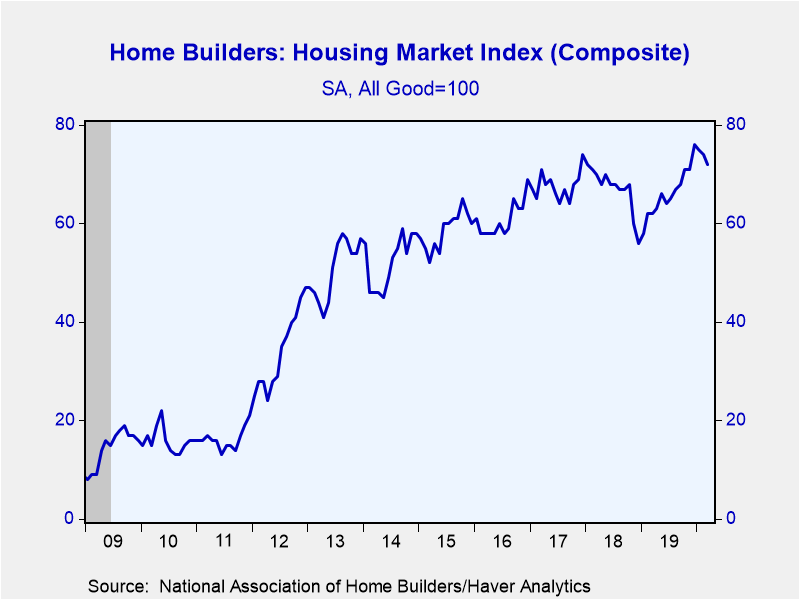
The Composite Housing Market Index from the National Association of Home Builders-Wells Fargo fell 2.7% m/m to 72 in March from 74 in February for the third consecutive monthly decline. Still, the index is up 16.1% from a year ago and [...]
The Composite Housing Market Index from the National Association of Home Builders-Wells Fargo fell 2.7% m/m to 72 in March from 74 in February for the third consecutive monthly decline. Still, the index is up 16.1% from a year ago and continues to fluctuate near its highest level in two decades. A reading of 73 had been expected in the INFORMA Global Markets survey. The NAHB figures are seasonally adjusted. Over the past 15 years, there has been a 70% correlation between the y/y change in the home builders index and the y/y change in new plus existing home sales.
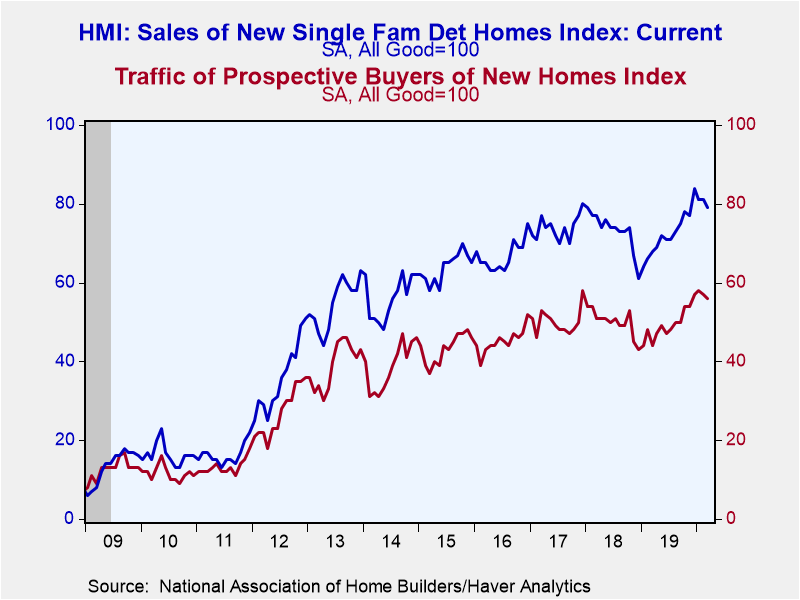
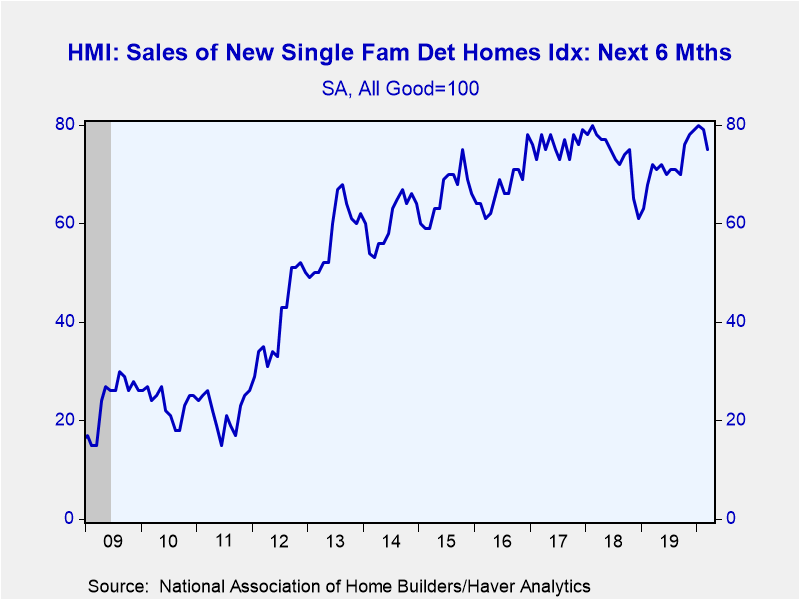
The index of present sales conditions declined 2.5% m/m to 79 (+16.2% y/y). The index of expected conditions in the next six months fell 5.1% m/m to 75 (+4.2% y/y), its lowest reading since September. The index measuring traffic of prospective buyers slipped 1.8% m/m to 56 (+27.3% y/y), its second consecutive modest decline from January’s expansion high of 58.
It should be noted that half of the builder responses in the March index were collected prior to March 4, so the recent stock market declines and the rising economic impact of the coronavirus will likely be reflected more in next month’s report. Overall, 21% of builders in the survey reported some disruption in supply due to virus concerns in other countries, notably China. However, the incidence is higher (33%) among builders who responded to the survey after March 6, indicating that this is still an emerging issue.
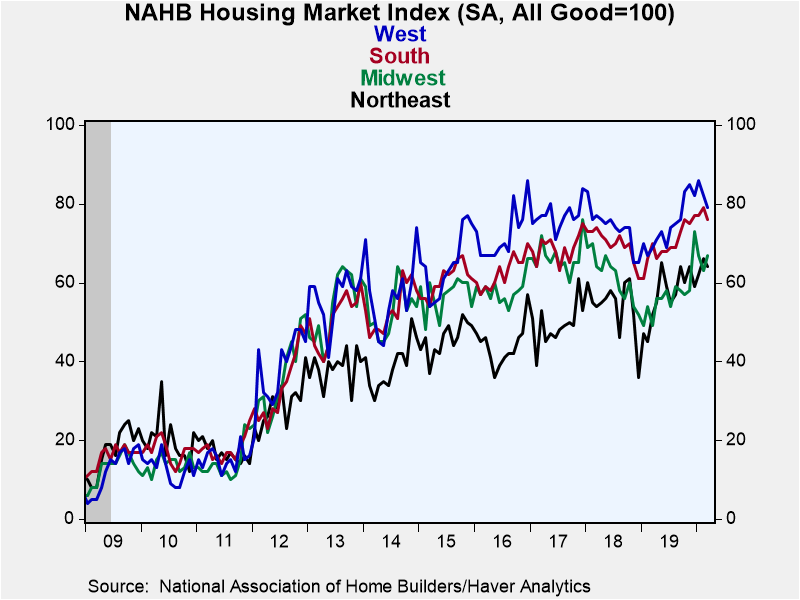
Regional readings were generally lower in March. The index for the Northeast fell 3.0% m/m to 64. The index for the South declined 3.8% m/m to 76. And the index for the West decreased 3.7% m/m to 79. In contrast, the index for the Midwest increased a solid 6.3% m/m to 67, offsetting a similar decline in February.
The NAHB has compiled the Housing Market Index since 1985. It reflects survey questions which ask builders to rate sales and sales expectations as "good," "fair" or "poor" and traffic as "very high," "average" or "very low." The figures are diffusion indexes with values over 50 indicating a predominance of "good"/"very high" readings. In constructing the composite index, the weights assigned to the individual index components are: 0.5920 for single-family detached sales, present time, 0.1358 for single-family detached sales, next six months, and 0.2722 for traffic of prospective buyers. These data are included in Haver's SURVEYS database.
| National Association of Home Builders | Mar | Feb | Jan | Mar Y/Y | 2019 | 2018 | 2017 |
|---|---|---|---|---|---|---|---|
| Composite Housing Market Index, SA (All Good=100) | 72 | 74 | 75 | 16.1% | 66 | 67 | 68 |
| Single-Family Sales: Present | 79 | 81 | 81 | 16.2% | 72 | 73 | 74 |
| Single-Family Sales: Next Six Months | 75 | 79 | 80 | 4.2% | 72 | 74 | 76 |
| Traffic of Prospective Buyers | 56 | 57 | 58 | 27.3% | 49 | 50 | 50 |
Sandy Batten
AuthorMore in Author Profile »Sandy Batten has more than 30 years of experience analyzing industrial economies and financial markets and a wide range of experience across the financial services sector, government, and academia. Before joining Haver Analytics, Sandy was a Vice President and Senior Economist at Citibank; Senior Credit Market Analyst at CDC Investment Management, Managing Director at Bear Stearns, and Executive Director at JPMorgan. In 2008, Sandy was named the most accurate US forecaster by the National Association for Business Economics. He is a member of the New York Forecasters Club, NABE, and the American Economic Association. Prior to his time in the financial services sector, Sandy was a Research Officer at the Federal Reserve Bank of St. Louis, Senior Staff Economist on the President’s Council of Economic Advisors, Deputy Assistant Secretary for Economic Policy at the US Treasury, and Economist at the International Monetary Fund. Sandy has taught economics at St. Louis University, Denison University, and Muskingun College. He has published numerous peer-reviewed articles in a wide range of academic publications. He has a B.A. in economics from the University of Richmond and a M.A. and Ph.D. in economics from The Ohio State University.
More Economy in Brief
 Global| Feb 05 2026
Charts of the Week: Balanced Policy, Resilient Data and AI Narratives
by:Andrew Cates


