 Global| Jul 16 2019
U.S. Home Builder Sentiment Edges Up in July
by:Sandy Batten
|in:Economy in Brief
Summary
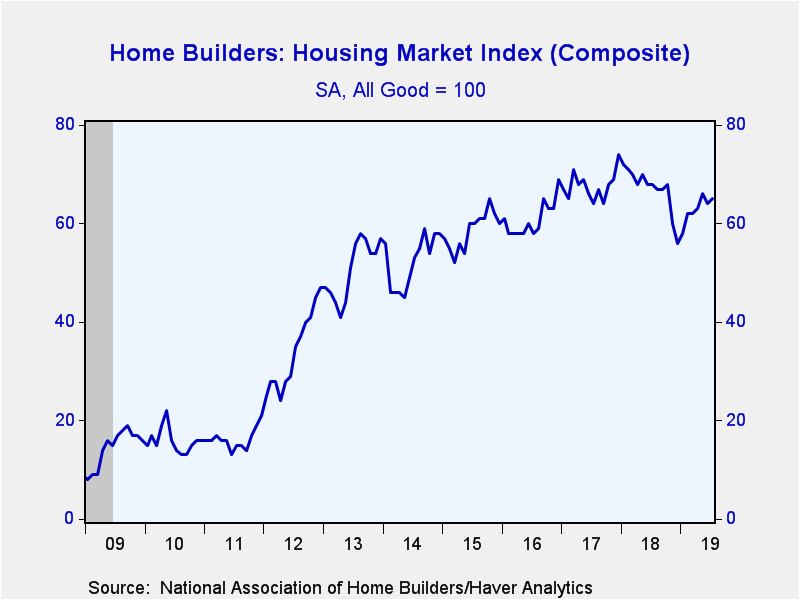
The Composite Housing Market Index from the National Association of Home Builders-Wells Fargo edged up to 65 in July from 64 in June, reversing half of its June decline. Compared with a year ago, the index is 3 points lower and [...]
The Composite Housing Market Index from the National Association of Home Builders-Wells Fargo edged up to 65 in July from 64 in June, reversing half of its June decline. Compared with a year ago, the index is 3 points lower and remains below the expansion high of 74 reached in December of 2017. The NAHB figures are seasonally adjusted. During the last ten years, there has been a 65% correlation between the y/y change in the home builders index and the y/y change in new plus existing home sales.
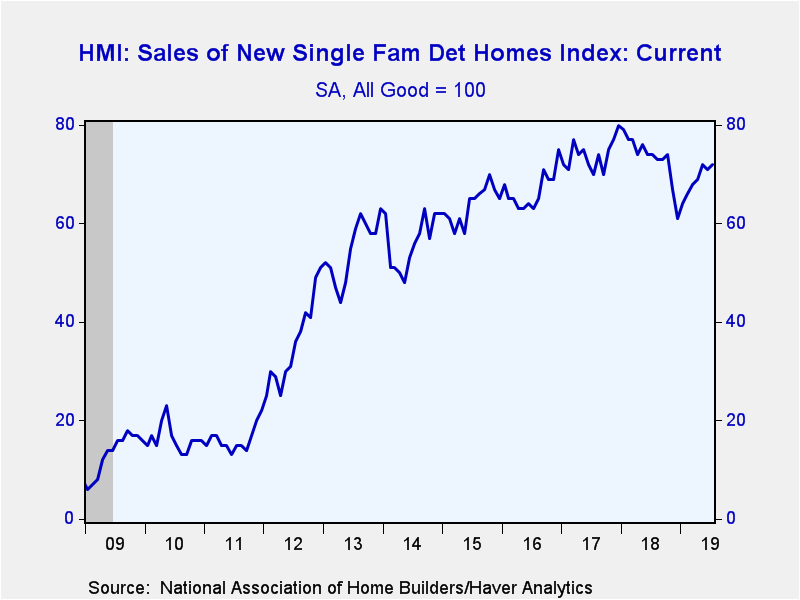
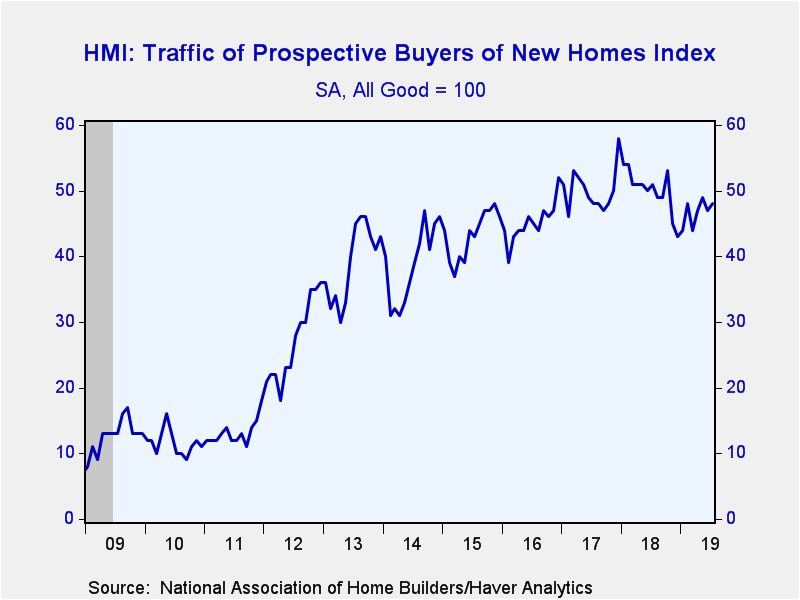
Each of the index components edged up this month. The index of present sales conditions rose to 72 from 71 in June. The index of expected conditions in the next six months inched up to 71 from 70 in June. The index measuring traffic of prospective buyers increased slightly to 48 from 47.
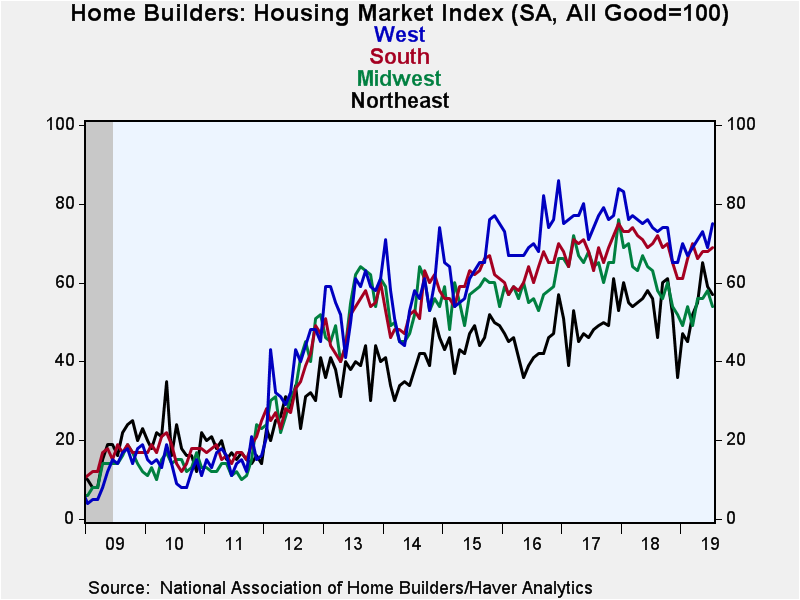
Regional readings were generally weak with declines in both the Northeast and the Midwest and only a modest one-point rise in the South. In contrast, the index for the West posted a sharp six-point rise to 75, its highest reading since June 2018.
The NAHB has compiled the Housing Market Index since 1985. It reflects survey questions asking builders to rate market conditions as "good," "fair," "poor" or "very high" to "very low." The figure is a diffusion index with numerical results over 50 indicating a predominance of "good" readings. The weights assigned to the individual index components are 0.5920 for single-family detached sales, present time, 0.1358 for single-family detached sales, next months and 0.2722 for traffic of prospective buyers. The results are included in Haver's SURVEYS database.
| National Association of Home Builders | Jul | Jun | May | Jul'18 | 2018 | 2017 | 2016 |
|---|---|---|---|---|---|---|---|
| Composite Housing Market Index, SA (All Good=100) | 65 | 64 | 66 | 68 | 67 | 68 | 61 |
| Single-Family Sales: Present | 72 | 71 | 72 | 74 | 73 | 74 | 67 |
| Single-Family Sales: Next Six Months | 71 | 70 | 72 | 73 | 74 | 76 | 67 |
| Traffic of Prospective Buyers | 48 | 47 | 49 | 51 | 50 | 50 | 45 |
Sandy Batten
AuthorMore in Author Profile »Sandy Batten has more than 30 years of experience analyzing industrial economies and financial markets and a wide range of experience across the financial services sector, government, and academia. Before joining Haver Analytics, Sandy was a Vice President and Senior Economist at Citibank; Senior Credit Market Analyst at CDC Investment Management, Managing Director at Bear Stearns, and Executive Director at JPMorgan. In 2008, Sandy was named the most accurate US forecaster by the National Association for Business Economics. He is a member of the New York Forecasters Club, NABE, and the American Economic Association. Prior to his time in the financial services sector, Sandy was a Research Officer at the Federal Reserve Bank of St. Louis, Senior Staff Economist on the President’s Council of Economic Advisors, Deputy Assistant Secretary for Economic Policy at the US Treasury, and Economist at the International Monetary Fund. Sandy has taught economics at St. Louis University, Denison University, and Muskingun College. He has published numerous peer-reviewed articles in a wide range of academic publications. He has a B.A. in economics from the University of Richmond and a M.A. and Ph.D. in economics from The Ohio State University.
More Economy in Brief
 Global| Feb 05 2026
Charts of the Week: Balanced Policy, Resilient Data and AI Narratives
by:Andrew Cates


