 Global| Jul 16 2019
U.S. Import and Export Prices Decline in June
by:Sandy Batten
|in:Economy in Brief
Summary
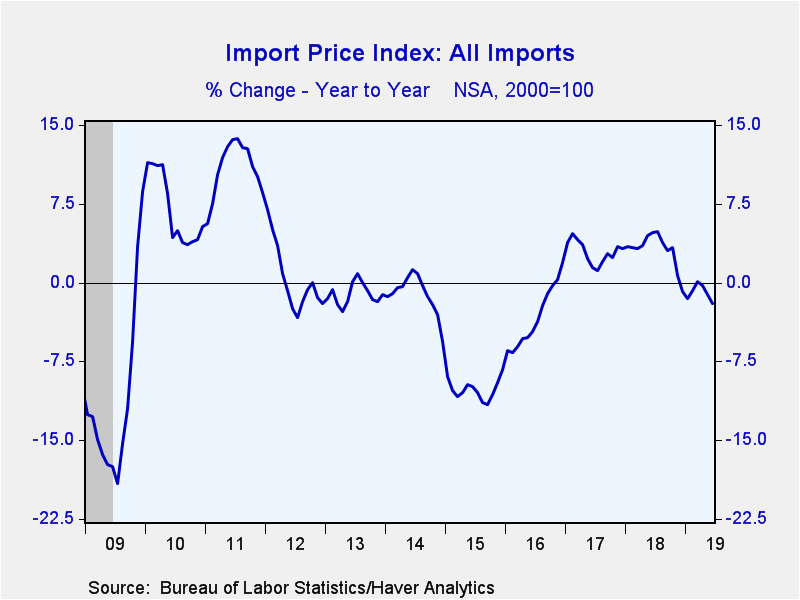
Import prices fell 0.9% (-2.0% y/y) in June following an upwardly revised unchanged reading in May (initially reported as a 0.3% m/m decline). The June decline was larger than the 0.6% m/m decline expected in the Action Economics [...]
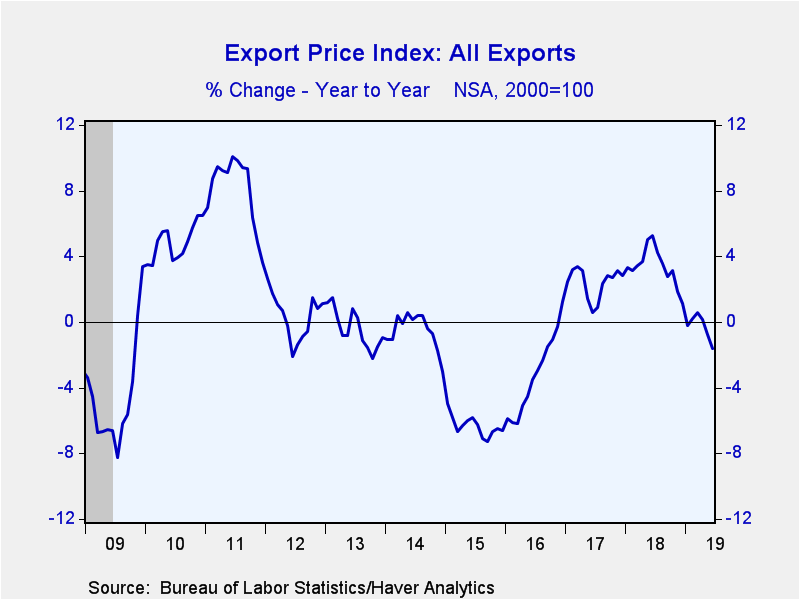
Import prices fell 0.9% (-2.0% y/y) in June following an upwardly revised unchanged reading in May (initially reported as a 0.3% m/m decline). The June decline was larger than the 0.6% m/m decline expected in the Action Economics Forecast Survey. These figures are not seasonally adjusted and do not include import duties. Export prices also fell in June, declining 0.7% m/m (-1.6% y/y) after an unrevised 0.2% m/m decline in May. The Action Economics survey consensus had looked for only a 0.2% m/m decline.
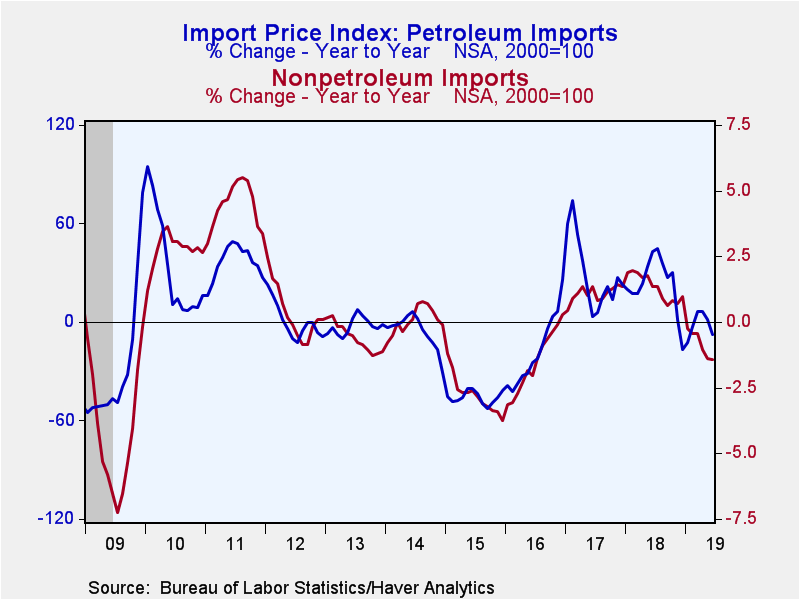
The weakening in import prices last month mostly reflected a 6.2% drop (-7.4% y/y) in petroleum import costs, following sizable increases in each of the previous five months. Nonpetroleum import prices also fell in June but only by 0.4% m/m (-1.4% y/y). This was the third consecutive monthly decline in nonpetroleum import prices and was widely spread across end-use categories. Of note, prices of imported foods, feeds and beverages slumped 1.5% m/m while prices of imported industrial supplies declined 3.3% m/m.
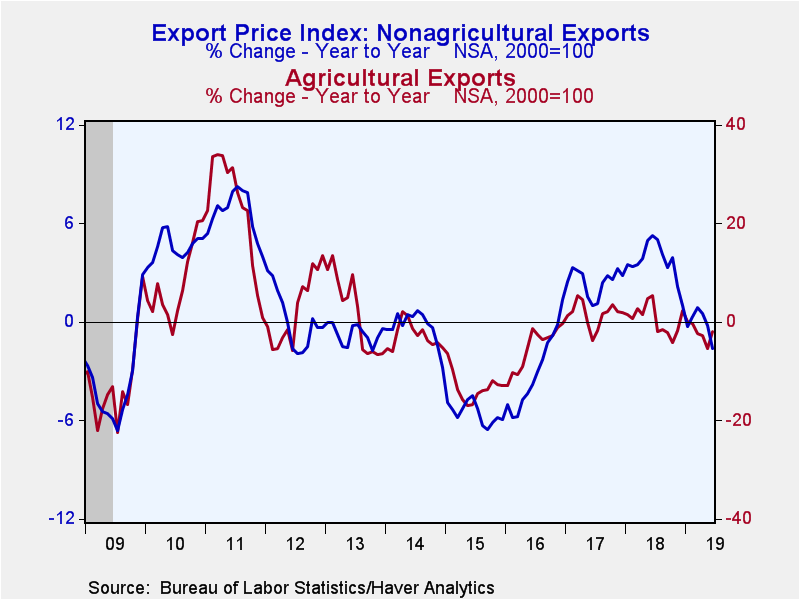
The weakening of export prices in June was due solely to declines in prices of exported nonagricultural commodities, which fell 1.1% m/m (-1.6% y/y). This decline was concentrated in prices of exported industrial supplies, which slumped 3.0% m/m. In contrast, prices of exported food, feeds beverages jumped up 3.0% m/m. Prices in all other major end-use categories only edged up in June from May. Prices of exported agricultural commodities rose 2.7% m/m (-1.9% y/y) in June but not enough to offset the fall in nonagricultural prices. This was led by a 13.5% m/m surge in corn prices and a 5.0% m/m jump in soybean prices.
The import and export price series can be found in Haver's USECON database. Detailed figures are available in the USINT database. The expectations figure from the Action Economics Forecast Survey is in the AS1REPNA database.
| Import/Export Prices (NSA, %) | Jun | May | Apr | Jun Y/Y | 2018 | 2017 | 2016 |
|---|---|---|---|---|---|---|---|
| Imports - All Commodities | -0.9 | 0.0 | 0.2 | -2.0 | 3.1 | 2.9 | -3.3 |
| Petroleum & Petroleum Products | -6.2 | 2.4 | 4.6 | -7.4 | 22.0 | 26.6 | -19.7 |
| Nonpetroleum | -0.4 | -0.3 | -0.5 | -1.4 | 1.3 | 1.1 | -1.5 |
| Exports - All Commodities | -0.7 | -0.2 | 0.1 | -1.6 | 3.4 | 2.4 | -3.2 |
| Agricultural | 2.7 | -1.1 | -1.5 | -1.9 | 0.6 | 1.5 | -5.4 |
| Nonagricultural | -1.1 | -0.2 | 0.2 | -1.6 | 3.7 | 2.5 | -3.0 |
Sandy Batten
AuthorMore in Author Profile »Sandy Batten has more than 30 years of experience analyzing industrial economies and financial markets and a wide range of experience across the financial services sector, government, and academia. Before joining Haver Analytics, Sandy was a Vice President and Senior Economist at Citibank; Senior Credit Market Analyst at CDC Investment Management, Managing Director at Bear Stearns, and Executive Director at JPMorgan. In 2008, Sandy was named the most accurate US forecaster by the National Association for Business Economics. He is a member of the New York Forecasters Club, NABE, and the American Economic Association. Prior to his time in the financial services sector, Sandy was a Research Officer at the Federal Reserve Bank of St. Louis, Senior Staff Economist on the President’s Council of Economic Advisors, Deputy Assistant Secretary for Economic Policy at the US Treasury, and Economist at the International Monetary Fund. Sandy has taught economics at St. Louis University, Denison University, and Muskingun College. He has published numerous peer-reviewed articles in a wide range of academic publications. He has a B.A. in economics from the University of Richmond and a M.A. and Ph.D. in economics from The Ohio State University.


