 Global| Jul 25 2019
U.S. Initial Claims for Unemployment Insurance Zigzag Lower
Summary
Initial claims for unemployment insurance decreased 10,000 to 206,000 (-5.1% year-on-year) during the week ending July 20 from an unrevised 216,000. Two weeks ago, claims dropped to 208,000, though it included the July 4th holiday [...]
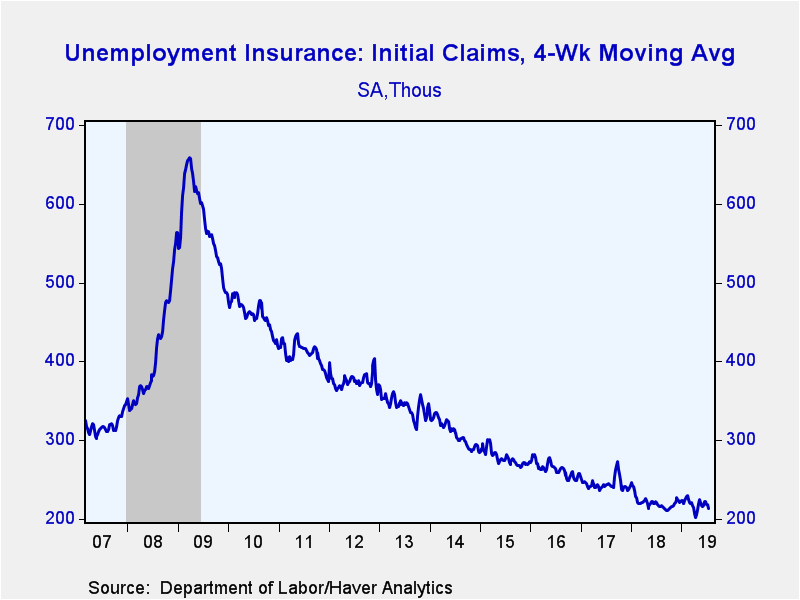
Initial claims for unemployment insurance decreased 10,000 to 206,000 (-5.1% year-on-year) during the week ending July 20 from an unrevised 216,000. Two weeks ago, claims dropped to 208,000, though it included the July 4th holiday when seasonal adjustment and reporting challenges make this data more difficult to interpret. The Action Economics Forecast Survey expected 218,000. The four-week moving average of initial claims, which smooths out week-to-week volatility fell to 213,000 from 218,750. Still, the 4-week average remains above the 50-year low of 201,500 reached in April.
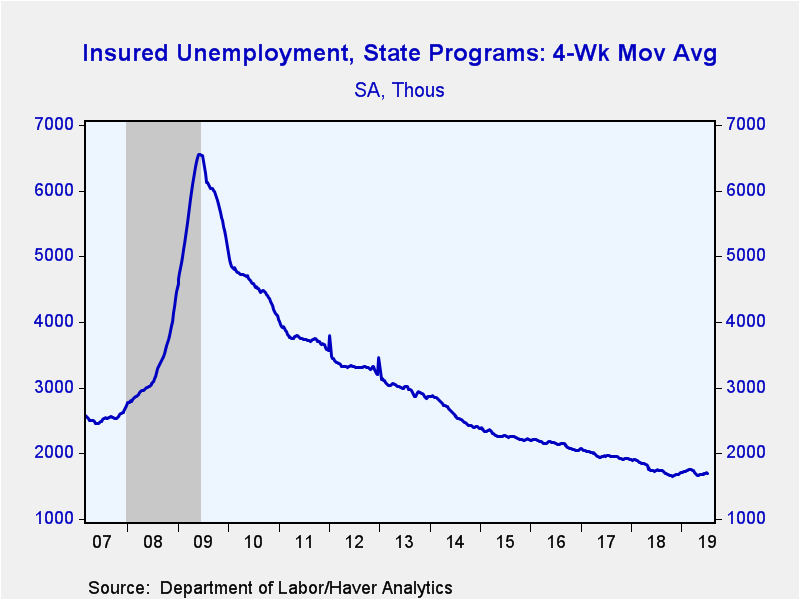
Continuing claims for unemployment insurance decreased 13,000 to 1.676 million (-4.0% y/y) in the week ending July 13, from a slightly upwardly-revised 1.689 million in the prior week. The four-week moving average of claimants declined to 1.697 million from 1.702 million.
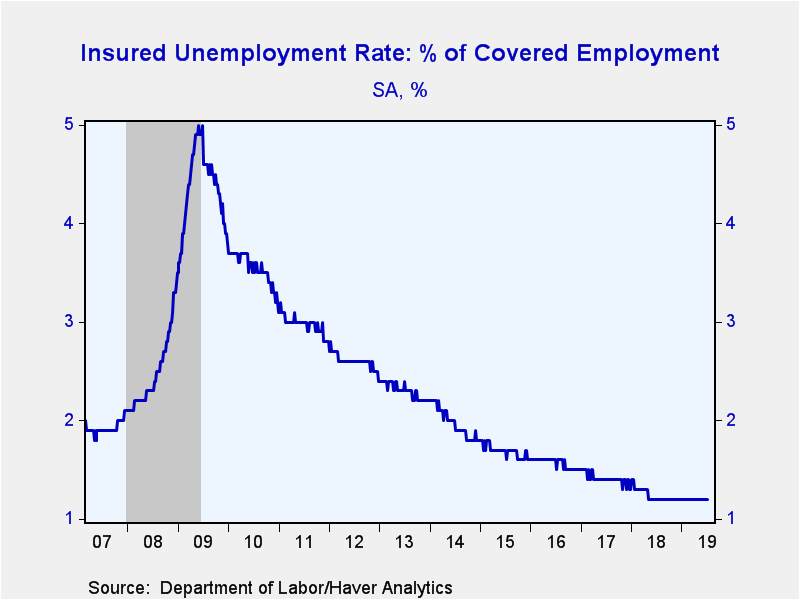
The insured rate of unemployment remained at the record low 1.2%, where it has been since May 2018. Data on the insured unemployment rate go back to 1971.
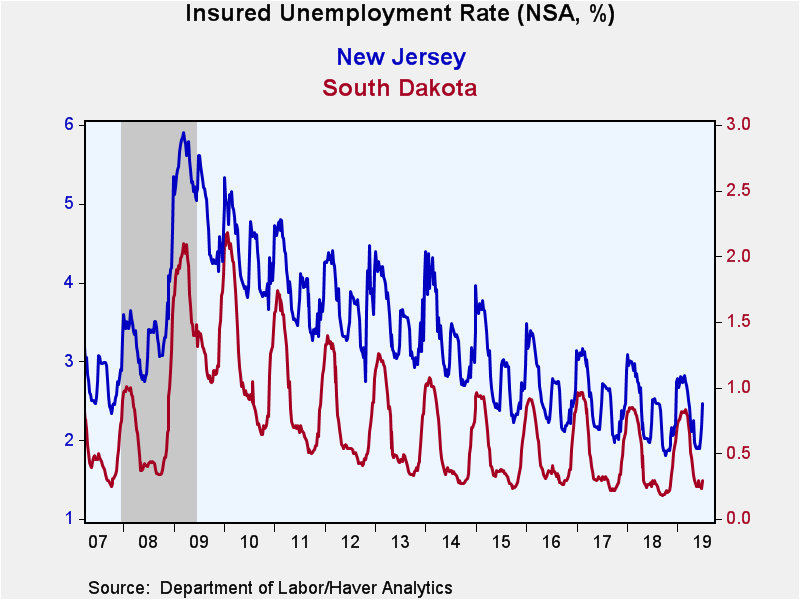
Insured rates of unemployment vary widely by state. During the week ending July 6, the lowest rates were in South Dakota (0.29%), Indiana (0.45%), Florida (0.47%), and North Carolina (0.47%) and Utah (0.47%). The highest rates were in California (1.76%), Pennsylvania (1.98%), Rhode Island (2.00%), Connecticut (2.23%) and New Jersey (2.47%). Among the other largest states by population not mentioned above the rate was 1.06% in Texas and 1.52% in New York. These state data are not seasonally adjusted and may have been especially impacted by the July 4th holiday.
Data on weekly unemployment claims going back to 1967 are contained in Haver's WEEKLY database, and they are summarized monthly in USECON. Data for individual states are in REGIONW. The expectations figure is from the Action Economics Forecast Survey, carried in the AS1REPNA database.
| Unemployment Insurance (SA, 000s) | 07/20/19 | 07/13/19 | 07/06/19 | Y/Y % | 2018 | 2017 | 2016 |
|---|---|---|---|---|---|---|---|
| Initial Claims | 206 | 216 | 208 | -5.1 | 220 | 244 | 262 |
| Continuing Claims | -- | 1,676 | 1,689 | -4.0 | 1,756 | 1,961 | 2,135 |
| Insured Unemployment Rate (%) | -- | 1.2 | 1.2 |
1.2 |
1.2 | 1.4 | 1.6 |
Gerald D. Cohen
AuthorMore in Author Profile »Gerald Cohen provides strategic vision and leadership of the translational economic research and policy initiatives at the Kenan Institute of Private Enterprise.
He has worked in both the public and private sectors focusing on the intersection between financial markets and economic fundamentals. He was a Senior Economist at Haver Analytics from January 2019 to February 2021. During the Obama Administration Gerald was Deputy Assistant Secretary for Macroeconomic Analysis at the U.S. Department of Treasury where he helped formulate and evaluate the impact of policy proposals on the U.S. economy. Prior to Treasury, he co-managed a global macro fund at Ziff Brothers Investments.
Gerald holds a bachelor’s of science from the Massachusetts Institute of Technology and a Ph.D. in Economics from Harvard University and is a contributing author to 30-Second Money as well as a co-author of Political Cycles and the Macroeconomy.


