 Global| Jan 27 2020
U.S. New Home Sales Edge Down; Revisions Suggest Weaker Trend
Summary
• New single-family home sales tick down to 694,000 in December, meaningfully weaker than the expectations of 727,000. • Downward revisions to October and November leave Q4 unchanged from Q3. Sales of new single-family homes declined [...]
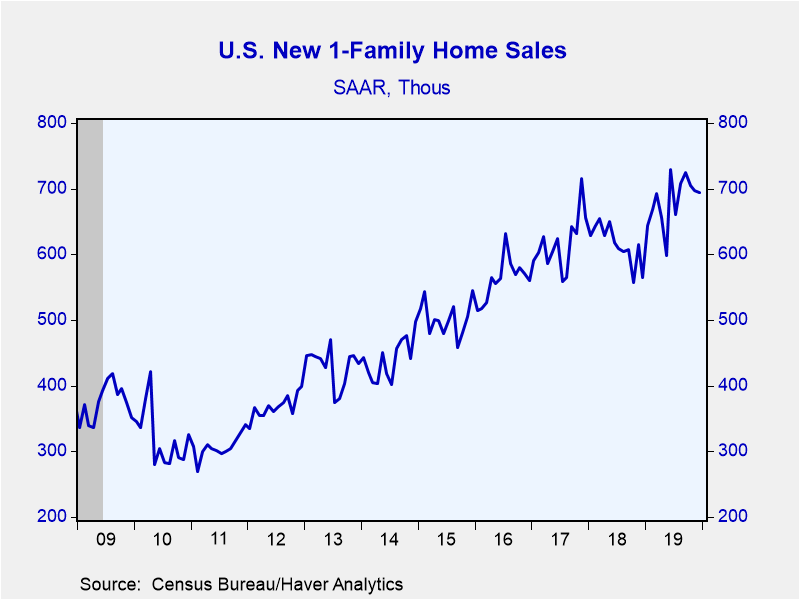
• New single-family home sales tick down to 694,000 in December, meaningfully weaker than the expectations of 727,000.
• Downward revisions to October and November leave Q4 unchanged from Q3.
Sales of new single-family homes declined 0.4% in December to 694,000 units at a seasonally adjusted annual rate (+23.0% year-on-year). The Action Economics survey had expected sales of 727,000 in December. Continuing a trend from the previous report, the prior two months were revised meaningfully lower. November sales were revised to 697,000 from 719,000 while October is now 705,000; it was 710,000 and originally reported at 733,000. This left fourth quarter sales averaging 699,000, essentially unchanged from the Q3 average of 698,000. For the entirety of 2019, sales averaged 682,000 meaningfully higher than the 2018 level and the strongest year since 2007. However, sales are still well below the over 1 million average pace seen in the first half of the 2000s.
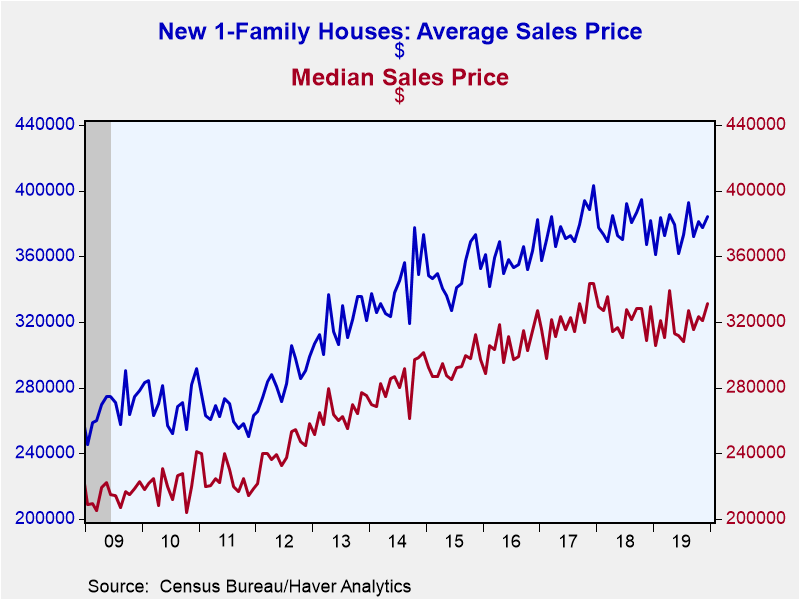
The median price of a new home rose to $331,400 in December (0.5% y/y). The average price of a new home increased to $384,200 (0.7% y/y). Home prices, which are not seasonally adjusted, have been rangebound for the last few years.
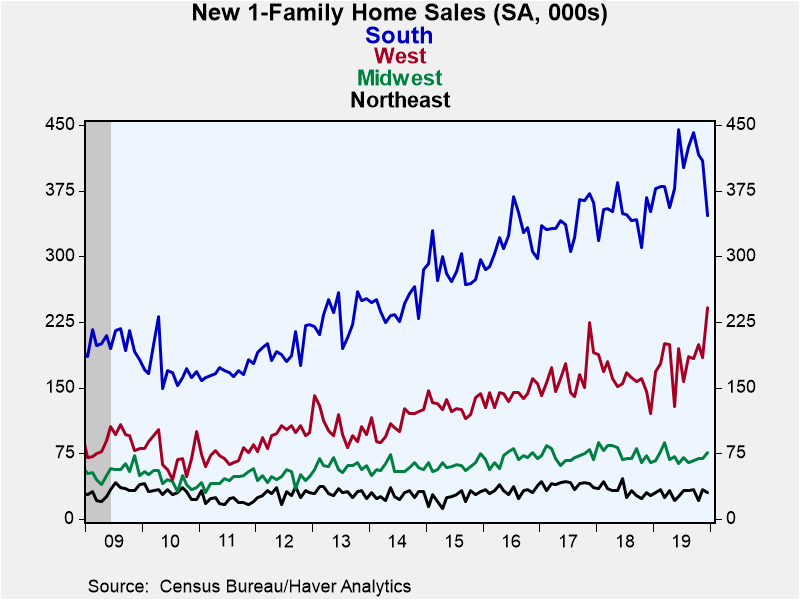
Sales activity was mixed across the country in December, with a jump in the West -- the second largest sales region -- more than offset by a drop in the South -- the largest region, representing over 50% of sales.
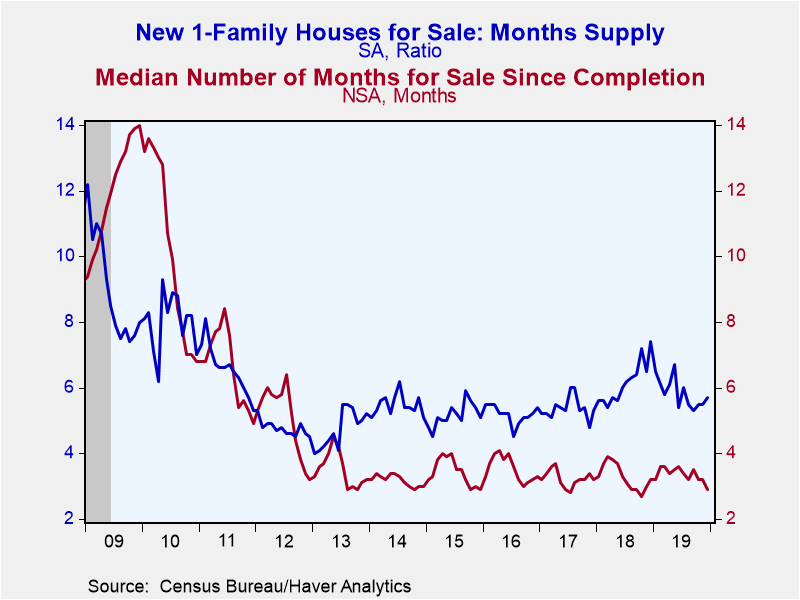
The months' supply of homes on the market increased to 5.7 months in December from 5.5 months in November. Still it is well below the eight-year high of 7.4 months seen in December 2018.
The data in this report are available in Haver's USECON database. The consensus expectation figure from Action Economics is available in the AS1REPNA database.
| U.S. New Single-Family Home Sales (SAAR, 000s) | Dec | Nov | Oct | Dec Y/Y % | 2019 | 2018 | 2017 |
|---|---|---|---|---|---|---|---|
| Total | 694 | 697 | 705 | 23.0 | 682 | 615 | 617 |
| Northeast | 30 | 34 | 21 | 11.1 | 29 | 32 | 40 |
| Midwest | 76 | 69 | 69 | 16.9 | 71 | 75 | 72 |
| South | 347 | 410 | 416 | -1.1 | 396 | 348 | 341 |
| West | 241 | 184 | 199 | 99.2 | 185 | 160 | 164 |
| Median Price (NSA, $) | 331,400 | 320,900 | 323,400 | 0.5 | 320,700 | 326,400 | 323,100 |
Gerald D. Cohen
AuthorMore in Author Profile »Gerald Cohen provides strategic vision and leadership of the translational economic research and policy initiatives at the Kenan Institute of Private Enterprise.
He has worked in both the public and private sectors focusing on the intersection between financial markets and economic fundamentals. He was a Senior Economist at Haver Analytics from January 2019 to February 2021. During the Obama Administration Gerald was Deputy Assistant Secretary for Macroeconomic Analysis at the U.S. Department of Treasury where he helped formulate and evaluate the impact of policy proposals on the U.S. economy. Prior to Treasury, he co-managed a global macro fund at Ziff Brothers Investments.
Gerald holds a bachelor’s of science from the Massachusetts Institute of Technology and a Ph.D. in Economics from Harvard University and is a contributing author to 30-Second Money as well as a co-author of Political Cycles and the Macroeconomy.


