 Global| Jun 07 2019
Wholesale Inventories Rise as Sales Decline
Summary
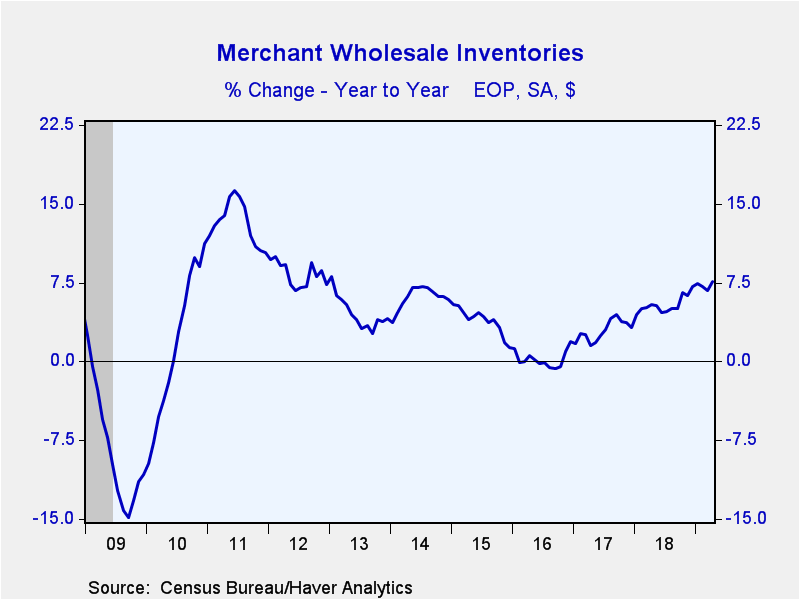
Wholesale inventories increased 0.8% in April (7.6% year-over-year), following no change in March (revised up from a 0.1% decline). The Informa Global Markets Survey anticipated a 0.7% rise. Wholesale inventory swings can have a [...]
Wholesale inventories increased 0.8% in April (7.6% year-over-year), following no change in March (revised up from a 0.1% decline). The Informa Global Markets Survey anticipated a 0.7% rise. Wholesale inventory swings can have a meaningful impact on GDP. In the first quarter, inventories provided a 0.6 percentage point boost to GDP growth.
Durable goods inventories increased 1.0% (11.0% y/y) in April after a 0.3% rise in March. Machinery inventories, the largest sector, grew 0.6% (14.2% y/y), while vehicles, the second largest, advanced 3.8% (13.1% y/y). Electrical equipment was up 0.4% (9.6% y/y). Inventories of nondurable goods gained 0.5% (2.5% y/y) after declining 0.6% in March. Drug inventories, which make up a quarter of nondurable inventories, rose 1.5% (7.0% y/y). Groceries, the second largest category, gained 0.9% (2.0% y/y).
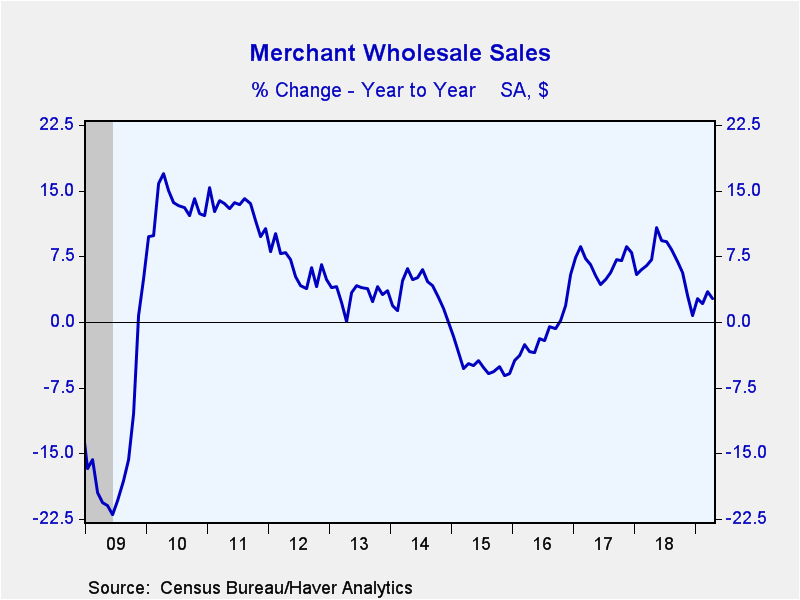
Wholesale sales declined 0.4% during April (+2.7% y/y) following a 1.8% gain. The Action Economics Forecast Survey looked for an unchanged reading.
Durable goods sales fell 1.1% (+1.6% y/y) after a 0.6% increase. Electrical equipment, the largest sector, dropped 3.2% (-0.2% y/y). Professional and commercial equipment, which includes computers, declined 1.8% (+2.4% y/y). These decreases were somewhat offset by 0.5% growth in wholesale vehicle sales (3.1% y/y). Nondurable product sales rose 0.2% (3.8% y/y) after a 3.0% gain. Petroleum products edged down 0.1% (8.0% y/y) after jumping 8.5% in March. This is likely the result of the leveling off of oil prices in the early spring after a substantial increase in the first quarter. Drug sales, which vie with petroleum to be the largest category of nondurable sales, were unchanged (+4.6% y/y) while groceries gained 0.9% (4.9% y/y).
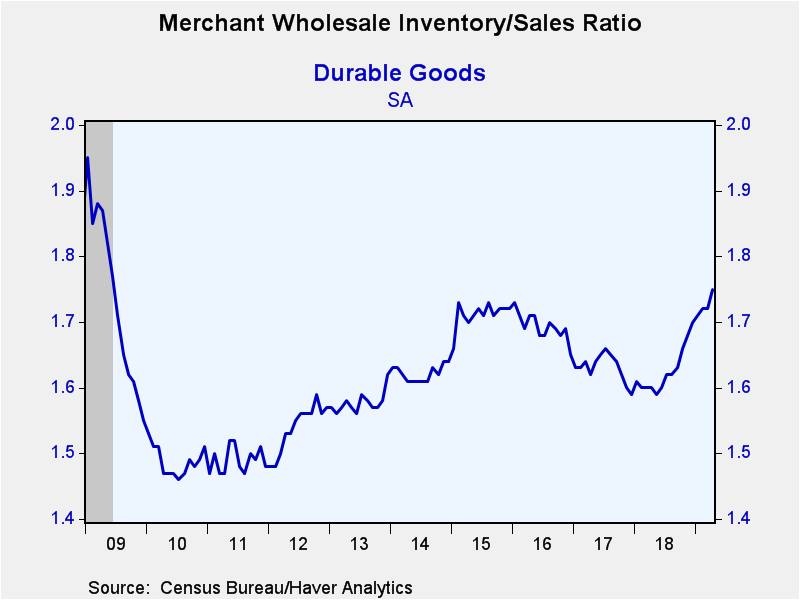
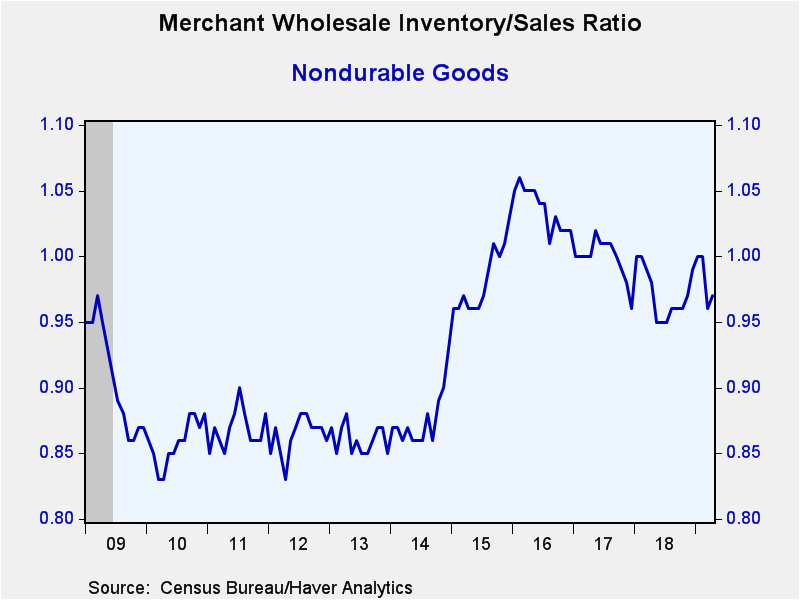
The inventory-to-sales (I/S) ratio at the wholesale level edged up to 1.34. I/S ratio has been range-bound during 2019 after rising during the second half of last year, The Durable goods I/S ratio increased to 1.75, the highest level since the end of the Great Recession. The machinery ratio declined to 2.69, while motor vehicles rose to 1.80, a ten year high. The I/S ratio for nondurable goods increased to 0.97. The petroleum industry I/S ratio edged up to 0.34 from March’s four-and-a-half year low of 0.34. The drug industry I/S rose to 1.10.
The wholesale trade figures and oil prices are available in Haver's USECON database. The expectations figure for inventories is contained in the MMSAMER database. Expectations for sales are in the AS1REPNA database.
| Wholesale Sector - NAICS Classification (%) | Apr | Mar | Feb | Apr Y/Y | 2018 | 2017 | 2016 |
|---|---|---|---|---|---|---|---|
| Inventories | 0.8 | 0.0 | 0.4 | 7.6 | 7.1 | 3.3 | 1.9 |
| Sales | -0.4 | 1.8 | 0.3 | 2.7 | 6.5 | 6.7 | -1.3 |
| I/S Ratio | 1.34 | 1.33 | 1.35 | 1.28 (Apr '18) | 1.29 | 1.30 | 1.35 |
Gerald D. Cohen
AuthorMore in Author Profile »Gerald Cohen provides strategic vision and leadership of the translational economic research and policy initiatives at the Kenan Institute of Private Enterprise.
He has worked in both the public and private sectors focusing on the intersection between financial markets and economic fundamentals. He was a Senior Economist at Haver Analytics from January 2019 to February 2021. During the Obama Administration Gerald was Deputy Assistant Secretary for Macroeconomic Analysis at the U.S. Department of Treasury where he helped formulate and evaluate the impact of policy proposals on the U.S. economy. Prior to Treasury, he co-managed a global macro fund at Ziff Brothers Investments.
Gerald holds a bachelor’s of science from the Massachusetts Institute of Technology and a Ph.D. in Economics from Harvard University and is a contributing author to 30-Second Money as well as a co-author of Political Cycles and the Macroeconomy.


