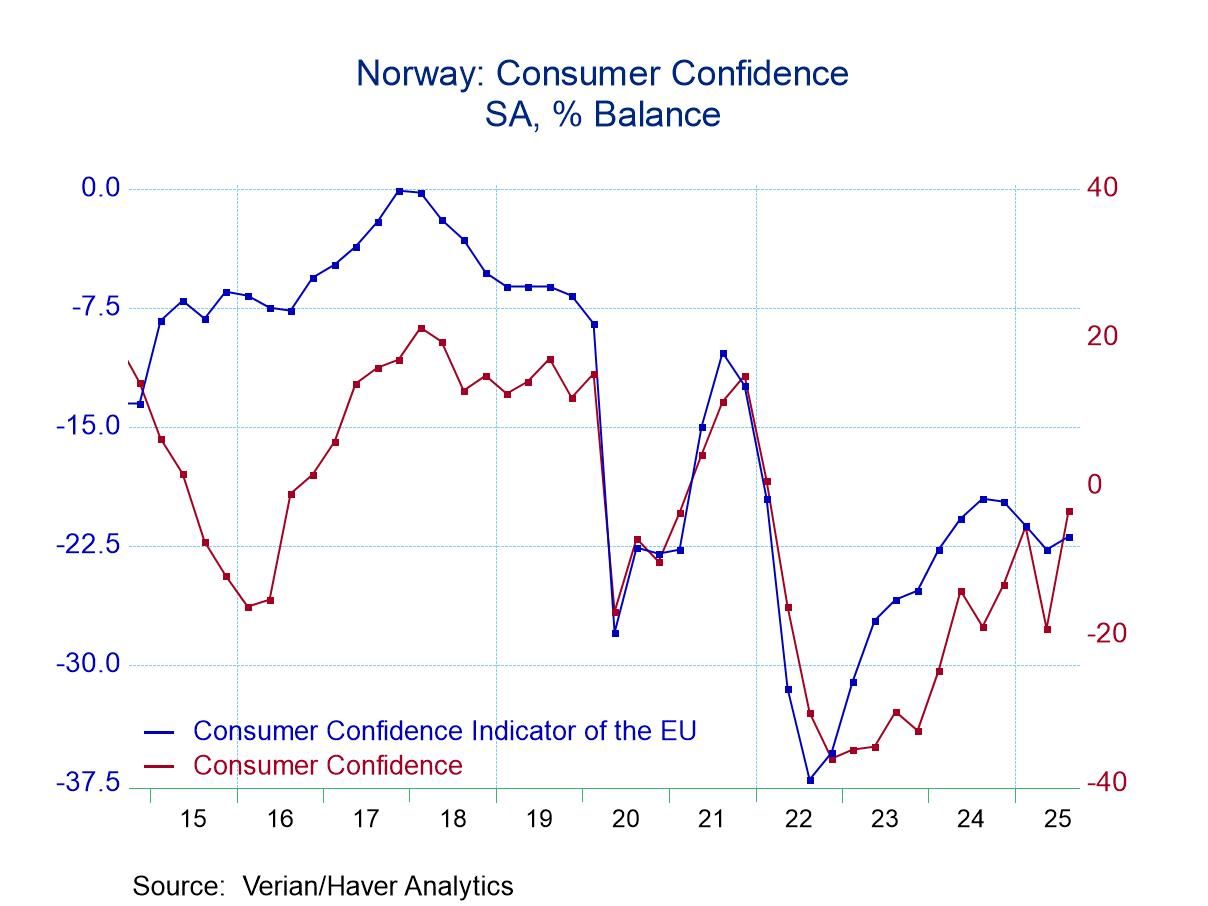
In what is becoming a more common global story, confidence in Norway is rebounding after an earlier significant setback as countries recalibrate their circumstances under the revised Trump's tariff format. Norwegian consumer confidence had slipped in the second quarter to -19.1 from -5.4 in the first quarter, but now in the third quarter, confidence is snapping back to a -3.2 reading, the strongest reading since the first quarter of 2022.
Of course, there's a lot in the mix for this important northern European economy. Norway is an oil economy, and it also is one of the economies that is more vulnerable to relations with Russia. It has a relatively short but direct common border with Russia in the far north; otherwise, the borders are with Sweden and Finland. Still, with conditions in Russia touch and go and with Russian aircraft occasionally testing the air defenses the Baltic region, this is a geopolitically sensitive location.
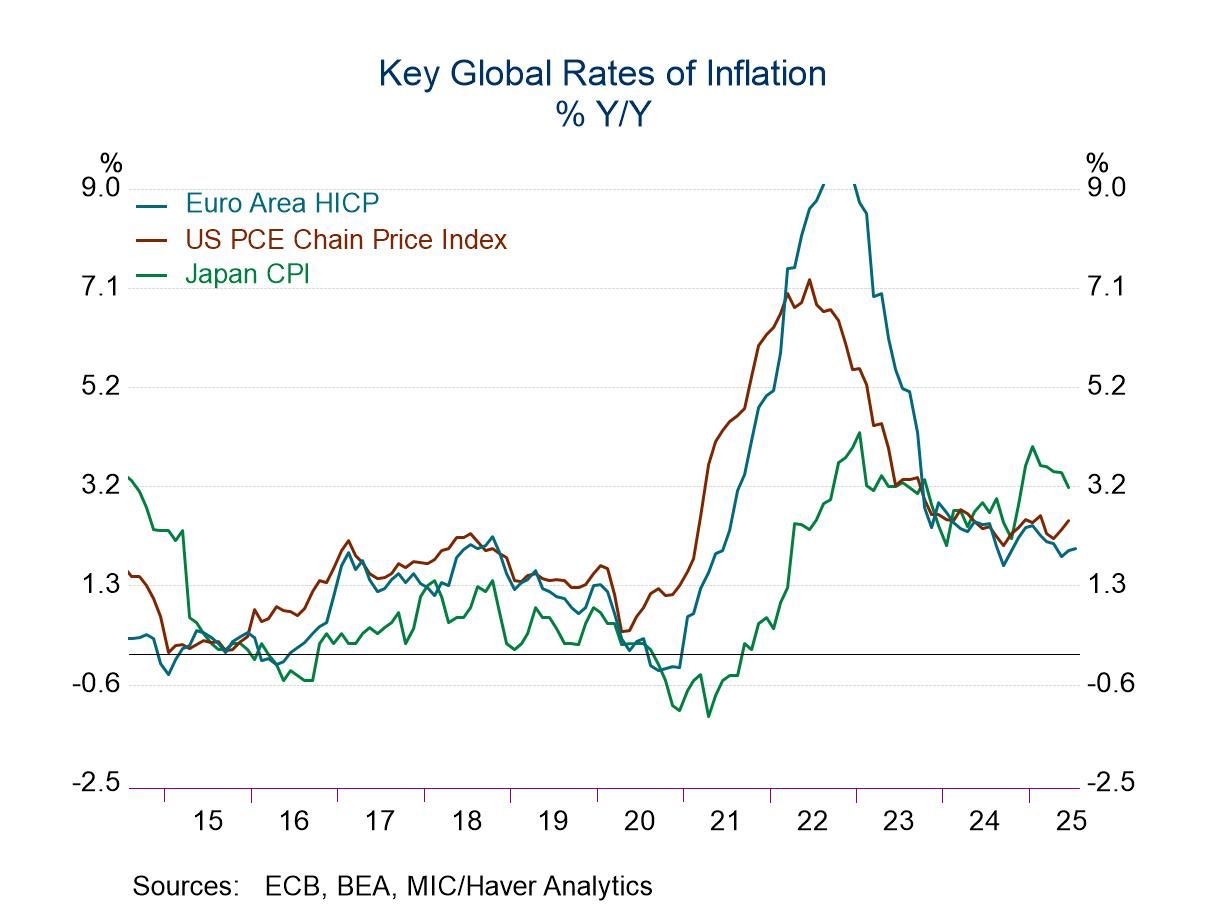
On the economic front, inflation has been creeping up but the headline and core inflation rates are above the 2% mark and largely occupying space between 2.5% and 3%. Economic performance has been a bit uneven with the unemployment rate beginning to move up, as that rate has been notching steadily higher as 2025 has progressed. The last move by the central bank was to cut its key interest rate on site deposits. With the unemployment rate rising, there was little reaction in the bond market to this, especially in the environment where the manufacturing sector continues to be under pressure as it is for the most part globally with output in Norway contracting over the past two months (Y/Y).
Consumers’ rating of the environment for spending improved in the third quarter after deteriorating sharply in Q2. Its improvement brings it to a level above where it was in the first quarter as well; however, on ranked data back to the early 1990s the environment for making a major purchase still only has an 11.4 percentile standing, a relatively weak performance.
The assessment of the overall economy for the next year improved sharply once again after falling sharply in the second quarter. This metric had a value of 5.1 in the first quarter that slipped back to -21.2 in the second quarter; since then, the third quarter has gained some of that back at a survey reading of -3.3. It's still not back to its first quarter level, and it still is a reading that represents relatively weak performance as it has a 28.8 percentile standing which leaves it clearly in the bottom third of its queue of values since the early 1990s.
However, the personal finance readings do pick up for conditions expected for next year as the index evolves from a reading of 21.5 in the first quarter to 11.2 in the second quarter and back up to 21.8 in the third quarter of 2025. This reading brings the personal finance assessment to a 47-percentile standing, just slightly below its median for the period; at a level of 21.8, it's above its mean value of 20.1 for the period. This news on the personal finance front is better than anywhere else in the survey.
Consumer confidence is also rated according to age. And while there are some differences among the age-cohorts, for the most part they move and evaluated in unison. The queue rankings range from 16.7% (with the youngest growth at the low end) to 25.8% with the oldest group at the high end. Over 4 quarters, the changes in the age-cohort evaluations range from +11.1 to +18.7.
 Global