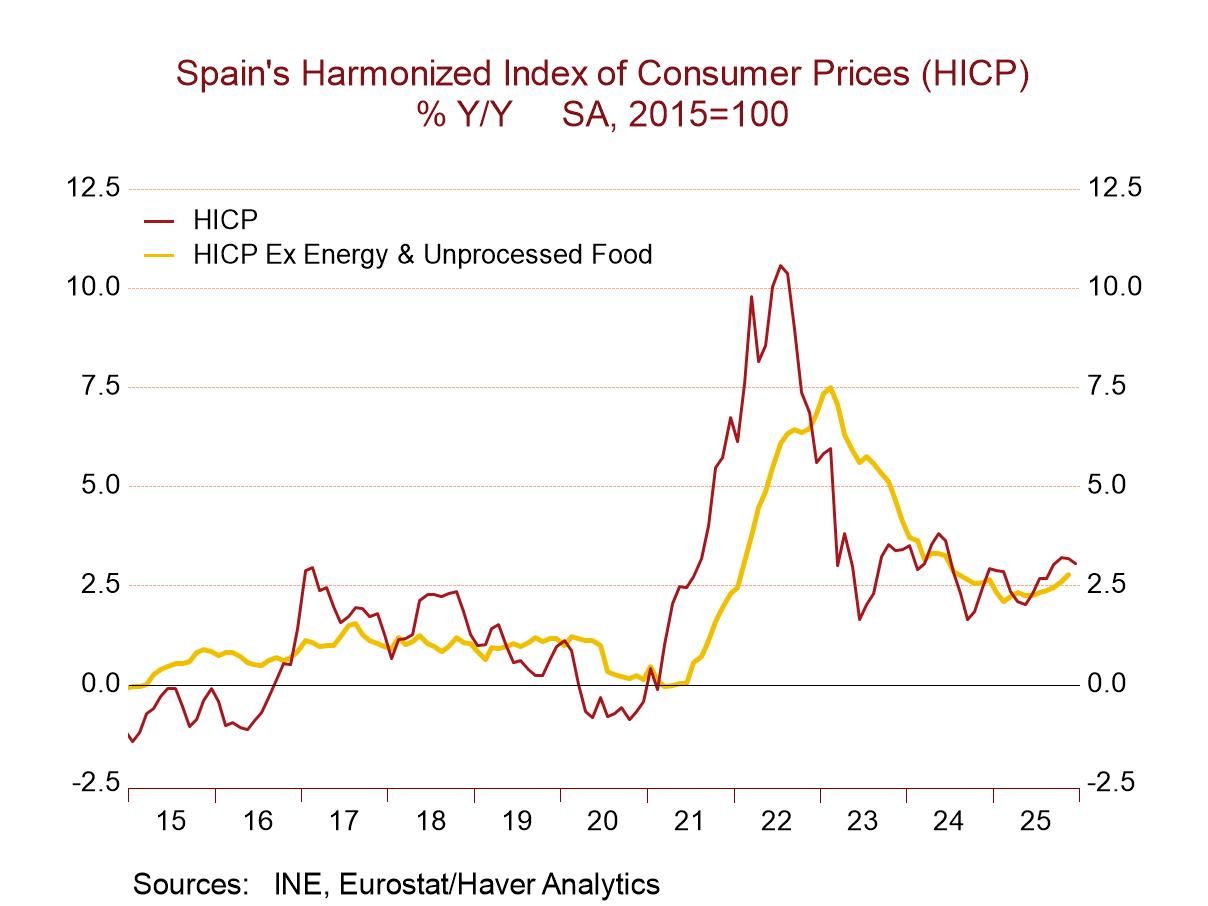
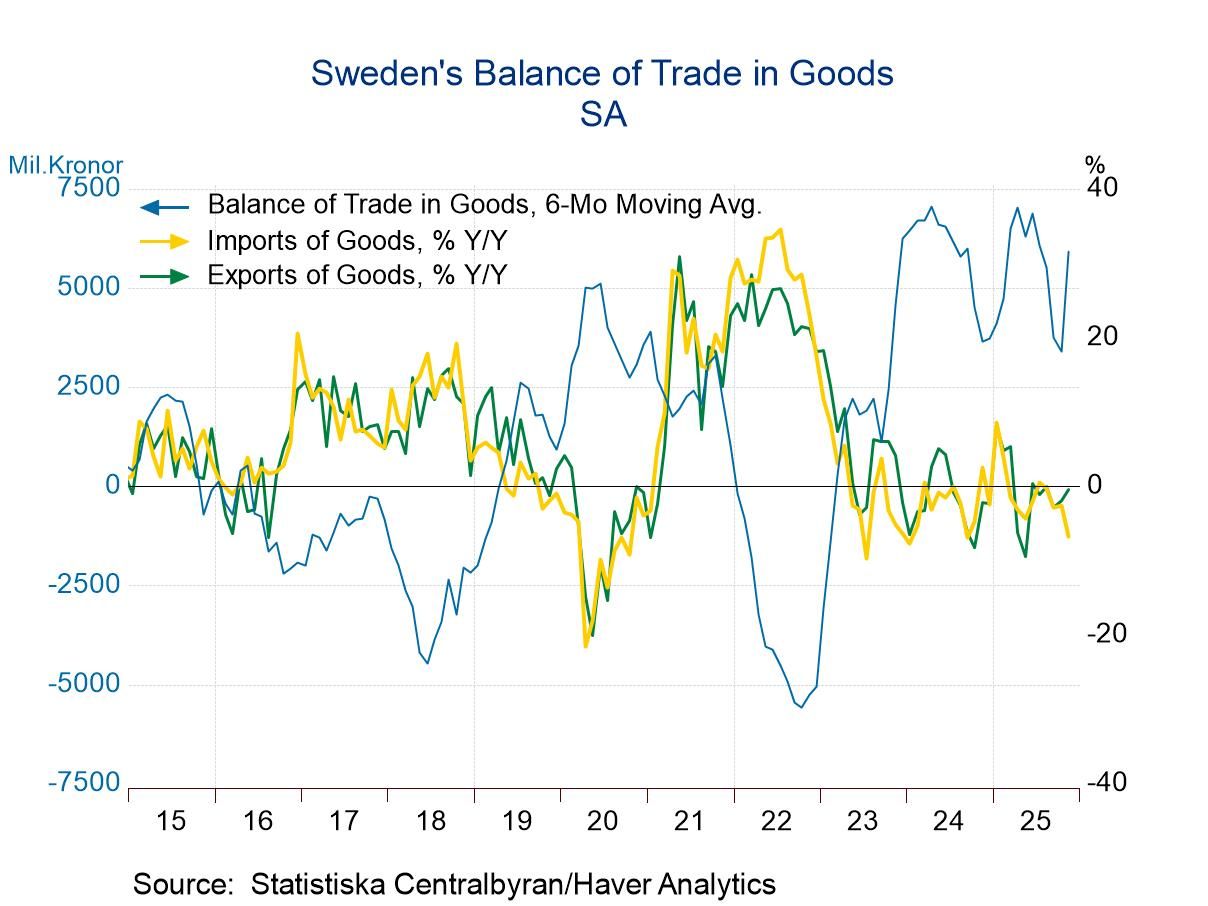
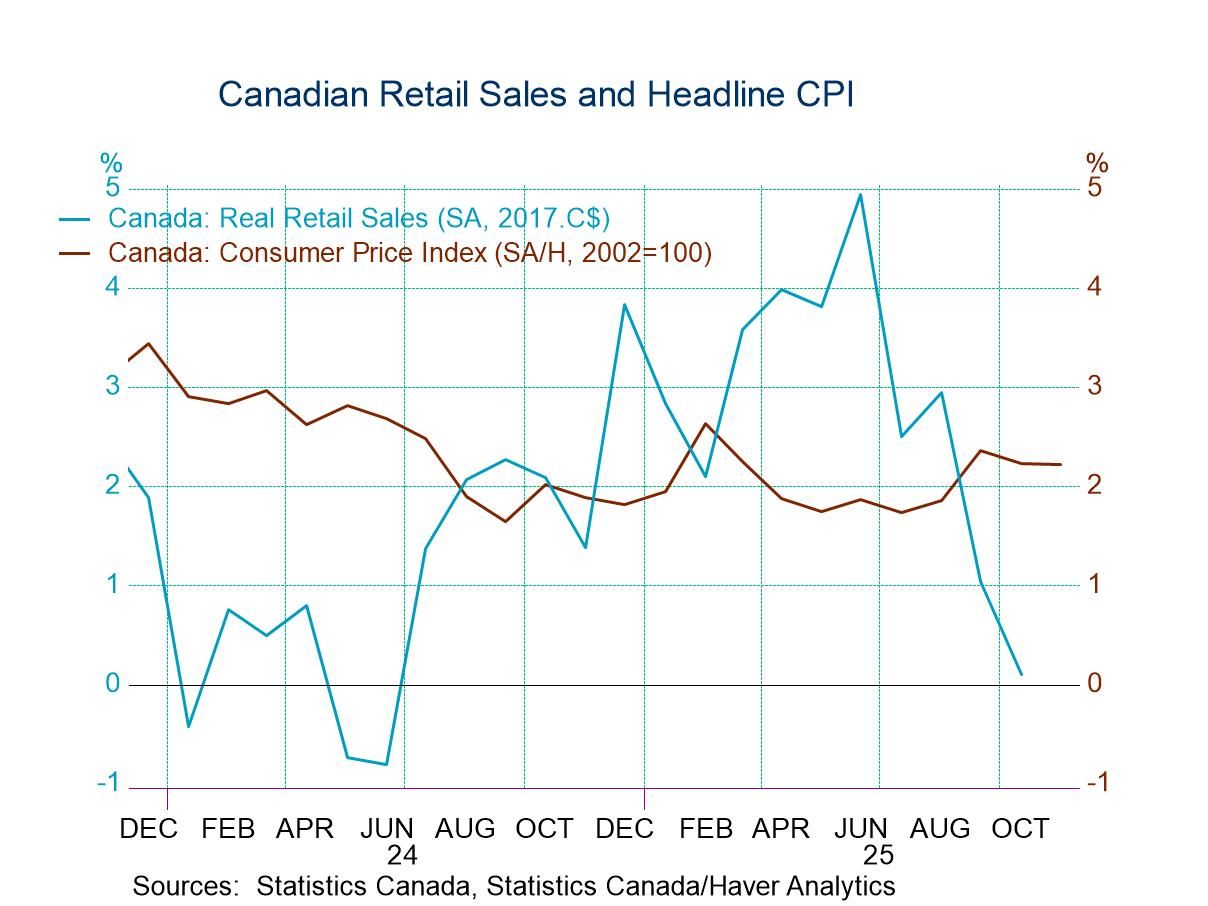
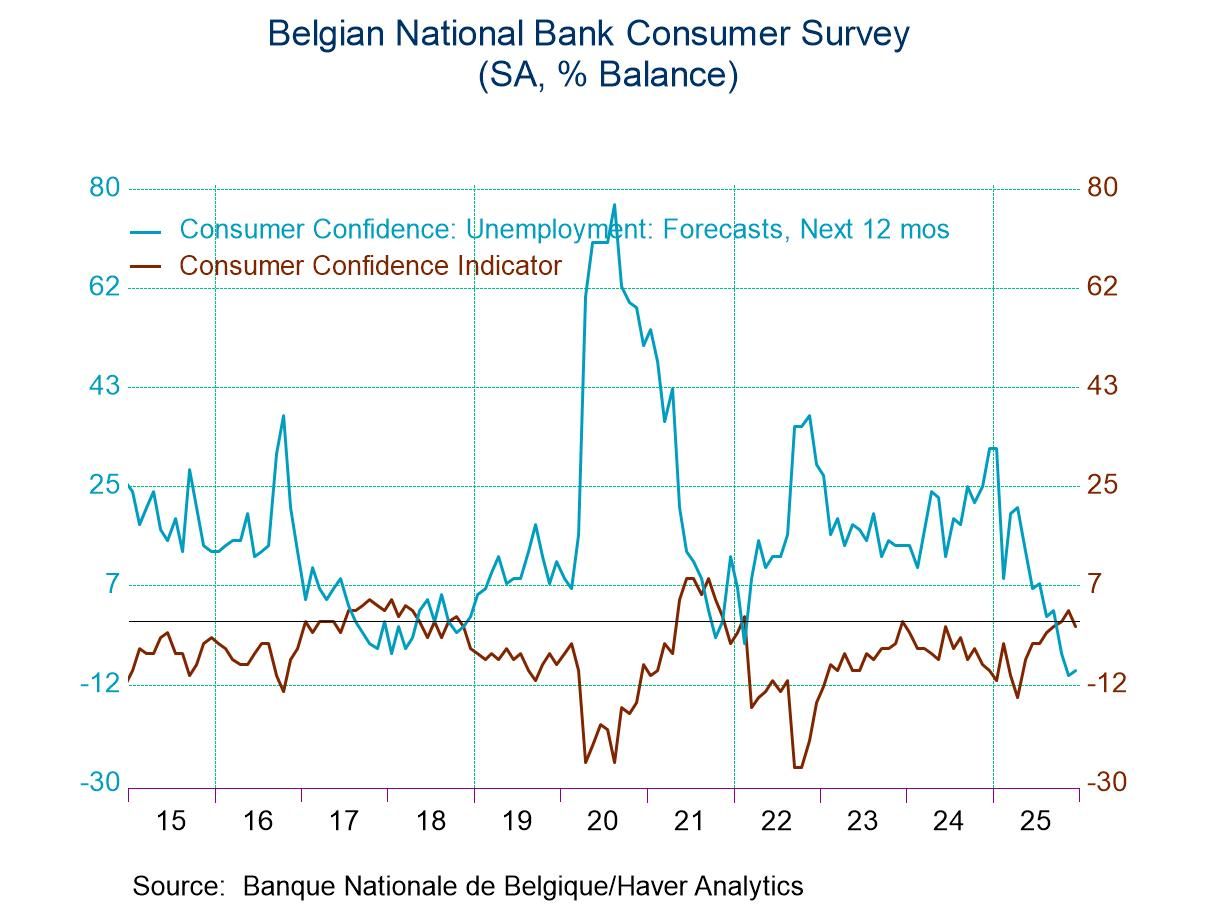
Haver Analytics
Haver Analytics

Introducing

Robert Brusca

Robert A. Brusca is Chief Economist of Fact and Opinion Economics, a consulting firm he founded in Manhattan. He has been an economist on Wall Street for over 25 years. He has visited central banking and large institutional clients in over 30 countries in his career as an economist. Mr. Brusca was a Divisional Research Chief at the Federal Reserve Bank of NY (Chief of the International Financial markets Division), a Fed Watcher at Irving Trust and Chief Economist at Nikko Securities International. He is widely quoted and appears in various media.   Mr. Brusca holds an MA and Ph.D. in economics from Michigan State University and a BA in Economics from the University of Michigan. His research pursues his strong interests in non aligned policy economics as well as international economics. FAO Economics’ research targets investors to assist them in making better investment decisions in stocks, bonds and in a variety of international assets. The company does not manage money and has no conflicts in giving economic advice.

Publications by Robert Brusca

  • Global| Aug 14 2025

    EMU IP Set-back in June

    Consumer goods output in the European Monetary Union has been expanding since the second quarter of 2024; however, that has not been enough to bring expansion to output overall. Intermediate and capital goods output continue to be under duress. In June, overall IP output fell by 1.3%, manufacturing output fell by 1.6%, and the consumer goods sector, which has been the core of strength for output, declined on the month by 4.3%. Capital goods output fell 2.2% and the output of intermediate goods fell by 0.2%. All in all, it was a tough June for the industrial sector in the European Monetary Union.

    Sequential growth rates Industrial output excluding construction gained 0.5% over 12 months, rose over six months at a 2.5% annual rate, and then experienced a sharp decline over three months as output fell at a 10.3% annual rate. Consumer goods output gained 5.1% over 12 months but declined at a 1.8% annual rate over six months and fell at an 8.6% pace over three months; both consumer durables and nondurable goods output are sharply lower over three months. Intermediate goods output fell by 1.9% over 12 months; it's flat over six months and then dropped at a 10.7% annual rate over three months. Capital goods output fell 2.2% over 12 months, gained 0.4% at an annual rate over six months, then fell sharply at a 9.7% pace over three months. To some extent, this is a tariff-related trend as firms in Europe had cranked-up output to get goods out ahead of the tariffs and now that we are in the actual tariff period output is being cut back to trend and to account for the previous surge. So, the reductions in output appear a little more draconian than the actual weakness in the economy - these are still trends to watch, however.

    Ranking trends for growth Ranking 12-month growth rates show us a great deal of weakness in the growth of manufacturing output. The headline for output excluding construction has a 51.4 percentile standing on data back to late 2007. This means over this period, the pace of the output gains is slightly ahead of its median. The median for ranked data occurs at a ranking of 50%. Consumer goods output has an 88.3 percentile ranking for its growth rate that is created entirely by a 90.7 percentile growth rate ranking for consumer nondurable goods, since consumer durable goods have only a 20.6 percentile ranking. Intermediate goods’ growth rate has a 37.4 percentile ranking and capital goods have a 24.8 percentile ranking. The annual rates of output growth are weak except for nondurables in the consumer sector. For manufacturing overall, the ranking is in the 41.6 percentile, below its median.

    Output trends since COVID Not surprisingly, if we look at output gains compared to January 2020 before COVID struck, only total consumer goods output and consumer goods output of nondurables have levels of output that are greater than what they created in January 2020. Overall output, however, is close to maintaining its performance from five years ago with current output at 98.5% of what it was in January 2020; manufacturing output is at 98.8% of what it was in January 2020 as well. The most lagging component is intermediate goods where output is only 88.4% of what it was in January 2020. All of the components are weak because they show output has not grown in over five years – except for consumer nondurables-all the other ratios are below 100%.

    Country performance Among the 13 European Monetary Union members in the table for June, 6 of them show output declines in that month. That's an improvement from nine that declined in May and seven that showed declines in April. Despite the fact that overall output growth fell in June, the unweighted average across these reporting countries shows a median increase in output of 0.5% in June, up from -0.7% in May and -0.2% in April. The pooled country level statistics are not weighted for manufacturing or GDP importance. Germany continues to be one of the main reasons for economic weakness in the monetary union. Only Germany and Luxembourg show the declines on all three horizons of 12 months, 6 months, and 3 months.

    Quarter-to-date The second quarter to date column which now is for the completed quarter shows the overall output and manufacturing output are declining on the quarter and in five reporting countries: Austria, Germany, the Netherlands, Malta, and Ireland.

    Output growth by country The ranking of output growth shows rankings across these 13 countries that are above their median and data back to 2007 for all but four countries. However, one of those four lagging countries is Germany, and Germany's rank on the period is only in its 14th percentile – exceptionally weak. Germany, which has the largest manufacturing sector and is generally the powerhouse of Europe, is the main reason that the aggregate industrial production data for the EMU are so weak. Manufacturing in most of the rest of the monetary union is performing at a level better than its historic median; back to late 2007, there are only four exceptions, and Germany is the main one.

  • In what is becoming a more common global story, confidence in Norway is rebounding after an earlier significant setback as countries recalibrate their circumstances under the revised Trump's tariff format. Norwegian consumer confidence had slipped in the second quarter to -19.1 from -5.4 in the first quarter, but now in the third quarter, confidence is snapping back to a -3.2 reading, the strongest reading since the first quarter of 2022.

    Of course, there's a lot in the mix for this important northern European economy. Norway is an oil economy, and it also is one of the economies that is more vulnerable to relations with Russia. It has a relatively short but direct common border with Russia in the far north; otherwise, the borders are with Sweden and Finland. Still, with conditions in Russia touch and go and with Russian aircraft occasionally testing the air defenses the Baltic region, this is a geopolitically sensitive location.

    On the economic front, inflation has been creeping up but the headline and core inflation rates are above the 2% mark and largely occupying space between 2.5% and 3%. Economic performance has been a bit uneven with the unemployment rate beginning to move up, as that rate has been notching steadily higher as 2025 has progressed. The last move by the central bank was to cut its key interest rate on site deposits. With the unemployment rate rising, there was little reaction in the bond market to this, especially in the environment where the manufacturing sector continues to be under pressure as it is for the most part globally with output in Norway contracting over the past two months (Y/Y).

    Consumers’ rating of the environment for spending improved in the third quarter after deteriorating sharply in Q2. Its improvement brings it to a level above where it was in the first quarter as well; however, on ranked data back to the early 1990s the environment for making a major purchase still only has an 11.4 percentile standing, a relatively weak performance.

    The assessment of the overall economy for the next year improved sharply once again after falling sharply in the second quarter. This metric had a value of 5.1 in the first quarter that slipped back to -21.2 in the second quarter; since then, the third quarter has gained some of that back at a survey reading of -3.3. It's still not back to its first quarter level, and it still is a reading that represents relatively weak performance as it has a 28.8 percentile standing which leaves it clearly in the bottom third of its queue of values since the early 1990s.

    However, the personal finance readings do pick up for conditions expected for next year as the index evolves from a reading of 21.5 in the first quarter to 11.2 in the second quarter and back up to 21.8 in the third quarter of 2025. This reading brings the personal finance assessment to a 47-percentile standing, just slightly below its median for the period; at a level of 21.8, it's above its mean value of 20.1 for the period. This news on the personal finance front is better than anywhere else in the survey.

    Consumer confidence is also rated according to age. And while there are some differences among the age-cohorts, for the most part they move and evaluated in unison. The queue rankings range from 16.7% (with the youngest growth at the low end) to 25.8% with the oldest group at the high end. Over 4 quarters, the changes in the age-cohort evaluations range from +11.1 to +18.7.

  • Macro-expectations- The ZEW financial experts registered disappointment this month in the tariff deal that the European Community struck with the United States. Macroeconomic expectations in August for Germany were slashed back to a reading of 34.7 in August from 52.7 in July; for the United States, expectations also were cut to -41.2 from -34.2. These two sets of reductions brought German expectations to a 60.8 percentile standing, leaving them still above their median on data back to the early 1990s. The U.S. reading has a much lower, 9.3 percentile standing on the same timeline. Despite the ZEW experts’ opinion that the tariff deal is bad for Europe, it apparently doesn't boost expectations for the U.S. at all. This, of course, makes me wonder to what extent the forecast has a bit of sour grapes to it.

    The economic situation- The economic situation also deteriorates this month with the euro area assessment falling to -31.2 from -24.2 in July. Germany's assessment falls to -68.6 from -59.5 as the tariff deal weighs on Europe and Germany. The current situation for the U.S. improves marginally to +0.1 in August from -5.9 in July. These new readings leave the euro area economic situation reading with a ranking in its 46.9 percentile, Germany ranks in its 22.2 percentile, and the U.S. stands in its 35.1 percentile.

    Inflation expectations- Inflation expectations in Europe remain low but increased to some extent in the U.S. where they were already high. The European readings for the euro area fell back to -6.7 in August from -5.8 in July. For Germany, the reading was little changed at -5.1 in August from -5.2 in July. The U,S, rating moved up to +74.5 in August from +64.3 in July. The queue standings for these metrics show the euro area inflation expectations standing in its 27th percentile, the same as for Germany, but for the United States inflation expectations are up to their 95.9 percentile! This is an extremely interesting angle from the ZEW financial experts because we have the Fed in the U.S. poised to cut interest rates. We have the President pushing the Fed to cut interest rates more quickly and more deeply than it wants to do it. And despite the fact that inflation has run over target for four and a quarter years in the U.S., we have the Fed seemingly ready to cut interest rates, perhaps twice by the end of the year, even with the potential for inflation from tariffs knocking at the door. The ZEW experts ‘take’ on the U.S. and its financial situation seems to be quite different from how it's being analyzed in the United States.

    Short-term interest rates- Short-term interest rate expectations for the euro area show less of an inclination for rates to fall with the -35.7 reading in August compared to -49.7 in July. For the U.S., the -61.5 reading is lower than July's -43.8, indicating that expectations for rate cuts in the U.S. are growing. The euro area short-term rate expectation has an 18.4 percentile standing whereas in the U.S. the standing is at its 10.4 percentile.

    Long-term rate expectations- Long-term interest rates found reductions both in Germany and the U.S. in August. German expectations fell to an index reading of 19.0 from 26.1 in July. In the U.S., the reading fell to 26.4 from 38.7. The queue standings for the German rate are in their 25.5 percentile, below the U.S. where the percentile standing is at its 32nd percentile. In both cases, the expectations for long rates indicate a good deal of moderation. Queue standings well below their respective median readings for both Germany and the U.S. (remembering that the medians for ranked data occur at the 50th percentile mark).

    Stocks- Stock market expectations were slightly weaker in Europe with the euro area falling to 18.1 in August from 22.4 in July. The German reading fell back to 18.5 from 24.6, while the U.S. reading is little changed at 8.4 compared to 8.6 in July. The standings for all of these readings are around the 15th percentile; there are small differences among the different reporters, but nothing of significance.

  • As more updated inflation data continue to post, we can look back at EMU historic inflation performance and try to gain some perspective. Since the euro area went to single currency status and set a program in motion for replacing domestic currencies (whose exchange rates were by then locked) with the euro-currency unit, there has been a lot of shifting of inflation and in relative prices among members. In the early days, there was a lot of concern about that and about entry level inflation commitments in the community.

    On a to-date basis, despite the recent loss of control over inflation (in the wake of COVID and the Russian invasion of Ukraine) which the ECB has now mostly – but not fully- contained, core inflation in the EMU still runs hot and does so somewhat broadly. Still, headline inflation in the euro area has run at a compounded annual rate of 2.1% since January 1999, very close to its original 2% commitment.

    Current headline inflation rates among early reporting and early EMU members (11-countries) show year-on-year inflation at 2.4% or higher in six of them- highest at 3.5% in Austria.

    Since currencies were bound together and blended into the euro in January 1999, price levels among these members have risen in differing magnitudes, ranging from 92% in Luxembourg to 63% in France. That leaves a lot of potential for competitiveness gaps between those countries depending on the industries that most responsible for the price-level rise differences.

    Price levels have risen more slowly than for the EMU overall in France, Finland, Ireland, Germany, and Italy. When the EMU was first being implemented, there were massive and chronic inflation differences between hard money countries like Germany, the Netherlands, Finland and a few others. The Mediterranean countries including France, Spain, Portugal, Italy, and Greece had typically run much higher rates of inflation. However, after over a quarter century in the cauldron of monetary singularity, we find that Spain and Portugal have averaged inflation rates of 2.4% and 2.2% while the EMU has averaged a pace of 2.1% during the period. Italy has averaged 2.1%. These are tightly clustered results.

    The Monetary Union has had its difficulties, its tensions, its debt crises, and has withstood an influx of migrate that created tensions in the area (an influx that cost former EU member the U.K. its membership). But in the end, current inflation rates are mostly in alignment and so do not seem to display much more variation that the sorts of inflation rate difference you see among various states within the United States. The worst start-to-date inflation performance is in Luxembourg at 2.5% -and that probably matters the least since it is a financial center and does not compete much in manufacturing.

    The far-right hand column in the table ‘memorializes’ history by showing the largest divergence between German inflation and each member over this history back to 1999. The current largest one-year inflation rate gap with Germany is Austria at 1.5% but after that it is Spain at 0.6% and then Portugal, Luxembourg, and Belgium -all at 0.5%. These gaps bear no relationship to the historic annual discrepancies as large as 28%. Four countries have their largest discrepancy with Germany annual inflation at over 20%; the others are greater than 15% but less than 20%.

    For reference, I include the United States and the United Kingdom at the bottom of the table. They are two peas-in-a-pod with aggregate price levels rising over 90% each over this period. We can see the impact of that on the dollar’s value as well as on the value of the pound sterling over this period. If exchange rates are locked (as in the EMU), domestic prices are forced to rationalize themselves in the domestic economy. If exchange rates are left to fluctuate, the pressure on the domestic price level to adjust is alleviated because the exchange rate can adjust instead. Forcing adjustments in prices through a domestic chain of events is usually more painful than undergoing exchange rate change and, the later, simply change all prices in unison at least those for tradeable goods.

  • Japan's economy watchers index is showing some rebound after a period of weakness. The economy is not breaking out into sharply improved readings; however, the monthly readings have now increased and improved for three months in a row for both the current and the future indexes. The increase for the current index over three months is 2.6 diffusion points; for the future index it's 4.6 diffusion points. Over 12 months, both readings are still lower on balance.

    Percentile standings-rankings Both headline readings are still below their historic medians, but the current index has a 34.8 percentile standing and the future index has a 39.5 percentile standing. The headline queue standings in both cases are below 50%- a reading below 50% indicates a reading below its historic median.

    Diffusion readings Current index components all have diffusion readings below their respective 50 marks, which tells us that they're all showing contraction. The surveys show a headline reading of 45.2 for the current index in July, compared to 47.3 for the future index in July. For the current index, all of the component rankings are below 50 for July, June and May. For the future index, there are three readings above 50 in July and none for June or May.

    July’s Future Index improvement The improvement in July for the future index is concentrated in eating and drinking places, services, and employment – all are households or individual-linked readings. That may reflect some sense of relief that Japan’s tariff negotiations with the United States were progressing and finally a deal was struck. The future index, in addition to having several diffusion readings above 50 in July, shows three readings that have queue standings, above the 50th percentile, putting them above their historic medians. Those are readings for eating and drinking places, services, and for housing. The reading for housing takes on a 59.3 percentile queue standing even though its diffusion index remains below 50 at 47. In July it moved up to 47, making a relatively sharp gain from a reading of 42.7 in June.

    There is, therefore, relatively more evidence of improvement going on in the future index compared to the current index where monthly gains were generally smaller.

    The breadth of improvement Month-to-month the current index improved in 60% of the categories in July compared to 70% in May and June. The future index components improved across the board in July, 80% of them improved in June, and gains were across the board again in May. Looking at the changes over three months, six months, and 12 months according to average data, over three months 60% of the current categories improved compared to none over six months and 80% over 12 months. For average future data, 100% improve over three months, none improve over six months and 60% improve over 12 months.

  • Germany
    | Aug 07 2025

    Downdraft for German IP

    Industrial production in Germany fell by 1.9% in June and continues to show weak performance on trend. Yesterday's report on German industrial orders was weak. The table below on German industrial production shows the orders results presented with other output data and industrial surveys for Germany and some other key European economies that report manufacturing and industrial data early.

    Today's industrial report shows a 1.9% decline in German industrial production in June after slipping 0.1% in May and falling by 1.6% in April. The three-month annual rate change in industrial production is a decline of 13.4% at an annual rate; that stepped up from a 1.8% annual rate decline over six months and from a 3.5% annual rate decline over 12 months.

    Broad sector-wide manufacturing weakness Consumer goods output fell an outsized 5.6% in June. The sequential annualized growth rate for consumer goods is -4% over 12 months, -6.3% over six months and -22.7% over three months - an accelerating pace of decline. Capital goods output fell by 3.2% in June. Its sequential pattern is not as clear a decelerating pattern as for consumer goods, but it's substantially indicative of the same trend with a 4.6% decline over 12 months, an annual rate decline of 2.2% over six months and then a stepped-up decline of 19% at an annual rate over three months. Intermediate goods output fell by only 0.6% in June, but it has a string of negative values coming into June. Its sequential growth rates show a drop of 5.3% over 12 months, a drop at a 1.2% annual rate over six months, and then an outsized drop of 16% at an annual rate over three months. The profile for German industrial production is extremely weak, broad, and disappointing.

    Construction weakness as well Construction output rose by 1.3% in June; however, it's coming off of declines in both May and April and its sequential growth rates become progressively weaker from 12-months to 6-months to 3-months, culminating in a -9.9% annual rate decline over the last three months.

    Industrial surveys are more upbeat Surveys of industrial conditions in Germany are actually more positive than the orders data from yesterday or the industrial production data in today's report. The ZEW current reading shows an improvement from May to June as well as from April to June. The IFO manufacturing survey shows no change in the index in June compared to May, but it's stepped up compared to April. IFO manufacturing expectations show improvements in a sequence, from April to May to June. The EU Commission industrial survey shows deterioration in June compared to May and also in June compared to April- it is the survey ‘outlier.’ The sequential survey averages over 12 months, six months, and three months for all four surveys show improved readings over three months compared to the respective 12-month averages. The survey data are more encouraging than either the output or the orders data.

    Other European trends Manufacturing trends for other early reporting European countries, France, Spain, Portugal, and Norway, show largely better performance in June for these countries compared to the German results. Portugal's June report is an exception; a 3.6% decline in output in June is large. However, over three months, all four of these European countries have better performance than Germany. Portugal still logs in decline in output but a decline of only 0.4%, much better than the numbers reported by Germany over three months. In each of these countries France, Spain, Portugal, and Norway, there were increases in output over 12 months ranging from 2.4% in France to 4.1% in Norway, as German output fell by 3.5%.

    Quarter to date (Q2-results) Quarter-to-date (QTD) IP shows declines for all these German measures; the sole increase among the German indicators is for real manufacturing orders. Surveys for Germany on a QTD basis show positive changes compared to the previous quarter. The other European countries show strength, a 15.9% rise in output in France, a gain of 1.6% at an annual rate in Spain, a smaller 1.3% annual rate decline in Norway, against a sharp 10% annual rate reduction in output in Portugal for the quarter to date.

    Ranked performance of growth rates and surveys The second column from the right memorializes the queue (or ranked) standings of current readings over a 25-year span. The result of this exercise is to find German orders, output, real sales, and all of the surveys with the rankings below their 50-percentile mark, putting them all below their medians for the last 25 years. This is in sharp contrast to ‘other Europe’ where France, Spain, Portugal, and Norway all have rank standings at about the 75th percentile or higher when we compare growth rates over the last year to what they have done over the last 25 years. Clearly Germany is lagging badly.

  • German orders expressed in real terms fell by 1% in June after falling by 0.8% in May. Foreign orders fell by 3% month-to-month after rising 3.8% in May. Domestic orders came back to life rising by 2.2% in June but only after a sharp 7.5% drop in May; that drop had been preceded by a 2.8% increase in April. The gyration and trend performance of orders is still choppy and, for the most part, weak.

    Order trends Sequential growth rates show that overall orders for Germany (still expressed in real terms) rose by 0.6% over 12 months; however, they fall at 4.7% annual rate over six months and fall at a 0.5% annual rate over three months. Foreign orders rise by 7.4% over 12 months; over six months the gain is at a 13.7% annual rate, and over three months that pace is reduced to a 7.3% annual rate. German domestic orders fall by 8.6% over 12 months, then decline at an extremely rapid 26.1% annual rate over six months, and continue to decline at 11.1% annual rate over three months. For the time being, orders have been propped up by strength in the international market while domestic orders continue to languish and to contract.

    Real sales Sector sales, expressed in real terms, rose by 1% and those across all the components after seeing widespread contractions in May that had followed an uneven performance in April. Real sales for manufacturing fall by 1.5% over 12 months, fall at a 1.9% annual rate over six months, and fall at an annual rate of 9.2% over three months. Real sales trends are not reassuring.

    European Surveys on Industry Survey results for the largest economies in the European Monetary Union show slippages in June compared to May as three of the four large economies weaken (with Italy being the exception). Over three months France logged a weaker reading compared to six-months, Germany improved, Italy's performance is unchanged; Spain reports a result that's better by a single tick on the survey index comparing 3-months to 6-months. Comparing the 12-month to averages to 3-month averages for the four large European economies, shows deterioration that's across the board with the slight exception of Italy.

    Quarter-to-date (completed Q2) The quarter-to-date (QTD) performance in Germany for orders are strong, rising at a 13.1% annual rate. Sector sales show deteriorated real sector sales across most sectors on QTD basis; manufacturing sales fall at a 2.9% annual rate.

    Longer term evaluations The two right hand columns evaluate the growth and level performance of these various metrics on real sector sales and on a level basis and well as on annual growth rates. Total orders and foreign orders ranked on levels are well above their 50% mark, which puts them above their median on data back to 1994. Domestic sales levels have only a 21.8 percentile standing, extremely weak. Rankings on growth rates show total orders at a 45.9 percentile ranking, below the median growth rate (which occurs at a ranking of 50%). However, foreign orders’ growth ranks in the 70th percentile, quite firm, while the domestic growth rate queue ranking resides in the lower 10.7 percentile of its range. Growth rates for real sector sales are mostly below their 50-percentile mark except for consumer nondurables and consumer goods sales overall (which, of course, are boosted by the sales of consumer nondurables). The industrial confidence indicators for European economies that are from diffusion surveys are evaluated relative to historic levels only. All of them score weak results. The best queue standing is Spain with a 37.5 percentile standing, followed by Italy at a 24.8 percentile standing. France has a 14.6 percentile standing, while Germany has a 7.4 percentile standing. These range from weak, and below median, to very weak.

  • The S&P Global PMI indexes once again showed mixed performance in July. Most large economies continue to do better, and the total PMI services sectors continue to make up for shortcomings in manufacturing.

    Stability on a low growth path In July, 24% of the reporting countries showed activity was slowing; that's down from 48% in both June and May and indicates some progress. Only five of the reporting jurisdictions have PMI values below 50 indicating economic contraction in July; that July figure compares to five in June and seven in May. Declining activity continues to be an unusual event. Medians and average readings for the group of 25 countries or regions show extreme stability in the recent months as well as across sequential averages.

    Growth moderately improves Comparing period averages from 12-months to six-months to three-months, unweighted readings of the U.S., the U.K., and European monetary union show extremely flat PMI values oscillating between values of 51.2 to 51.7 on those period averages; over three months, six months, and 12 months. The jurisdictions in the table show PMI readings below 50 are rare; once again declining activity is an unusual event. The proportion of reporters slowing over three months is 34.8% compared to 52.2% over six months and 30.4% over 12 months. Once again, we see these statistics tilted toward improving growth rather than towards slowing

    Summing up The queue percentile standings for the group in July have an average value at 48.4% which is below the 50% mark that coincides with the median for the period. This tells us the growth is largely worse than what its median has been over the past 4 1/2 years. On a queue ranking basis, the largest economies consistently perform better with readings above the 50% mark for the U.S. and for the European Monetary System including each of its four largest EMU economies (Germany, France, Italy, and Spain). Japan has a queue standing in its 57th percentile. However, China’s percentile standing is in its 26th percentile and the U.K. is at its 40.5 percentile. Not all large economies are in the catbird seat, but most are faring well despite the moderate growth track globally.

  • Manufacturing PMIs in the S&P framework were mixed in July. However, the median reading edged slightly higher rising to 48.6 in July from 48.5 in June. But both of these are significantly weaker than the 49.1 reading in May. Manufacturing continues to post PMI readings that are below 50 indicating sector contraction on a fairly broad basis in July among the 17 reporting countries in the table plus the euro area. Only India and Vietnam reported PMI readings above 50 indicating sector expansion in July. In June, three of these jurisdictions showed readings above 50; in May, only three had readings above 50 as well. It remains a difficult time for manufacturing globally.

    The readings for the manufacturing PMIs also show slippage in the medians from 12-months to six-months to three-months. The 12-month median is 49.2, the six-month median at 48.8, and the three-month median at 48.7. The bottom line is that most manufacturing sectors show contraction, and the contractions are generally getting slightly worse.

    However, on an individual basis over three months about two-thirds of the reporters showed an improvement. Over six months just under 40% showed improvement and over a year about 44% of them showed improvement compared to the year before. Only the three-month versus six-month comparison shows a majority of reporters indicating better performance in July.

    The ranked or queue standings metrics that place these individual readings for July in their queue of data over the last 4 ½ years, show standings above 50% which put the individual readings above their medians for this period. And only six of these eighteen reporting jurisdictions sported readings above 50%. Those were for the euro area, Germany, France, and India. India has a rating well above 50% at its 96th percentile; Malaysia has a reading above 50% and Vietnam has a reading well above 50% at its 74th percentile.

  • Europe
    | Jul 31 2025

    Unemployment in EMU

    The overall EMU-wide and EU-wide unemployment rates were steady in June. For the EMU the rate is 6.2% and for the EU the rate is at 5.9%. According to data back to January 2020, the EMU rate has been this low or lower 1.3% of the time while the EU rate has been this low or lower 2.6% of the time. The EU rate at 5.9% is just above its all-time low (of 5.8%) on this horizon while the EMU rate remains at 6.2%, which is its all-time low on this horizon.

    In June, four of twelve reporting EMU members logged month-to-month drops in their unemployment rates against only two where unemployment rates rose. This compares to May when seven members reported lower rates of unemployment. In April, nine reported unemployment rate drops.

    Sequential data over 12 months, six months and three months show unemployment rates falling in six of 12 EMU members, over all three horizons: three-months, six-months, and twelve-months.

    Among the 12 reporting members in the table, only three have unemployment rates above their respective medians since 2000 (rankings above 50%) in this period.

    Elsewhere the U.S. unemployment rate fell in the month and was otherwise stable over the past year. The U.K. claimant rate of unemployment has snake higher beginning in May. Japan’s unemployment rate remains anchored at 2.5%. Among these three countries, the U.K. has an unemployment rate above its historic median at 62.7%.

    European growth has been slow as the emerging GDP data for 2025-Q2 are confirming. But the labor market in Europe remains very solid. Inflation seems to be winding down in Europe. Europe may even be in for some growth turbulence because of the new U.S. tariff policy. However, for now, the labor market looks quite solid, and growth remains the orders of the day even if it is slow.

  • GDP growth in the European Monetary Union slowed to an annual rate of 0.4% in the second quarter of 2025 after logging a very solid 2.3% growth rate in the first quarter. Year-over-year growth has slipped to 1.4% in the second quarter compared to a 1.5% year-over-year pace in the first quarter; however, the second quarter year-over-year growth rate is still a little ahead of the fourth quarter pace in 2024 when it grew by only 1.3% and it is stronger than the third quarter of 2024 when it grew at a 1% pace. While EMU GDP growth has slowed quarter-to-quarter, the year-over-year pace has a moderate ranking. The pace ranked on all growth rates since 1997 leaves the year-over-year pace of 1.4% at a 42.4 percentile standing; that's below its median for the period (the median occurs at a ranking of 50%). However, it's not that short of the median and it indicates that growth is moderately slower than it's been over the past period back to 1997.

    Growth by Size The Four Largest: The four largest economies in the monetary union grew at a 0.5% annual rate in the second quarter, compared to 1.2% in the first quarter and 0.8% in the fourth quarter of 2024. The four largest EMU economies (Germany, France, Italy, and Spain) have GDP-weighted growth of 0.8% over four quarters, the same as in Q1. That growth rate ranks in its 37th percentile, well below its median pace since 1997.

    The Rest: The ‘rest of EMU’ grew at a ‘technically positive’ annual rate of 0.1% in 2025-Q2. That slow-crawl is quite weak, but it follows a 5.3% pace in Q1. The rest of EMU grows at a very solid 3% pace year-over-year in 2025-Q2 and logs 3.0% or better growth rates for three quarters in a row. The year-over-year pace ranks in the top one-third of all growth rates for the rest of EMU group since 1997-Q4. While the Q2 pace is very slow, in context, it does not seem to be an issue.

    EMU Median Growth: The median growth rate for all of EMU is considerably weaker overall than the growth for the Rest of EMU. In 2025-Q2, however, the median pace is 0.7%, down from 1.1% in Q1. The year-on-year pace over the past four quarters for the EMU has been gradually slowing and is at 1.1% year-over-year pace in 2025-Q2. That growth rate for all of EMU is weaker than the ranking for the large countries as well as for the rest of EMU.

    Compared to the U.S. Growth in the U.S. jumped to 3% in Q2 and logged a year-on-year pace of 2.0%. The U.S. logs the third strongest year-on-year pace in the table for Q2. Still, compared to its own historic experience, the U.S. growth rate ranks poorly in its 31.8 percentile, the lower third of its historic queue of growth rates. In relative terms, only two EMU member countries in the table rank lower.

  • The severe lethargy in U.K. retail and wholesale sales continues into July with the outlook portion of the survey for August still exceptionally weak.

    Distributive sales retail volumes Sales in July: In July, the distributive trades volume survey finds sales for a year ago with 34% of the respondents indicating weaker sales compared to those indicating stronger sales. This net reading of -34 is a slight improvement from June’s -46 and signals deterioration compared to May (-27) as well. However, beyond the monthly bumping up and down, the ranking of this net reading is in the lower 8.5 percentile marking it as truly an exceptionally weak reading. The reading for orders compared to a year ago shows better comparisons but still a great deal of weakness and a net reading of -21, compared to -51 in June and -41 in May. It marks a 20th percentile standing, which is better than for sales compared to a year ago but still exceptionally weak. The next reading that, essentially is seasonally adjusted, comparing sales for the same time of year, shows a -10 reading which is better than -37 in June and better than May’s reading of -19 and steps up to a percentile standing at its 42nd percentile. It is still short of its median (which occurs at a ranking of 50%) but is a reading that looks a little closer to the land of the living than the land of the dead.

    Expected sales in August: The distributive volumes statistics for sales expected for August, looking a month ahead, shows negative readings across the board for these same 3 metrics with all three of them improving in August from their July expectations; however, sales compared to a year ago have a 7-percentile standing, even weaker than their current July reading, orders have a 23.5 percentile standing, and sales for the time of year fare much worse with a 6.7 percentile reading - much worse than the current performance ranked for July. In short, there's very little in this survey that is encouraging or reassuring. Conditions are weak and even where there is improvement the new reading is still very weak and the expectations readings, while somewhat improved, are still extremely weak.

    Distributive sales wholesale volumes Sales in July: The distributive trades survey for wholesaling produces another set of weak readings that are, for the most part, weaker in July than they were in June and, while different, not much better, or worse than they were in May. The percentile standings for wholesaling show sales compared to a year ago at a 7.4 percentile standing, orders compared to a year ago at a 3.2 percentile standing, and sales for the time of year at a 1.8 percentile standing. All of these are simply exceptionally weak.

    Expected sales volumes in wholesaling: Turning to the expected sales for August once again, all the readings are net negatives; two out of three of them show some improvement compared to their July values; however, the rankings remained exceptionally weak. Sales compared to a year ago are at a 9.1 percentile standing, orders compared to a year ago are at a 5.3 percentile standing, and sales for the time of year are at a 2.1 percentile standing. The results for expected sales and orders in the wholesaling survey are extremely grim.