Industrial production in Germany fell by 1.9% in June and continues to show weak performance on trend. Yesterday's report on German industrial orders was weak. The table below on German industrial production shows the orders results presented with other output data and industrial surveys for Germany and some other key European economies that report manufacturing and industrial data early.
Today's industrial report shows a 1.9% decline in German industrial production in June after slipping 0.1% in May and falling by 1.6% in April. The three-month annual rate change in industrial production is a decline of 13.4% at an annual rate; that stepped up from a 1.8% annual rate decline over six months and from a 3.5% annual rate decline over 12 months.
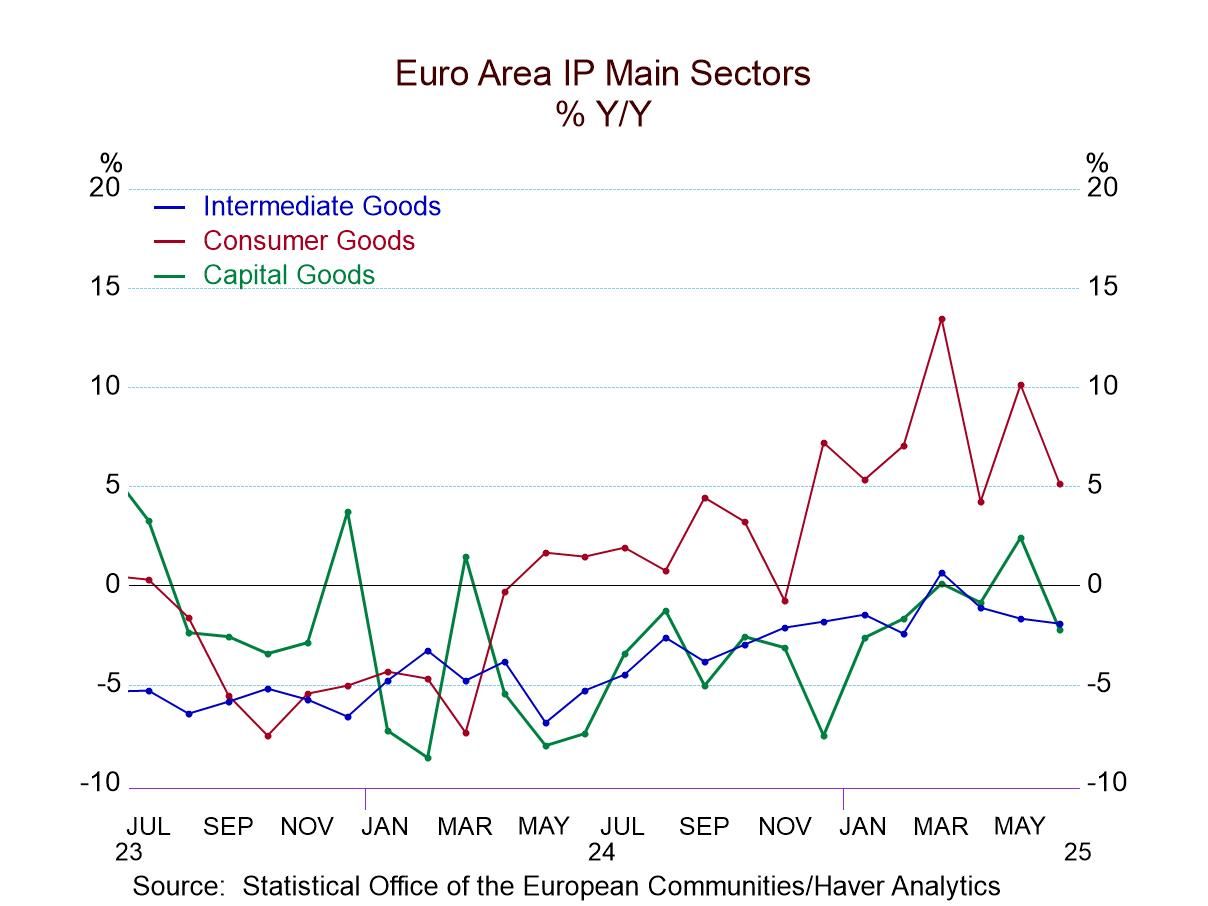
Broad sector-wide manufacturing weakness
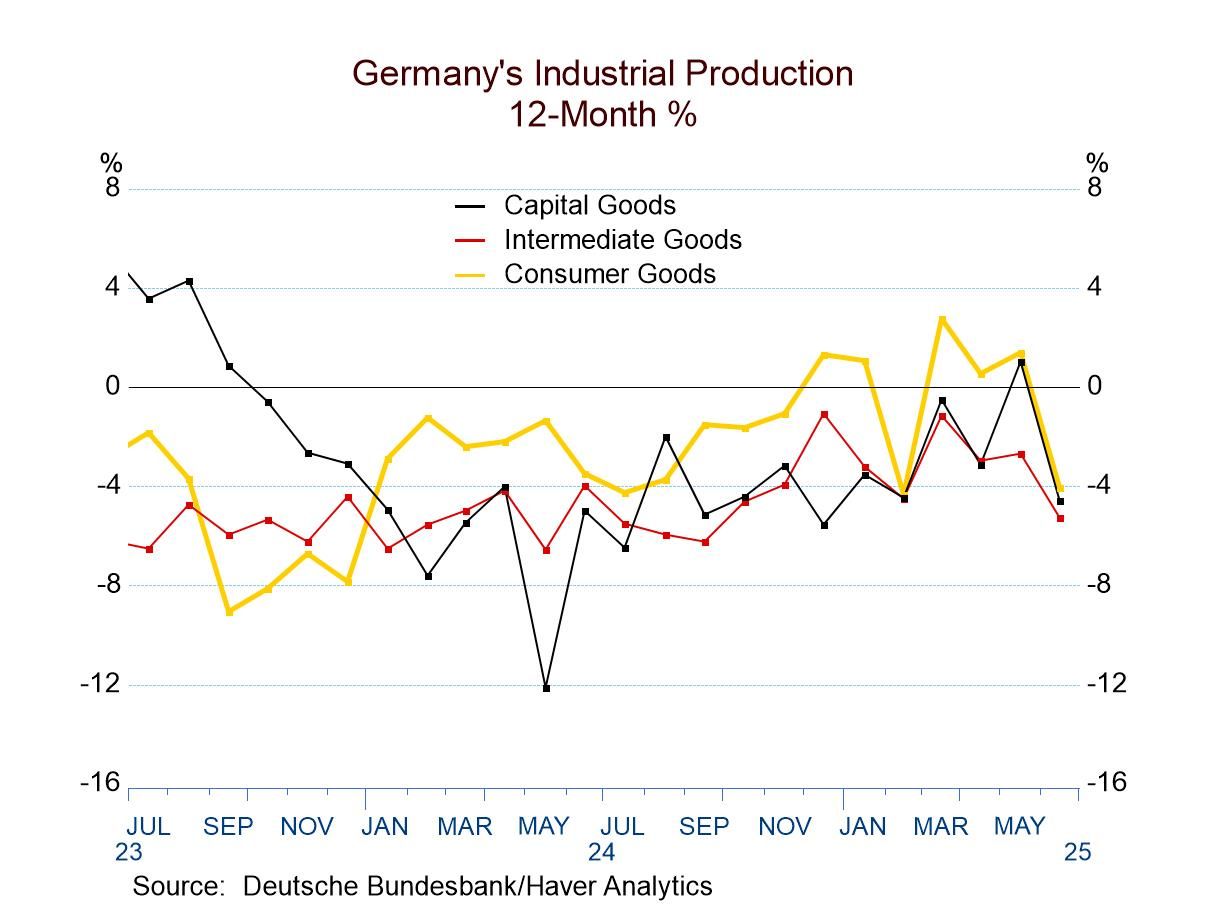
Consumer goods output fell an outsized 5.6% in June. The sequential annualized growth rate for consumer goods is -4% over 12 months, -6.3% over six months and -22.7% over three months - an accelerating pace of decline. Capital goods output fell by 3.2% in June. Its sequential pattern is not as clear a decelerating pattern as for consumer goods, but it's substantially indicative of the same trend with a 4.6% decline over 12 months, an annual rate decline of 2.2% over six months and then a stepped-up decline of 19% at an annual rate over three months. Intermediate goods output fell by only 0.6% in June, but it has a string of negative values coming into June. Its sequential growth rates show a drop of 5.3% over 12 months, a drop at a 1.2% annual rate over six months, and then an outsized drop of 16% at an annual rate over three months. The profile for German industrial production is extremely weak, broad, and disappointing.
Construction weakness as well
Construction output rose by 1.3% in June; however, it's coming off of declines in both May and April and its sequential growth rates become progressively weaker from 12-months to 6-months to 3-months, culminating in a -9.9% annual rate decline over the last three months.
Industrial surveys are more upbeat
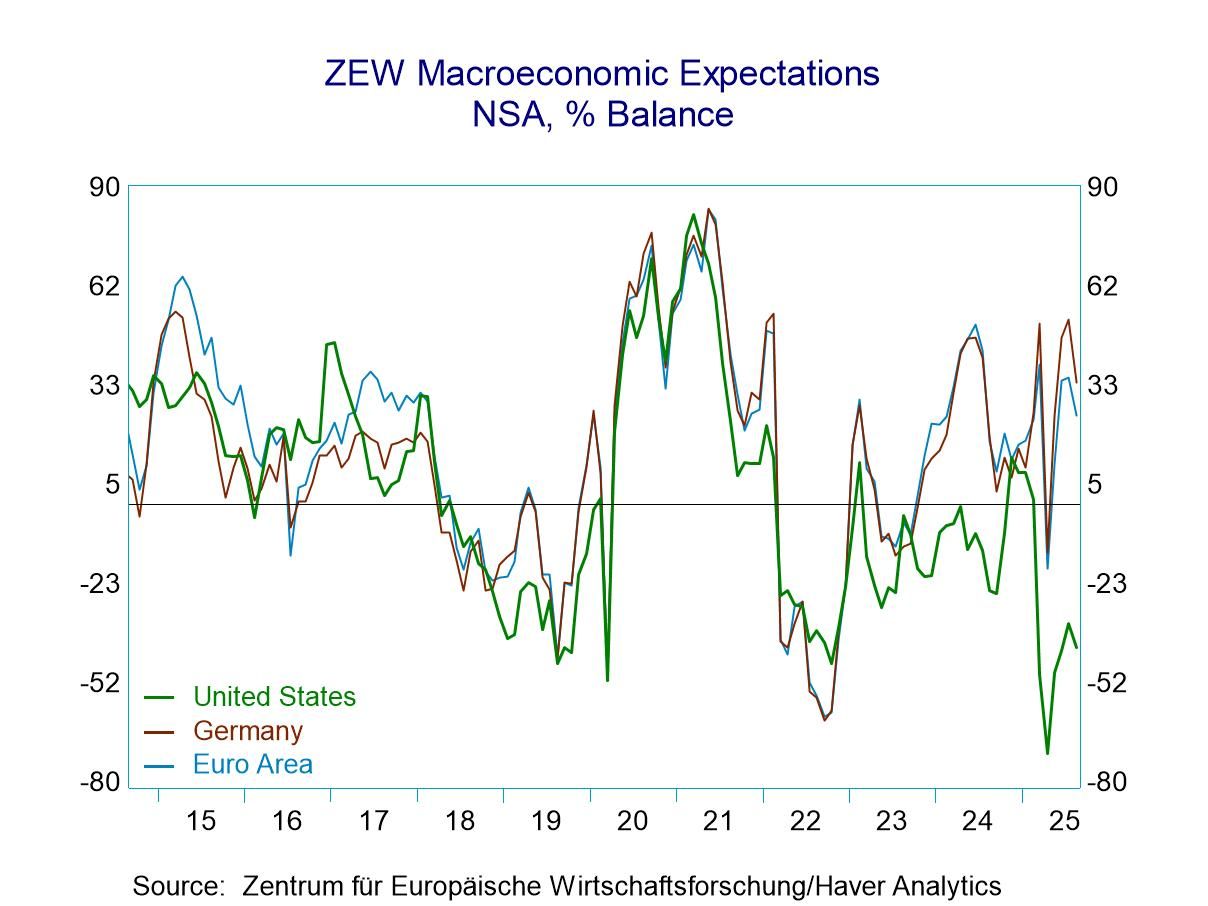
Surveys of industrial conditions in Germany are actually more positive than the orders data from yesterday or the industrial production data in today's report. The ZEW current reading shows an improvement from May to June as well as from April to June. The IFO manufacturing survey shows no change in the index in June compared to May, but it's stepped up compared to April. IFO manufacturing expectations show improvements in a sequence, from April to May to June. The EU Commission industrial survey shows deterioration in June compared to May and also in June compared to April- it is the survey ‘outlier.’ The sequential survey averages over 12 months, six months, and three months for all four surveys show improved readings over three months compared to the respective 12-month averages. The survey data are more encouraging than either the output or the orders data.
Other European trends
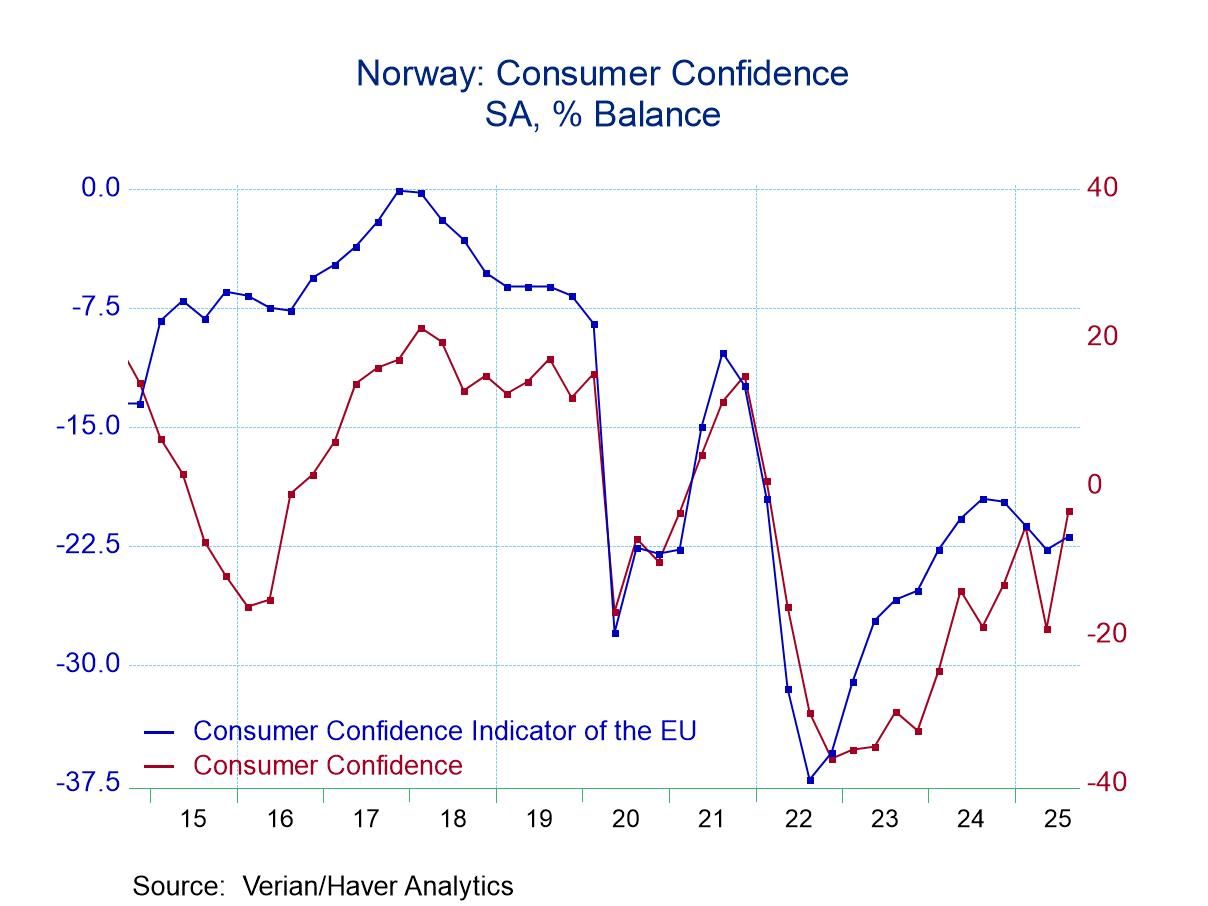
Manufacturing trends for other early reporting European countries, France, Spain, Portugal, and Norway, show largely better performance in June for these countries compared to the German results. Portugal's June report is an exception; a 3.6% decline in output in June is large. However, over three months, all four of these European countries have better performance than Germany. Portugal still logs in decline in output but a decline of only 0.4%, much better than the numbers reported by Germany over three months. In each of these countries France, Spain, Portugal, and Norway, there were increases in output over 12 months ranging from 2.4% in France to 4.1% in Norway, as German output fell by 3.5%.
Quarter to date (Q2-results)
Quarter-to-date (QTD) IP shows declines for all these German measures; the sole increase among the German indicators is for real manufacturing orders. Surveys for Germany on a QTD basis show positive changes compared to the previous quarter. The other European countries show strength, a 15.9% rise in output in France, a gain of 1.6% at an annual rate in Spain, a smaller 1.3% annual rate decline in Norway, against a sharp 10% annual rate reduction in output in Portugal for the quarter to date.
Ranked performance of growth rates and surveys
The second column from the right memorializes the queue (or ranked) standings of current readings over a 25-year span. The result of this exercise is to find German orders, output, real sales, and all of the surveys with the rankings below their 50-percentile mark, putting them all below their medians for the last 25 years. This is in sharp contrast to ‘other Europe’ where France, Spain, Portugal, and Norway all have rank standings at about the 75th percentile or higher when we compare growth rates over the last year to what they have done over the last 25 years. Clearly Germany is lagging badly.

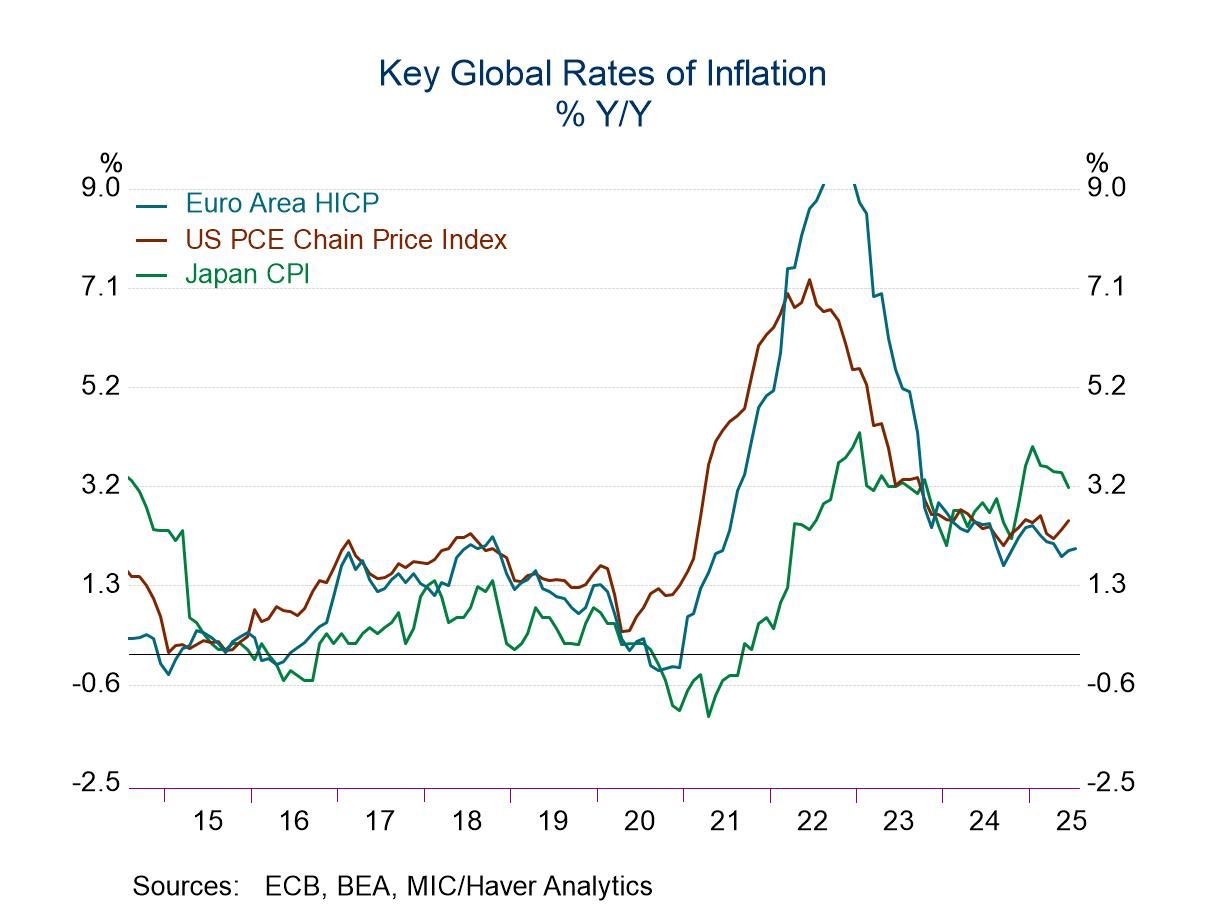
 Global