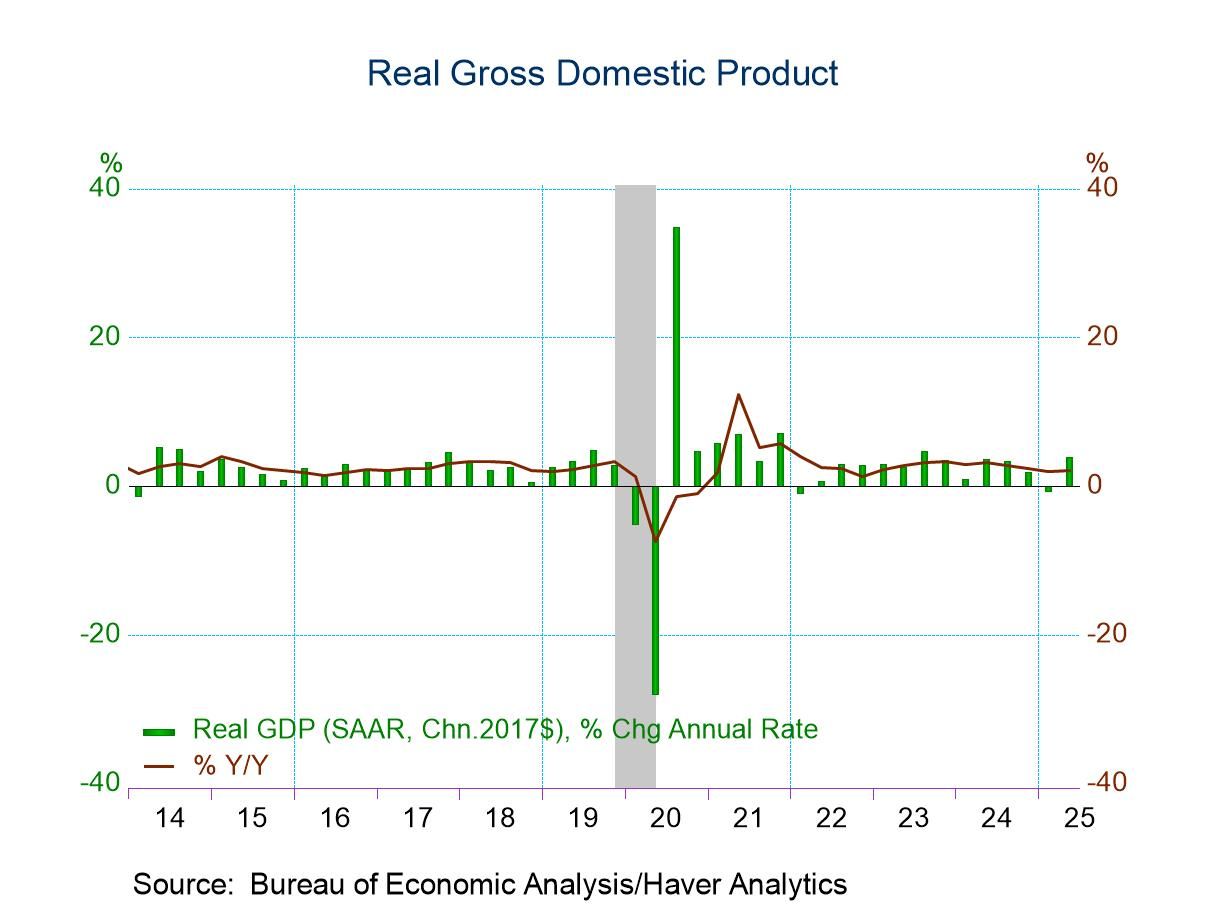
- Real GDP advanced at a 3.8% saar in Q3 in the third estimate, up from 3.3% in the second estimate and 3.0% in the advance report.
- Stronger consumer spending and business fixed investment were the major factors behind the upward revision.
- Meaningful upward revisions to measures of aggregate demand.
- Small upward revision to GDP and PCE inflation.
- Annual benchmark revision benign; annual real GDP growth from 2019 to 2024 was unrevised at 2.4%.
Introducing
Sandy Batten
in:Our Authors
Sandy Batten has more than 30 years of experience analyzing industrial economies and financial markets and a wide range of experience across the financial services sector, government, and academia. Before joining Haver Analytics, Sandy was a Vice President and Senior Economist at Citibank; Senior Credit Market Analyst at CDC Investment Management, Managing Director at Bear Stearns, and Executive Director at JPMorgan. In 2008, Sandy was named the most accurate US forecaster by the National Association for Business Economics. He is a member of the New York Forecasters Club, NABE, and the American Economic Association. Prior to his time in the financial services sector, Sandy was a Research Officer at the Federal Reserve Bank of St. Louis, Senior Staff Economist on the President’s Council of Economic Advisors, Deputy Assistant Secretary for Economic Policy at the US Treasury, and Economist at the International Monetary Fund. Sandy has taught economics at St. Louis University, Denison University, and Muskingun College. He has published numerous peer-reviewed articles in a wide range of academic publications. He has a B.A. in economics from the University of Richmond and a M.A. and Ph.D. in economics from The Ohio State University.

Publications by Sandy Batten
 USA| Sep 25 2025
Resilient Consumer Propels Upward Revision to Q2 2025 GDP Growth
by:Sandy Batten
|in:Economy in Brief
 USA| Sep 23 2025
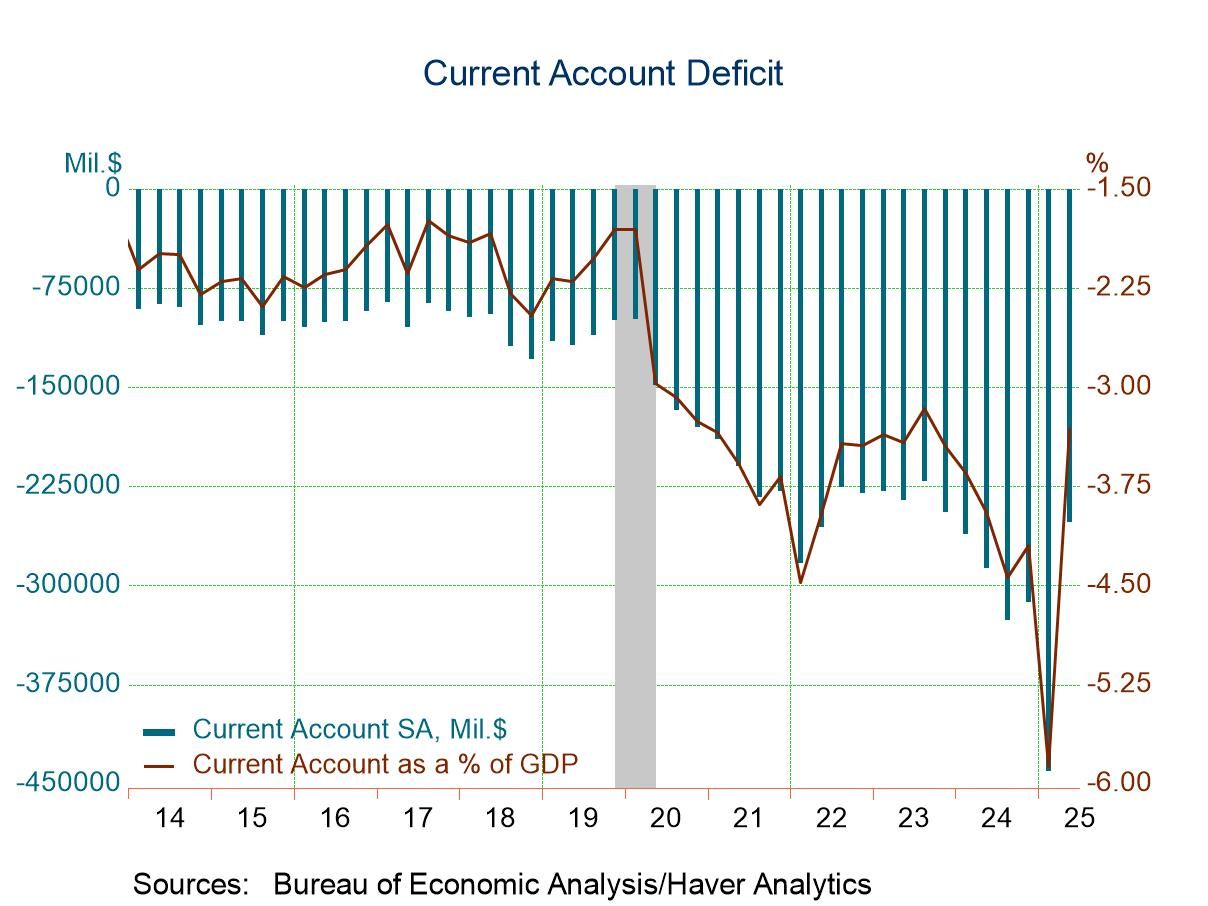
U.S. Current Account Deficit Narrows Markedly in Q2 2025
- Goods deficit narrows to smallest since Q4 2023 as goods imports declined 18.4% q/q, reversing the surge in Q1.
- Services surplus narrowed slightly from record high in Q1.
- Balance on primary income remained in deficit, a rare occurrence. Secondary income deficit narrowed marginally.
- Net financial-account transactions were -$406.9 billion in the second quarter, reflecting net U.S. borrowing from foreign residents.
by:Sandy Batten
|in:Economy in Brief
 USA| Sep 16 2025
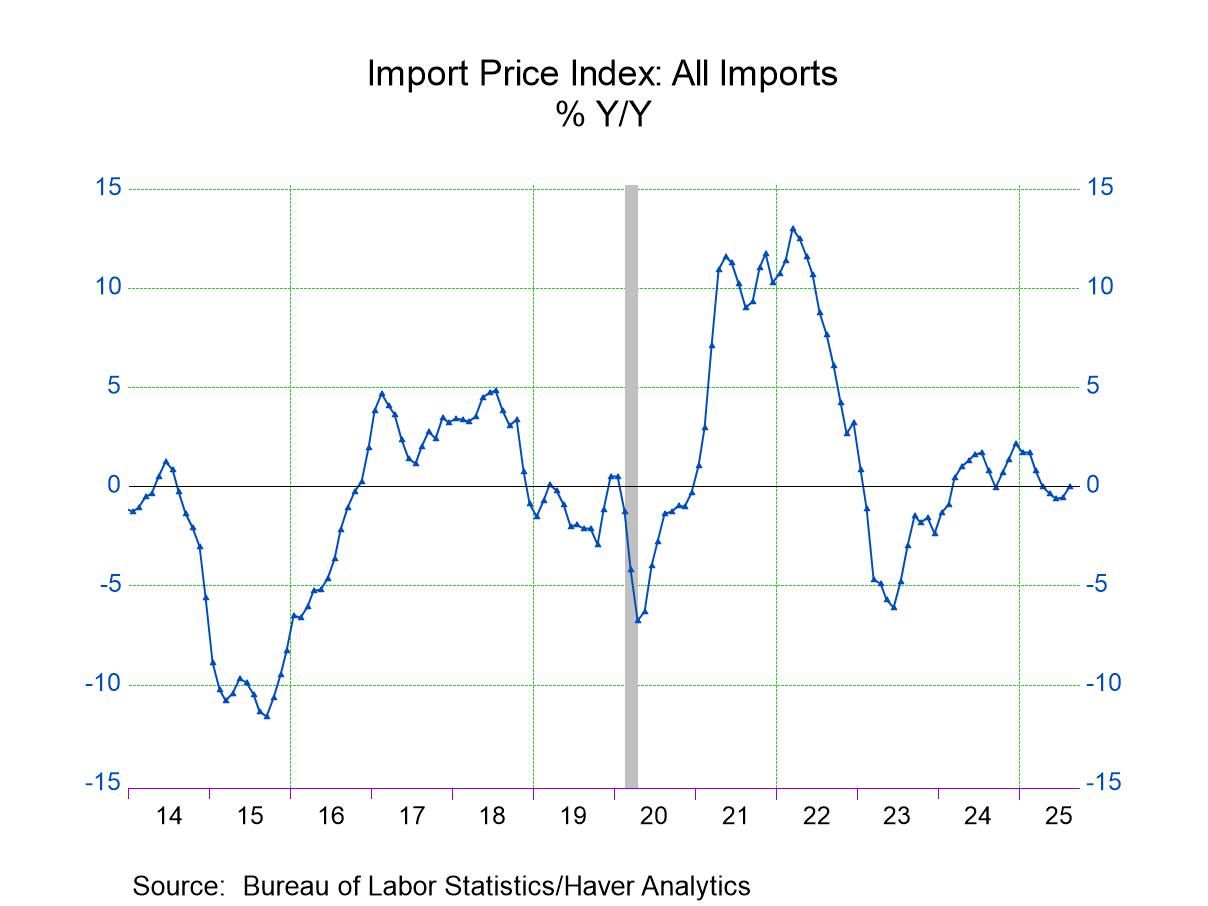
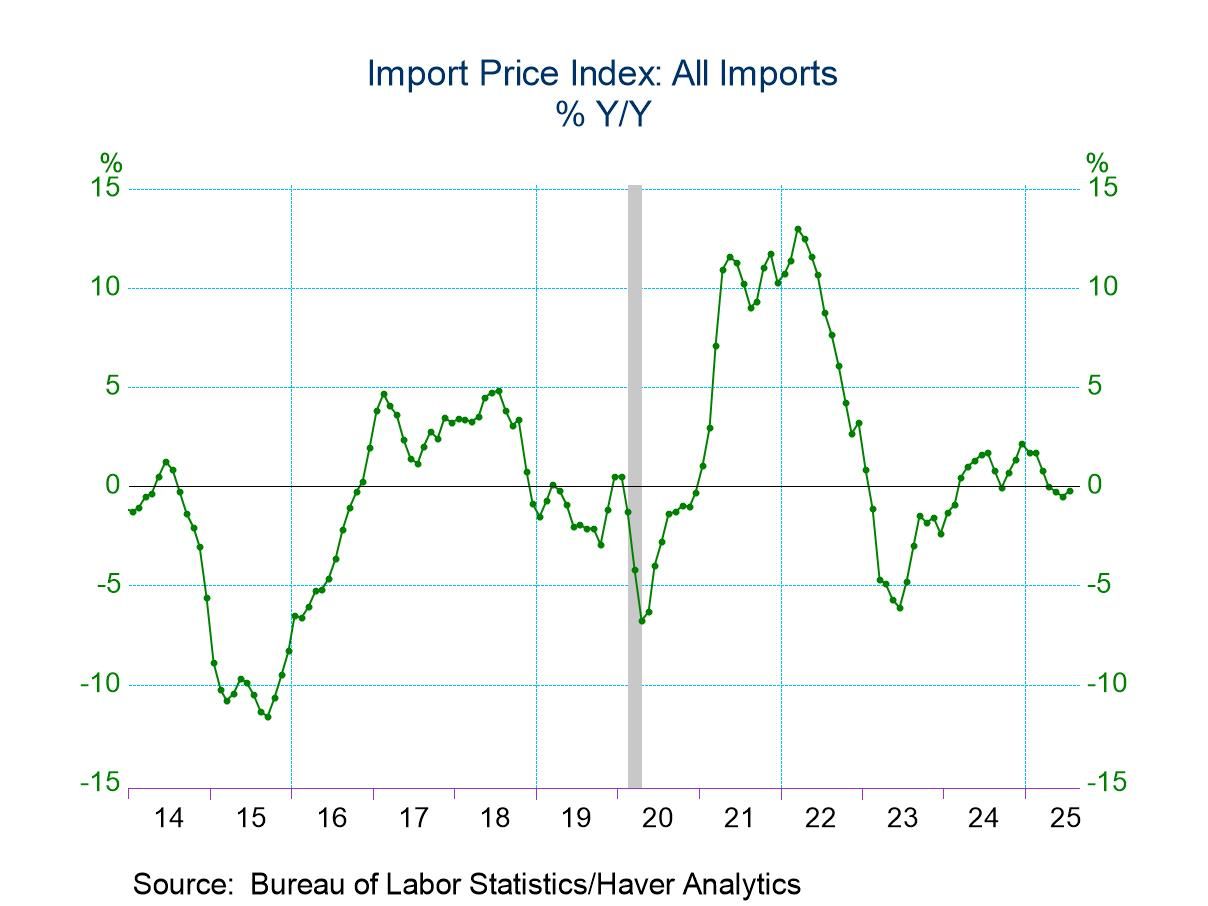
U.S. Import and Export Prices Unexpectedly Rose in August
- Import prices rose 0.3% m/m in August against expectations of a small decline.
- The August increase was due to higher prices for nonfuel imports as prices for fuel imports fell for the first time in three months.
- Export prices also rose 0.3% m/m against expectations of a small decline, reflecting higher prices for nonagricultural exports.
by:Sandy Batten
|in:Economy in Brief
 USA| Sep 16 2025
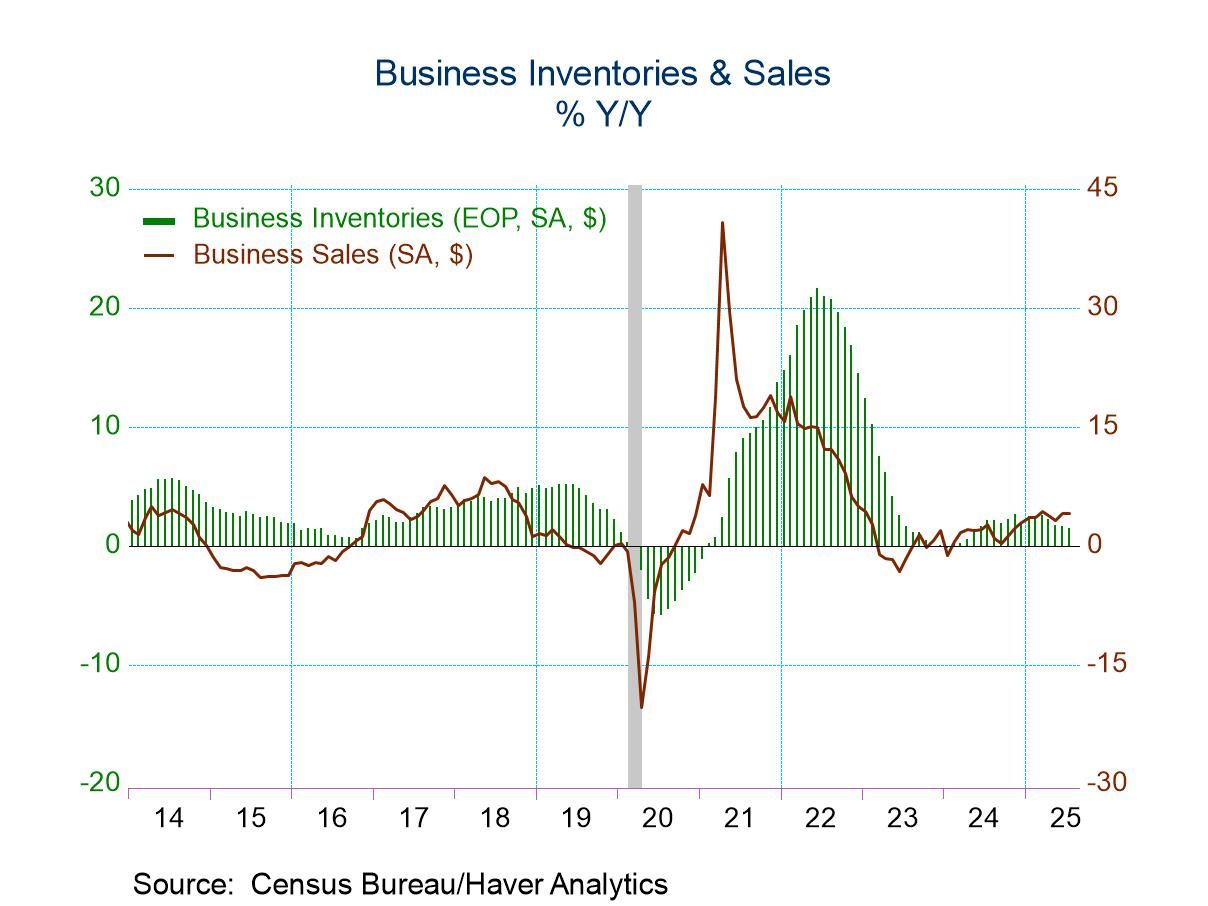
U.S. Business Sales and Inventories Rose in July
- Total business inventories increased 0.2% m/m in July with increases across sectors.
- Total business sales climbed 1.0% m/m in July, their largest monthly gain since February.
- With sales advancing more than inventories, the inventory/sales ratio fell to 1.37, its lowest reading since July 2022.
by:Sandy Batten
|in:Economy in Brief
 USA| Sep 04 2025
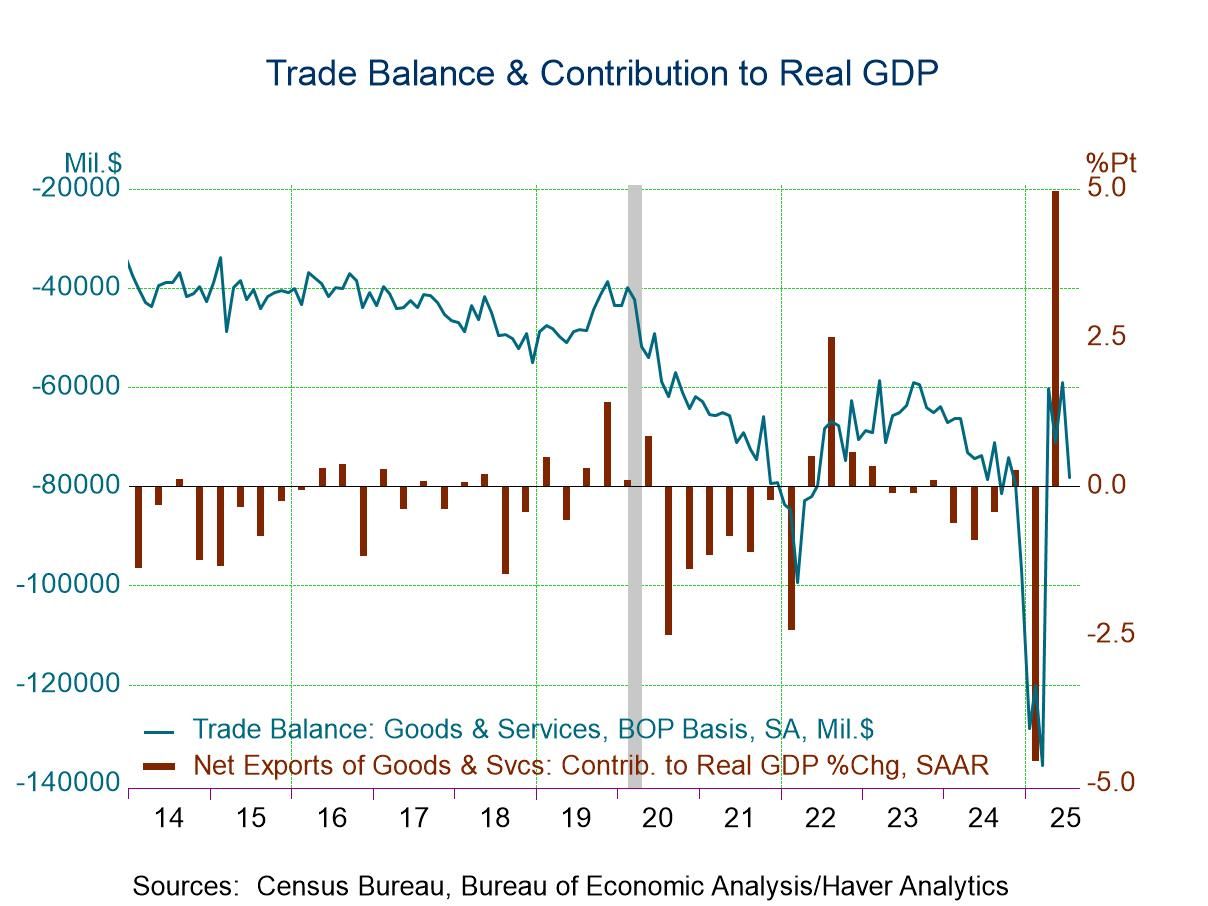
U.S. Trade Deficit Widened in July
- The trade deficit widened to $78.3 billion in July from $59.1 billion in June.
- This was the largest deficit since March.
- Exports rebounded, increasing by 0.3% m/m after a 0.3% m/m decline in June.
- Imports surged, rising 5.9% following a 3.6% decline in June.
- The July import surge was led by imports of industrial supplies.
by:Sandy Batten
|in:Economy in Brief
 USA| Sep 04 2025
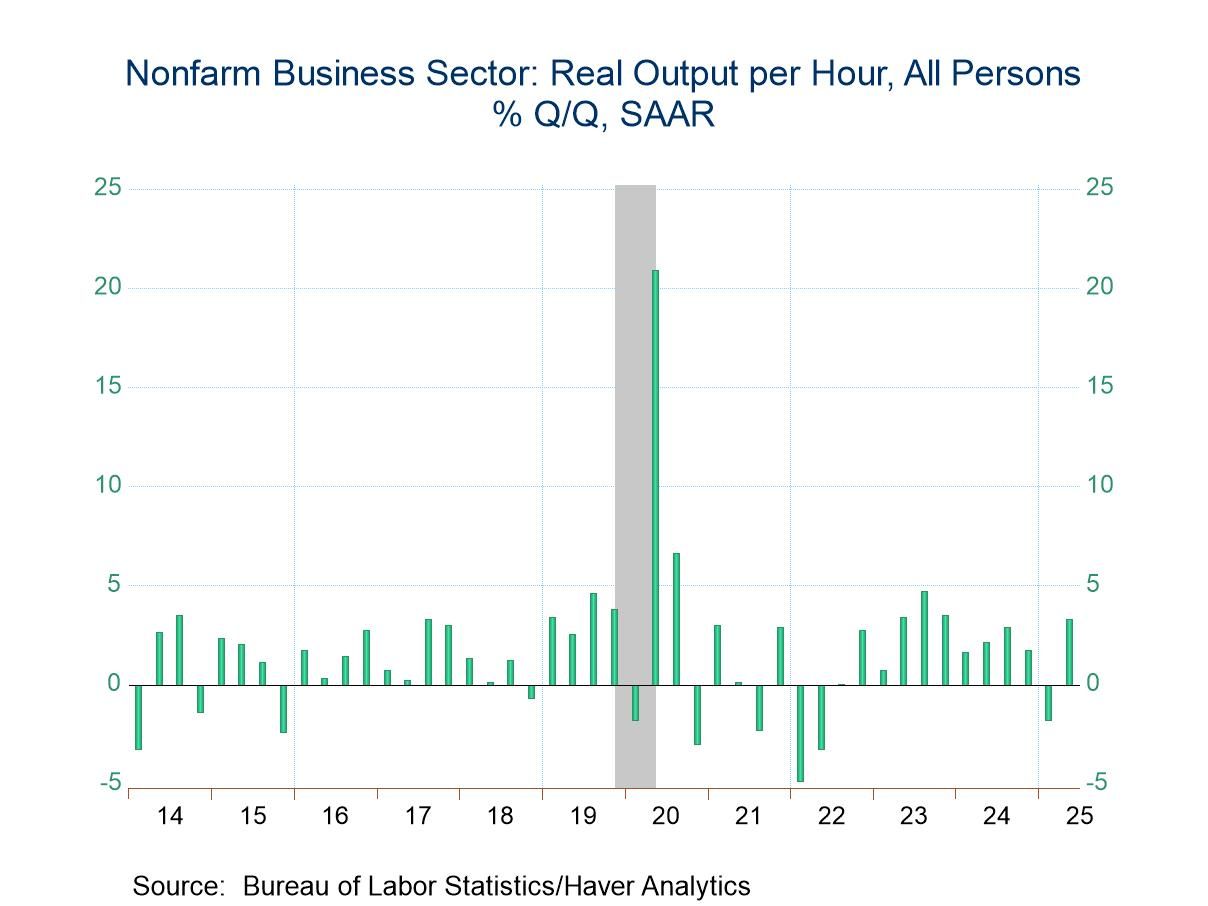
U.S. Nonfarm Labor Productivity Revised Up for Q2
- Productivity jumped 3.3% saar in Q2, up markedly from 2.4% in the advance report.
- This is the largest quarterly rise in productivity since Q4 2023.
- Growth in nonfarm output was revised up to 4.4% from 3.7% previously while growth of hours worked was revised down to 1.1% from 1.3%.
- Compensation growth was revised up but the large upward revision to productivity still enabled growth of unit labor costs to be revised down.
by:Sandy Batten
|in:Economy in Brief
 USA| Aug 28 2025
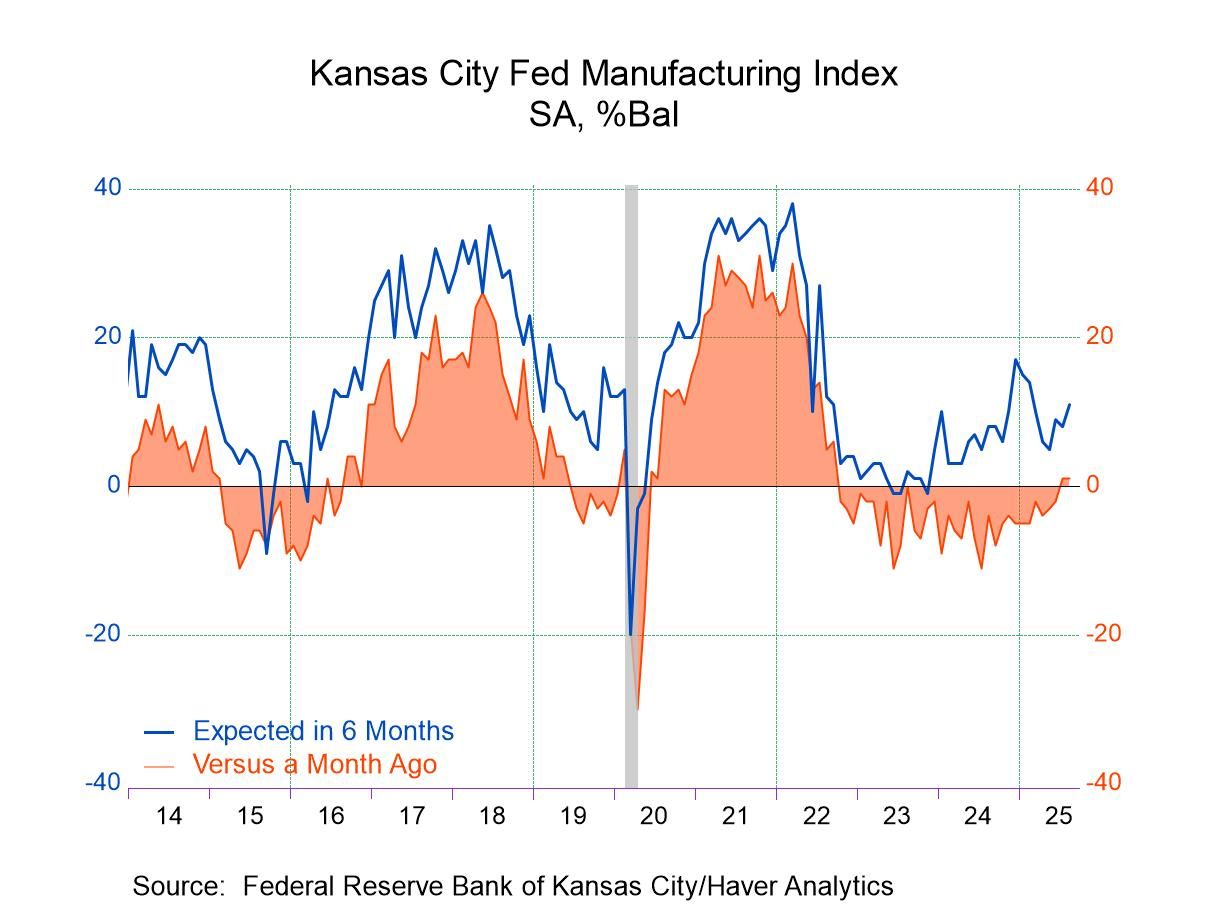
FRB Kansas City Manufacturing Index Unchanged in August
- Index remained (though barely) in positive territory for the second consecutive month, indicating that manufacturing activity was inching up.
- Prior to last month, the index had been negative for 22 consecutive months.
- Positive readings across most key components.
by:Sandy Batten
|in:Economy in Brief
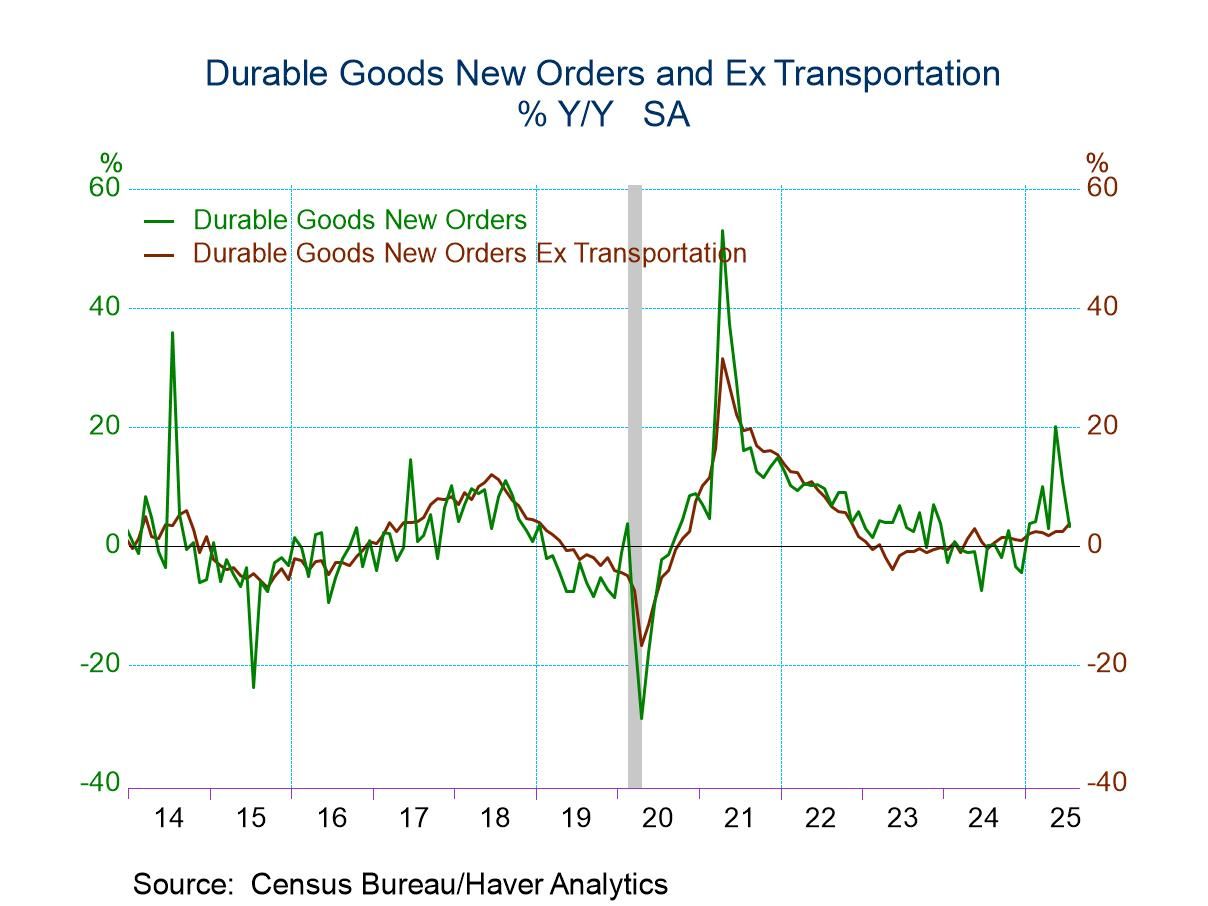
- Durable goods orders fell 2.8% m/m in July on top of a 9.4% monthly drop in June.
- Once again, weak nondefense aircraft orders were the key factor; nondefense aircraft orders plunged 33% m/m in July on top of a 53% m/m decline in June.
- In contrast, orders excluding transportation rose a solid 1.1% m/m in July, their largest monthly gain since September 2024.
- Core capital goods orders rebounded, and shipments posted a solid gain.
by:Sandy Batten
|in:Economy in Brief
 USA| Aug 21 2025
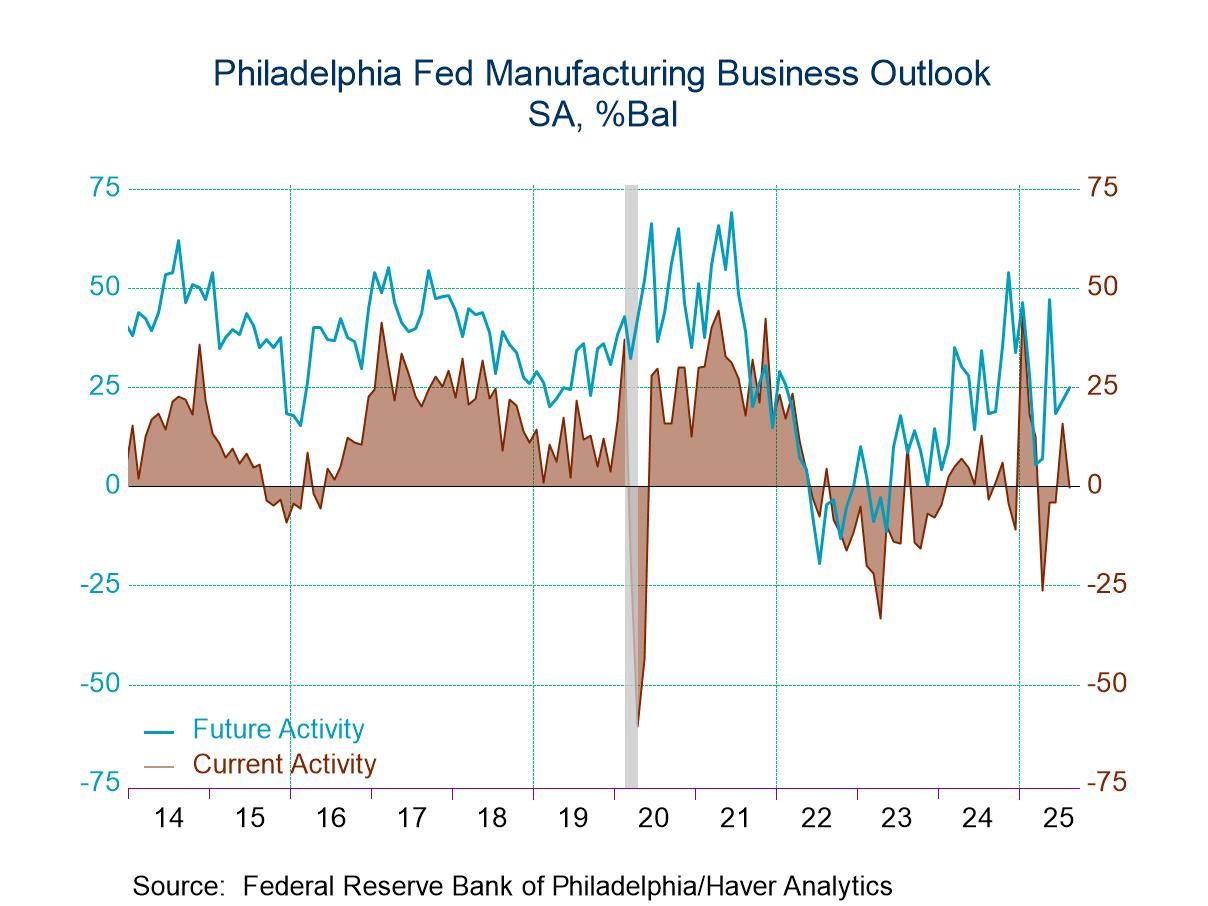
U.S. Philly Fed Manufacturing Index Dipped Below Zero in August
- The headline index fell more than 16 points to -0.3, led by outsized declines in both new orders and shipments.
- The ISM-adjusted composite fell below the critical 50 level for the first time in four months, also pointing to a decline in activity.
- Delivery times shortened further while both prices paid and prices received indexes posted gains.
by:Sandy Batten
|in:Economy in Brief
- The highest reading since November 2024.
- The August rise was led by stronger new orders and continued gains in shipments.
- More evidence of nascent supply-chain problems.
- Outlook six months ahead faded slightly.
by:Sandy Batten
|in:Economy in Brief
 USA| Aug 15 2025
U.S. Import Prices Rebounded in July
- Import prices rose 0.4% m/m in July against expectations of no change after declines in both May and June.
- Higher prices for imported petroleum and natural gas drove the July rebound.
- Export prices ticked up 0.1% m/m, largely reflecting higher prices for nonagricultural exports.
by:Sandy Batten
|in:Economy in Brief
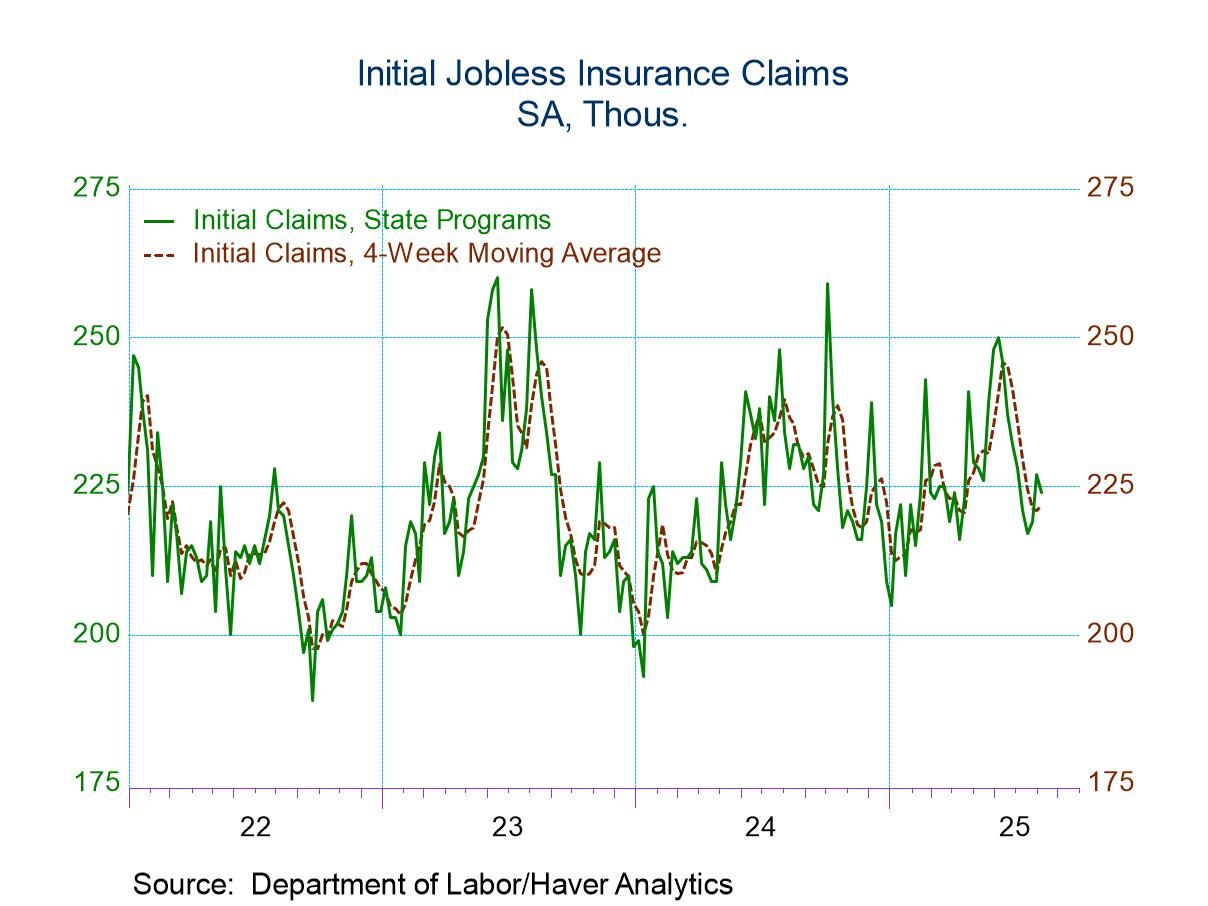
- New claims edged down to 224,000 from 227,000 in the previous week.
- Continuing claims fell to 1.953 million from 1.968 million.
- The insured unemployment rate was unchanged at 1.3%.
by:Sandy Batten
|in:Economy in Brief
- of57Go to 3 page