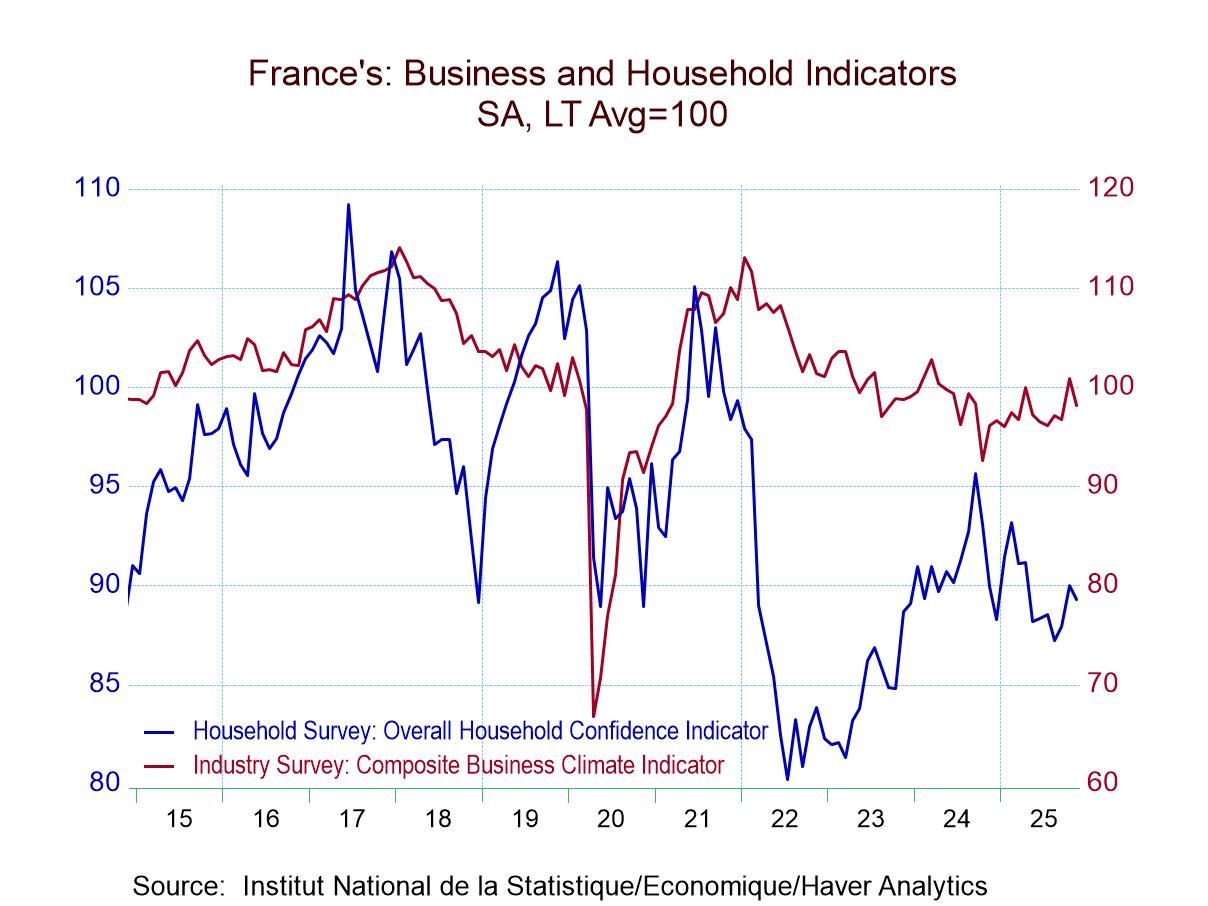
Haver Analytics
Haver Analytics

Economy in Brief

  • Netherlands
    | Feb 10 2025

    Dutch Production Falls

    Industrial production in the Netherlands fell by 1.1% in December and declined broadly across key categories. The output decline comes after two monthly rises in a row. Output has been vacillating, showing declines month-over-month in six of the last twelve months.

    Sequentially output (IP excluding construction, the headline series) is lower by 2.2% over 12 months, falling at a 1.6% annual rate over six months then rising at a 2.8% annual rate over three months. In the just completed Q4, output is falling at a 0.5% annual rate. On data back just before the start of COVID to January 2020, output is up by 0.5% a very narrow gain over such an extended period. Separately, ranking the year-on-year IP growth back to 2020, the current growth rate stands at the 20.4 percentile, near the boundary for the lower one-fifth of its queue of data. And the S&P manufacturing PMI gauge ranks on data back to January 2020 at its 35.4 percentile, also a low standing. However, they compare most closely to manufacturing, whose output growth rank is an extremely weak 3.7 percentile.

    The table and the chart combine to provide as clear a picture as we can get of the manufacturing sector. In the table, we see cross-currents as manufacturing performance varies by sequential period and, of course, increases as periods of calculation shorten. Over three months, all categories show output increases, except transportation, where output falls hard. Over six months, output falls in all main industries. Over 12 months, output falls in three-categories and rises in two. Sequentially overall output is improving, moving from weak and shrinking to growing. Manufacturing has the same pattern while transportation output trend consistently worsens. Food & beverages as well as mining & quarrying are without clear trend but both show increases over three months and 12 months and decline over six months.

    The queue rankings (on 12-month growth rates) for IP show strength for mining & quarrying with a 98-percentile standing for its 17.8% y/y growth. The food and beverage industry has an above 50%, standing at 55.6%. Manufacturing overall and transportation equipment have standing below their respective 15th percentiles.

  • This week, we explore potential opportunities in Asia if the US ultimately follows through with imposing tariffs on Canadian crude oil exports.

    We begin by acknowledging the US-Canada energy relationship, where Canada has become a dominant supplier of crude oil to the US over the years (chart 1). If a 10% tariff were imposed on Canadian crude, it could result in significant economic disruption for both nations. This reliance on Canadian crude highlights critical aspects of the US energy sector. Although the US is a net exporter of refined oil, it remains heavily dependent on Canada’s heavy, sour crude, particularly for refineries in the Midwest (chart 2). Additionally, fully and immediately replacing this crucial supply is challenging for US refiners, as alternatives like Venezuelan crude are politically unfeasible and currently lack the necessary scale (chart 3).

    However, what may seem disruptive to some presents a window of opportunity to others. With the recently operational Trans Mountain (TMX) pipeline, Canada has improved its access to Asian markets, and China has already begun absorbing a growing share of Canada’s crude oil output (chart 4). The competitive pricing of Canadian crude further enhances its appeal to China’s manufacturers and refiners (chart 5). While it may still be early for Canada to become a major supplier to China—given that countries from the Middle East, Russia, and Africa dominate the market—this shift signals potential for growth (chart 6).

    Nonetheless, the scope and intensity of US trade actions continue to evolve. Recently-announced policy measures include a 25% tariff on all steel and aluminium imports into the US, and observers are now awaiting "reciprocal" tariffs, as promised by US President Trump, set to be revealed later this week.

    The US-Canada energy relationship On February 1 this year, the United States initially announced a 10% tariff on energy imports from Canada, along with a 25% tariff on all other imports, as part of an effort to pressure Canada into addressing US concerns about illegal immigration and the flow of drugs across their shared border. In response, Canada initially announced retaliatory tariffs. However, the situation was temporarily de-escalated after a conversation between US President Trump and Canadian Prime Minister Trudeau. As part of the discussions, Trudeau agreed to ramp up security along the US-Canada border, leading to a one-month delay in the implementation of the tariffs.

    This exchange between the two countries sparked widespread debate on the potential consequences of such tariffs, should they be enforced in the future. One key aspect that emerged from the discussions was the critical energy relationship between the US and Canada. Specifically, Canada’s crude oil exports to the US have become increasingly dominant over the years, as illustrated in chart 1. This growing trend underscores Canada's importance as a key supplier of crude oil to the US, highlighting the potential economic ramifications of any trade barriers between the two nations.

    • Job gain is less than half of December’s rise.
    • Earnings growth improves.
    • Jobless rate edges down to early-2024 low.
    • Revolving credit posts record rise.
    • Nonrevolving credit strengthens.
  • President Trump’s tariff policies have been a major driver of financial market volatility in recent days, sparking sharp swings in equities and currencies. While the administration has temporarily reversed its proposal for a 25% tariff on imported goods from Canada and Mexico, uncertainty surrounding US trade relationships, the risk of retaliatory measures from key trading partners, and broader concerns about global growth continue to unsettle investors. A fundamental irony is that the US trade deficit—the very issue that President Trump purportedly aims to correct—is not primarily driven by so-called “unfair” trade practices but rather by global savings and investment imbalances (chart 1). Nations such as China, Germany, and Japan have maintained high savings rates for several years, and their excess capital is continually recycled into US financial markets, where superior returns and deep liquidity have made the US an attractive investment destination. The persistent inflow of foreign capital strengthens the US dollar, reinforcing the trade deficit rather than narrowing it (charts 3 and 4). Indeed, the multi-year highs in the trade-weighted value of the dollar serve as clear evidence that capital has continued to flow into the US, sustaining deficits despite protectionist measures. Ultimately, Trump’s tariff-driven policies risk doing more harm than good, as they threaten to slow global growth, strain relationships with allies, and exacerbate inflationary pressures by raising input costs for US businesses and consumers. Rather than addressing the root causes of global imbalances (chart 5), such measures distort supply chains (chart 6), impair productivity growth, and fail to alter the fundamental drivers of trade deficits.

    • Home prices are little changed & mortgage rates fall.
    • Median income improves.
    • Affordability improves throughout country.
    • Annual increase remains below 2023 gain.
    • Compensation growth accelerates.
    • Quarterly Increase in unit labor costs is strongest since Q1’23.
    • Total beneficiaries had increased the week before.
    • Insured unemployment rate holds at long-standing 1.2%.