Haver Analytics
Haver Analytics

Economy in Brief

This week, we turn our focus to India in the context of US President Trump’s upcoming “Liberation Day” tariff announcements on April 2. Investors are likely on edge, uncertain about the specifics of Trump’s proposed “reciprocal” tariffs. However, early indications suggest that initial concerns may have been overstated, with significant impacts likely limited to only a handful of economies. As we noted in our previous letter, India could be among the most exposed in Asia to these tariffs, given its relatively high tariff rates (chart 1) and specifically those on imports from the US. Beyond tariffs, India also maintains comparatively high non-tariff trade barriers—both in contrast to the US and its more trade-liberal Asian peers (chart 2). Despite these concerns, India’s financial markets have demonstrated strong performance lately. The Indian rupee has staged a strong recovery from earlier selloffs, while equities have rallied (chart 3). The rupee’s resurgence may be partly driven by seasonal flows, whereas equities appear to have benefited from a sharp rebound in foreign portfolio inflows (chart 4). Looking at longer-term structural challenges, one area where India has yet to fully capitalize is its workforce. Despite a relatively young population, a significant portion remains unemployed (chart 5). A closer examination reveals several contributing factors, including insufficient job creation, a persistent skills mismatch, and, more fundamentally, the need for improved access to basic education (chart 6), among other challenges.

US “reciprocal” tariffs As discussed in last week’s economic letter, India is among the most exposed countries in Asia to US President Trump’s upcoming “reciprocal” tariffs, set to be unveiled later this week (April 2). This exposure stems from the fact that not only does the US run a significant trade deficit with India, but India also imposes comparatively high tariff rates on imports in general, and not just from the US, as shown in chart 1. While there are concerns about the potential impact of these tariffs, India has already begun trade deal talks with the US to mitigate the effects if they are implemented. It seems that Trump’s underlying strategy may be working: US-India trade talks are reportedly progressing well, with India considering tariff reductions or even eliminations on more than half of its imports from the US.

Graphs of the Week

More Commentaries

  • Financial markets remain gripped by heightened uncertainty surrounding US trade policy, slowing US growth, and broader fears of global economic instability. Latest data suggest that the recent introduction of US tariffs has driven up manufacturing input prices and risks exacerbating supply chain frictions (charts 1 and 2). Looking ahead, investors are also increasingly assessing the implications of reduced global cooperation for US capital markets and the value of the dollar (chart 3). Still, notwithstanding recent concerns, there remain big question marks about the degree to which other major economies, including Europe and China, will act as a magnet for global capital in the period ahead. Energy costs, for example, remain a critical ingredient for economic competitiveness, and while the US continues to benefit from low electricity prices, Europe’s high energy costs are still acting as a drag on its growth prospects (charts 4 and 5). As for China, tentative signs of stabilization have emerged following recent fiscal loosening and targeted stimulus measures, which have helped buoy industrial output and credit growth. The government’s latest initiatives—centred on infrastructure investment, tax incentives, and efforts to support the property sector—have raised hopes of a turnaround, though structural headwinds, including weak consumer confidence and ongoing financial strains in the real estate sector, remain formidable. Whether China can sustain a more durable recovery will be a key factor shaping global capital flows, particularly as investors weigh the relative attractiveness of US and Chinese assets in an increasingly fragmented global economy (chart 6).

    • Sales edge up from record low.
    • Pattern of home sales is mixed across country.
    • Inventory drag on economic growth remains largest in almost two years; net exports add negligibly to growth.
    • Sharp gain in consumer spending growth is revised down slightly, while the decline in business investment is lessened.
    • Price index gain is revised down slightly.
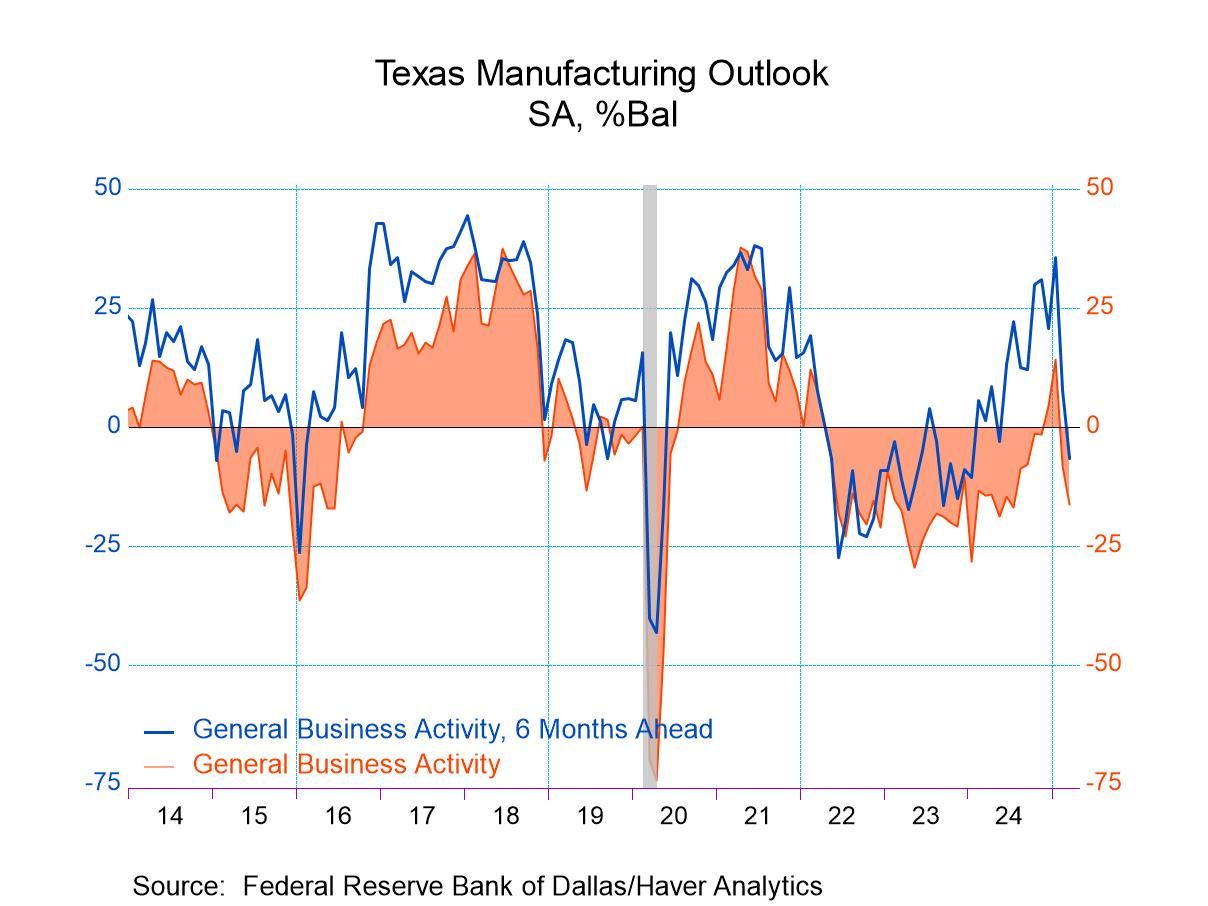
    • The headline index increased to -2 in March from -5 in February.
    • The index has not been positive, depicting growth, since September 2022.
    • New orders fell more rapidly while shipments fell less rapidly.
    • Employment continued to decline though at a slower rate than in February.
    • Prices paid for inputs surged to highest reading since September 2022.
    • First narrowing in goods trade deficit since October.
    • Exports rise 4.1% m/m, up for the third month in four, led by a 12.7% rebound in auto exports.
    • Imports fall 0.2% m/m after three straight m/m rises, led by a 4.9% drop in imports of industrial supplies & materials.
    • Initial claims down 1,000 in March 22 week.
    • Continuing claims 4-week average up just 2,000 in latest period.
    • Insured unemployment rate holds at 1.2% since January 2024.
  • European vehicle registrations falter and flatten in February. The month-to-month changes for a decline of 0.9% in February; year-over-year vehicle registration growth is -3.9%. The chart makes it clear that country-by-country the growth rates have been closing in on fairly unchanged levels of activity with a slight bias to contraction.

    Country-by-country year-over-year sales results are strongest for Spain with the 10.4% increase, France with the 1.7% increase, the United Kingdom with a 2.4% drop, Italy with a drop of 6.2%, and Germany with a drop of 7.1%. These numbers translate into a 3.9% decline year-over-year for the total. If we look at smoothed data updated from three-month moving averages, there's a decline of 1.4% year-over-year, just to get a less volatile read.

    Despite the year-over-year declines that are more prevalent than increases, the sequential trends show vehicle registrations trending more toward acceleration. There is clear acceleration registered in Italy and the United Kingdom. After that, there's certainly a very strong hint of very strong acceleration in both Spain and France. I say that because the year-over-year gain for Spain is 10.4%, while the three-month gain goes up to 32.1% at an annual rate (!); however, that is a step-down from the six-month growth rate of 47.6% at an annual rate so it's not exactly a clear accelerating trend but certainly three- and six-month growth rates are far in excess of the 12-month growth rate. We see the same thing happening in France with a 1.7% year-over-year growth rate compared to a 23.1% annual rate over three months, but that three-month rate is a step-down from the six-month pace of 27.7%. Because of that, I can't classify those two countries as accelerating but clearly something very positive is a foot.

    If we turn to look at ranked data, we find the ranking of year-on-year sales growth is at 20.2% overall growth rates since 1995 – weak and unimpressive. Country rankings range from low 7% rank for Germany to a high of a 46-percentiel standing in the U.K. All rankings are below 50%, below their respective historic medians. We can also rank the same data in terms of the pace of unit sales. In Europe, the pace of unit sales (units sold per month or per month at an annual rate) there is a 33-percentile standing on all unit sales data since 1995. The auto sector pulled back after the Great Recession, it recovered into Covid, then suffered further downward pressure after the invasion of Ukraine by Russia. Since then, there has been a much more modest recovery leaving the pace of unit sales closer to the lows reached after the Great Recession than to its pre-Great Recession mark. Europe’s auto sector may be recovering but it is doing so slowly and sporadically, and it has a long way to get back to trend.

    • Increase exceeds expectations.
    • Electrical equipment & appliance orders post firm increase.
    • Nondefense capital goods less aircraft orders decline.