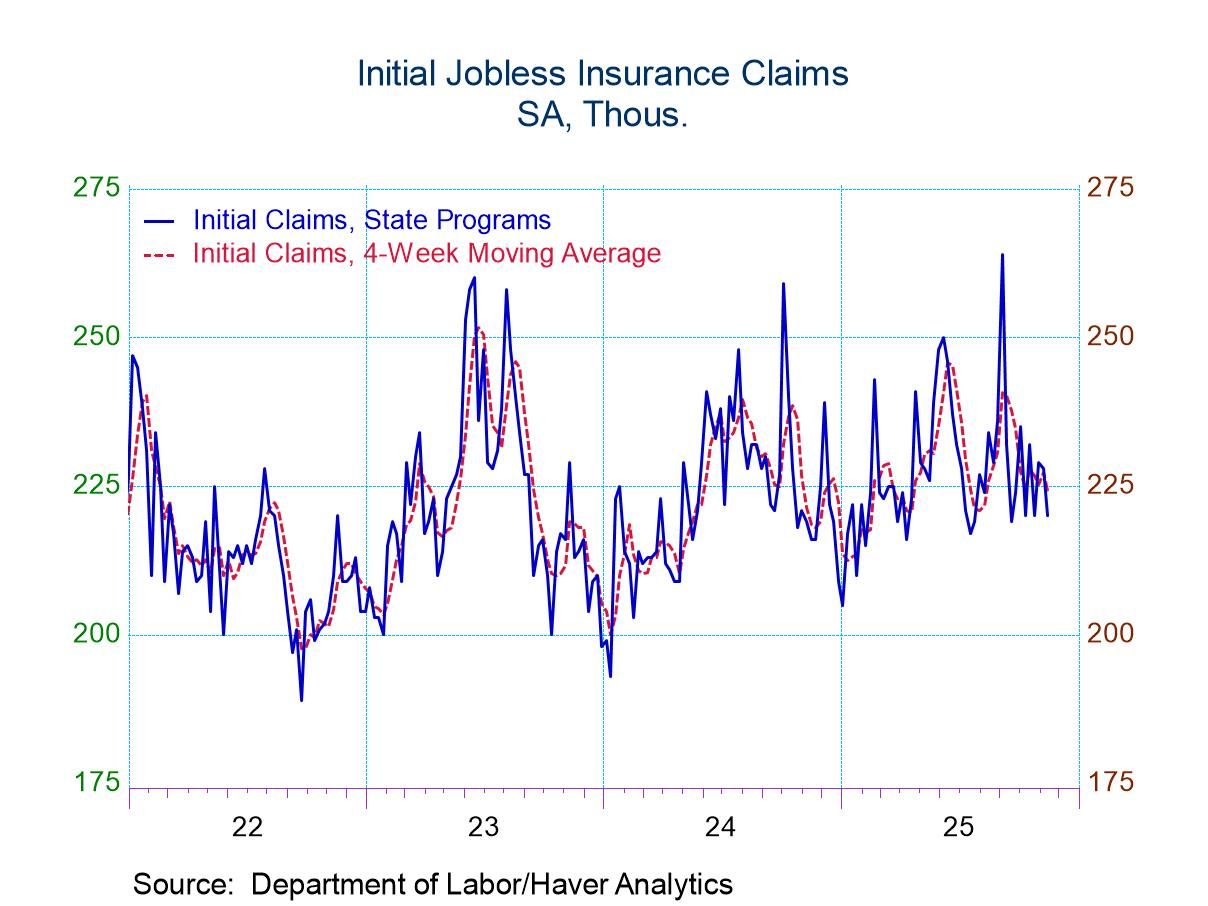
- Initial claims remain range bound at a low level
- Continued clams are drifting upward
- USA| Nov 20 2025
Unemployment Claims: Modest Changes
- United Kingdom| Nov 20 2025
CBI Industrial Survey Seeing Ongoing Weakness and Deterioration Ahead
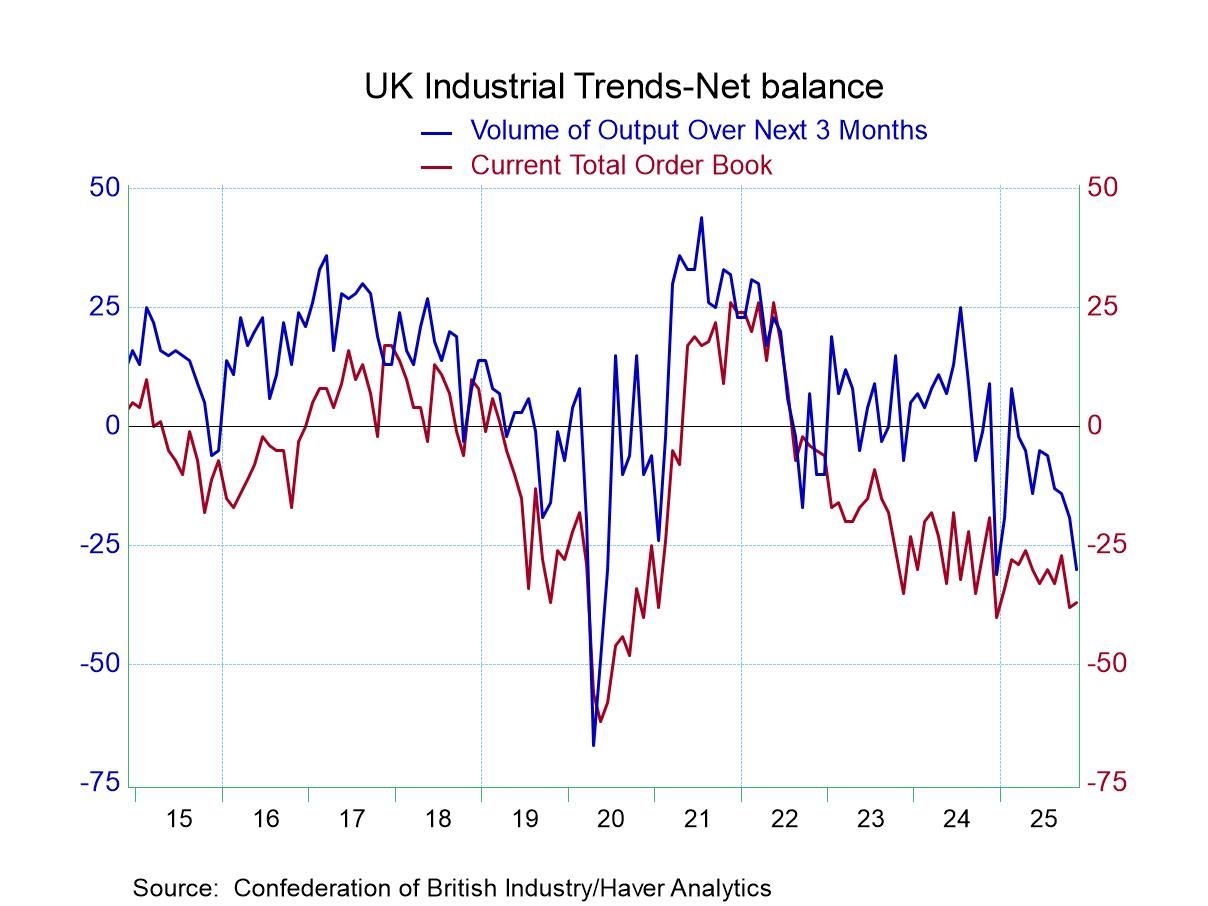
The survey of the industrial sector by the Confederation of British Industry (CBI) shows ongoing weakness for orders and export orders as stocks build slightly more aggressively. The build out in stocks when orders and expectations for volume are falling is not a good sign and suggests that the inventory buildup may be involuntary and that may be setting the stage for weaker economic performance ahead.
Total orders in November notch a reading of -37 on the net diffusion reading, about the same as the -38 logged in October. Both of those are significantly weaker than September's -27 and compare to a six-month and 12-month average around minus 32 and minus 33.
Export orders are improved in November but still quite weak at a reading of -31 compared to -46 in October. At -31 the November net reading for exports is similar to the six- and 12-month averages which are -32 and -33, respectively.
Stocks of finished goods in November have moved up to +16 from +7 in October they were higher than the 12-month average and the higher than the six-and 12-month averages, the latter 2 hovering around values of 10 and 12 compared to this month's value of 16.
An accelerating weakening appears, looking ahead for output volume over the next three months. The reading drops to -30 in November from -19 in October and -14 in September; the 12-month average stands at -13 with the six-month average of -15. This is a severe deterioration
Average prices over the next three months, however, as expected output volume deteriorates sharply in November is expected to see less pressure. The November value for prices in 3-months at a reading of +7 compares to score if +16 in October. At +7 the price expectations are well below the 12-month average which has been 18 and the six-month average which checks in at +13. With economic cooling expected, cooling in price pressures are expected to accompany that slow down.
Standings by the numbers: The queue standings of the November variables are uniformly weak. The exception is stocks of finished goods which have a 74-percentile standing displaying strength in that measure while orders and expected output volume are weak as a bad sign. Average prices, while losing some momentum in November, still have a standing at their 53.7 percentile, slightly above their median- so these are still somewhat heated price readings although the pressure is off compared to October and compared to 6-month and 12-month standards. Total orders have a 9-percentile standing; export orders have a 26-percentile standing and the expectation for output volume over the next three months has only a 2.8 percentile standing.
The activity and expected activity portions of the survey remain very weak. Their results support the idea that the economy may need more help from the Bank of England despite some ongoing inflation overshoot. As mentioned in yesterday's write up the inflation metrics are beginning to converge toward values that the Bank of England will find more acceptable although the current levels of variables measuring inflation are still too high. The momentum is in the right direction and with economic weakness in train, it's hard to imagine the Bank of England holding the line or standing on ceremony because inflation is still above target. The economy is beginning to emit signs that are a more significant outcry for help.
 Global| Nov 20 2025
Charts of the Week: The Year Ahead
As 2025 draws to a close, the global economy feels caught between relief and unease. Inflation has eased but not fully retreated, monetary-policy cycles are pulling in different directions, markets are oscillating between AI-driven enthusiasm and valuation nerves, and geopolitical tensions are pressing harder on trade, energy and investment flows. Against this backdrop, the twelve themes that follow set out the forces most likely to shape the macro, market and policy landscape in 2026. They range from the pivotal questions around whether AI will deliver visible productivity gains, how far the AI narrative can continue to support markets, and how policymakers will manage an unusually uncertain interest-rate outlook, to the broader pressures created by fiscal strains, climate stress, shifting trade patterns, geopolitical fragmentation, political transitions, and demographic change. Taken together, they offer a map of the terrain investors and policymakers will need to navigate in the year ahead — a world where cyclical dynamics and structural shifts arguably interact more tightly than at any point in the past decade, and where the biggest surprises are likely to emerge from those intersections.
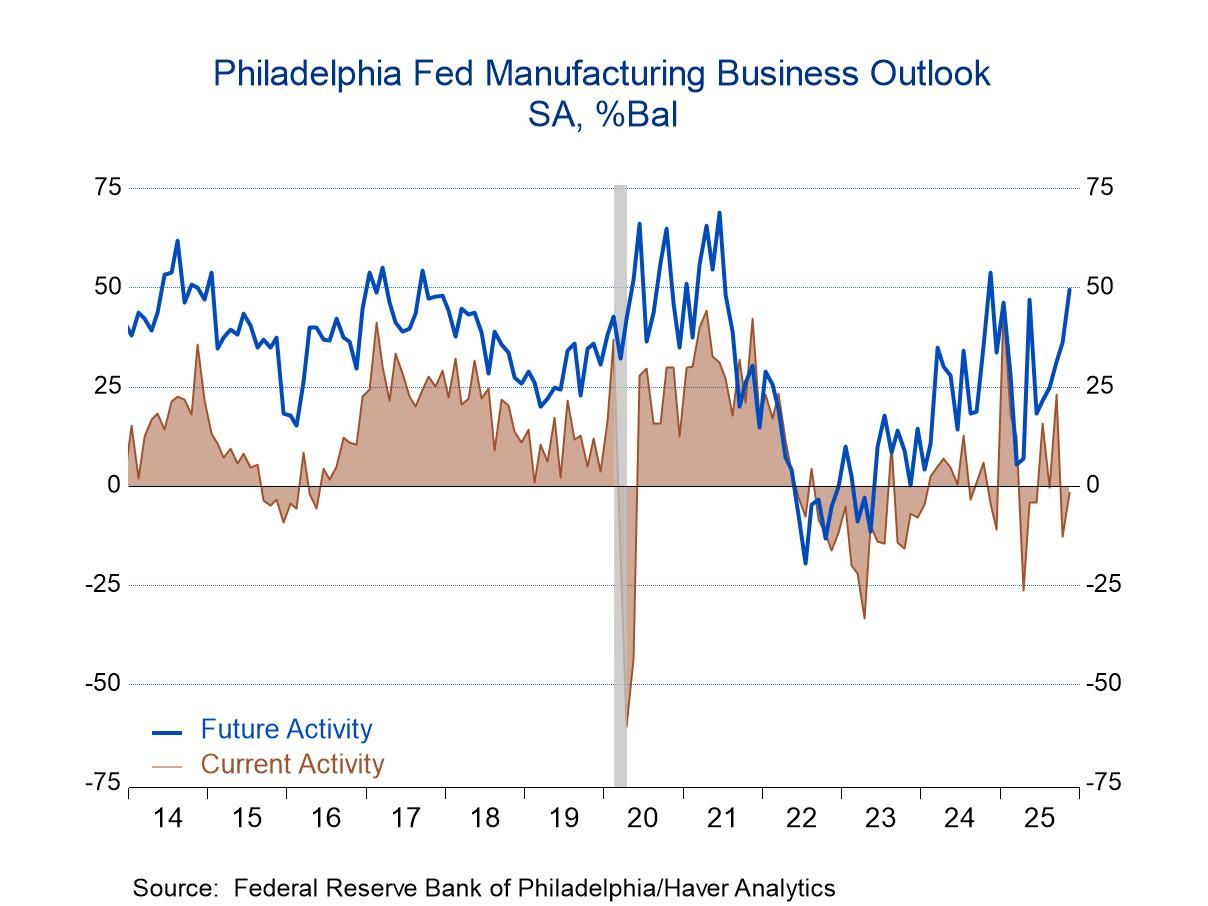
- The headline index increased to -1.7 in November from -12.8 in October. So, while activity fell further, the pace of decline slowed.
- Both new orders and shipments fell into negative territory in November after posting positive readings in October.
- Delivery times slowed and the pace of input price increases rose.
- Employment increased while the rise in the workweek slowed.
by:Sandy Batten
|in:Economy in Brief
- USA| Nov 19 2025
U.S. Trade Deficit Narrowed in August
- Release delayed by the more than one-month federal government shutdown.
- The trade deficit narrowed to $59.6 billion in August from $78.2 billion in July.
- Exports were little changed with a 4% jump in capital goods exports offset by declines in most other major categories.
- Imports fell 5.1% m/m, reflecting a $9 billion monthly decline in nonmonetary gold imports.
- The services surplus edged up in August.
by:Sandy Batten
|in:Economy in Brief
- United Kingdom| Nov 19 2025
UK Inflation Drifts Lower as Unemployment Rises
UK inflation gives the BOE a greenlight on rate cuts. UK inflation is still excessive at 3.8% over 12-months for the CPI-H and its core metric. But over six-months both of those drop; the headline drops to a pace of 2.9% and the Core drops to 3.0%. Over three-months inflation drops even lower to a headline pace of 2.3% and a care pace of 2.7%. Both are still above the 2% target but look much less dangerous.
Stauch inflation fighters still will not like the results. But with the unemployment rate a year ago at 4.2% and now up to 5% (as of August) and with a one-half-of-one percentage point rise in the unemployment rate in the last six-months it becomes hard to hold the line on monetary policy. The BOE’s rate changes have mirrored those of the Fed in the US, but with the official; unemployment rate at 4% now and short-term inflation readings around 2 ½ percent and unemployment rising it would be hard for the central bank, especially given the turbulent UK political scene, to squeeze the economy further. IN the UK inflation is deflation whereas in the US inflation is stuck, possibly rising and facing the potential of pressure form tariffs.
Inflation diffusion checks in below 50% (the level that marks equal tendencies for inflation to accelerate or decelerate across broad categories) for 12-months, 6-months, and 3-months. Over recent months, month-to-month inflation has been contained in terms of broad categories with two of three months showing monthly diffusion below 50%.
It is hard to make any optimistic case for economic activity and if UK activity is going to slow, it is much easier to make a case for inflation containment to progress further. While the more up to date claimant count unemployment rate has been steady, the lagging overall rate has a clear uptrend that has to be viewed as worrisome.
Like the Fed I would surely like to see more progress on inflation in the UK and I do not view current circumstances as optimal to cut rates. But the situation is simply slippery. And monetary policy is made in the real world under conditions or uncertainty. And real-world conditions surely pave the way for some continued rate cutting unless data and trends shift.
In October, the CPI and Core rose by just 0.2% month-to-month with inflation rising in six of ten major categories month-to-month and after seeing only one category accelerate month –to- month in September and a split of five/five in August.
Still, make no mistake about it, inflation is still too high. The question of the bet by the central bank will be on the future. When UK inflation is ranked on Year-over-year monthly observations back to early 2000, inflation is below its median year-to-year rise in only two of ten categories and ranked on the same period the freshest unemployment rate has been lower about 46% of the time marking the current (rising) rate of unemployment as slightly below its median for this period. But the claimant rate that has stabilized at a lower level is nonetheless higher on this period, less than 30% of the time, which means the stability in the claimant rate is not as reassuring as it seems. It would appear that policy dialogue in the UK is about to shift.
- Purchase and refinancing loans decline.
- Interest rates move to highest level in five weeks.
- Average loan size declines to lowest level since August
by:Tom Moeller
|in:Economy in Brief
- Canada| Nov 18 2025
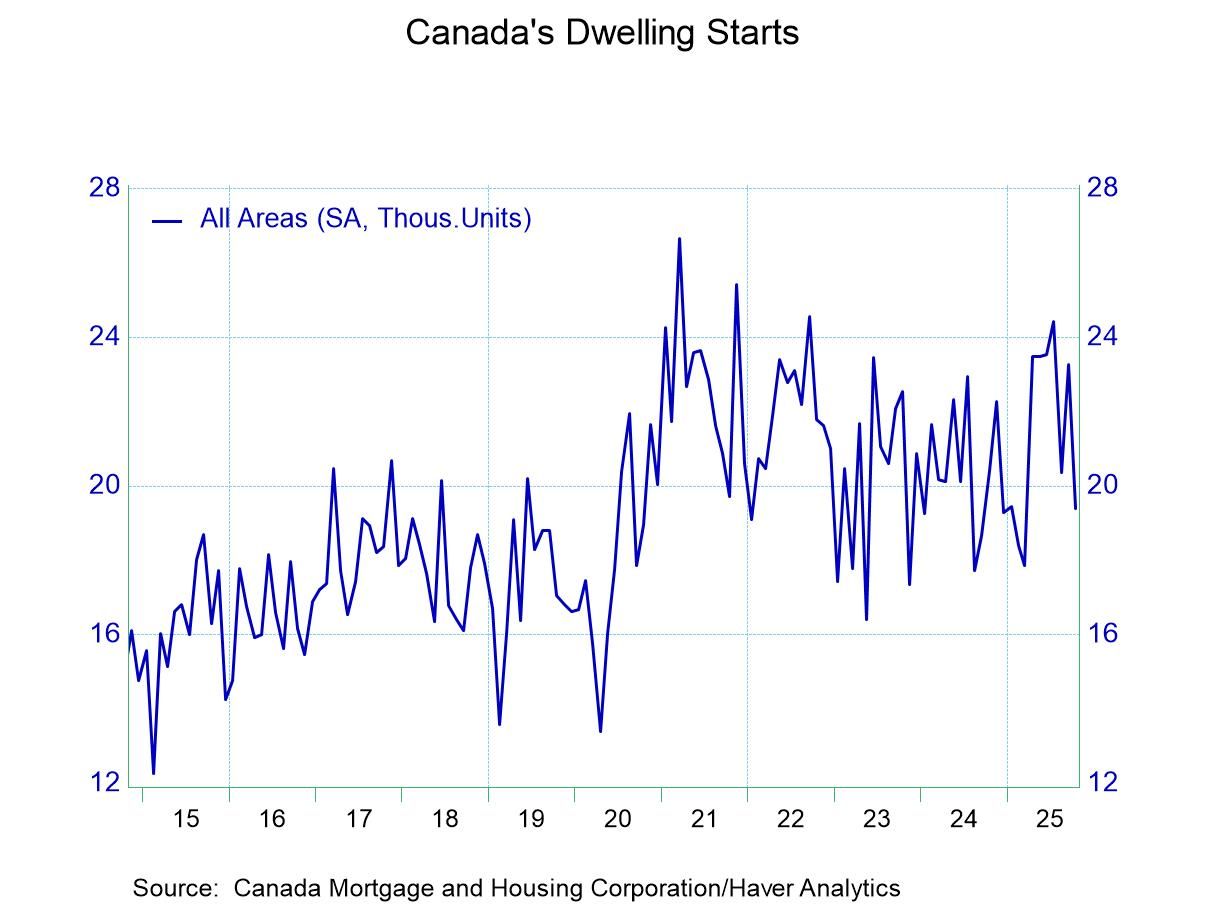
Canadian Housing Starts Show Erosion
Canadian growth has been in its own trajectory with some solid consumer spending in gear and some slight slowing in GDP growth. Housing has begun to show some wear and tear in this environment even as mortgage rates have remained well off peak and have begun to stabilize around the 5% mark for 5-year mortgage financing.
Canada has been cutting its policy target rate faster than the Fed has been reducing the Fed funds rate. Canada’s unemployment rate has hovered above the rate for the US and it has been rising; rising - not quickly - but with a bit more purpose than in the US. This may have encouraged the Bank of Canada to cut rates more aggressively with inflation fluctuating is the desired range set by the back of Canada.
Canadian housing starts show the ‘signature slowing’ during Covid and the strong post-Covid recovery that actually has boosts starts well above the average it had maintained for the five-year previous to Covid. Even not with new episode of weakness in train Housing starts are above the pre-Covid average in Canada- and facing higher financing rates than before.
Canada, like the US, is going through some difficult fiscal times. In addition, there is an ongoing Trump-Carney spat that is a heavy overlay on the bilateral relations so important to both economies. Canadian PM Mark Carney just survived a confidence vote over his budget. The Carney budget aims to pump funds into the Canadian provinces to boost infrastructure and house-building. In Canada builders also face development fees that some want altered but the offer of reducing them has not been put on the table. Not surprisingly Canada is under some of the same pressure as the US for the government to act and supply answers for the housing shortage that has emerged. Carney’s platform on which he was elected had made some substantial promises and they still are not coming to fruition.
Covid seems to have upset a number of apple carts many of them related to housing. Prior to Covid housing demand had not been so vigorous. But Covid may have triggered something that reminded people how important housing can be especially in a crisis when you become house-bound. In the wake of Covid US and Canadian housing demand strengthened. And since the bank of Canada made the same policy mistake as the Fed driving interest rates to the brink of the zero bound during Covid it also created a period of super low mortgage rates which now has the effect of trapping people in their own homes- a form of "golden-handcuffs" that keep people in a house because of cheap financing. While mortgage rates are nearly 150bp below their post Covid peaks, they are still more than 100bps above their pre-Covid averages. The housing market remains under duress.
- of2693Go to 18 page


