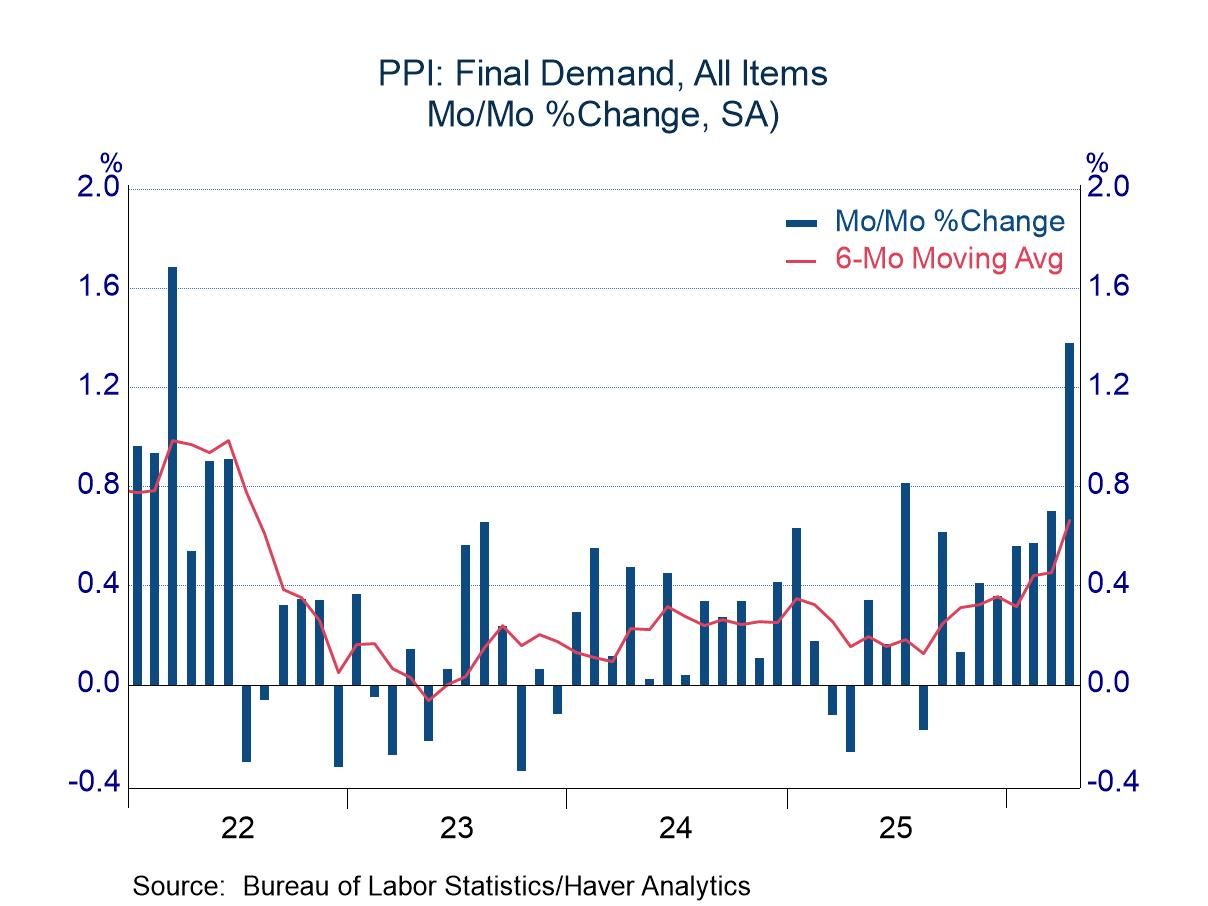
- The energy component led the sharp increase in the PPI, but it had support from many other areas
- Excluding energy, most service prices rose sharply; prices of non-energy goods also were under pressure
- The food component went against the grain with an increase of only 0.2%
USA| May 13 2026
April PPI: Broad-Based Pressure
More Commentaries
 Asia| May 11 2026
Economic Letter from Asia: Of Bits and Barrels
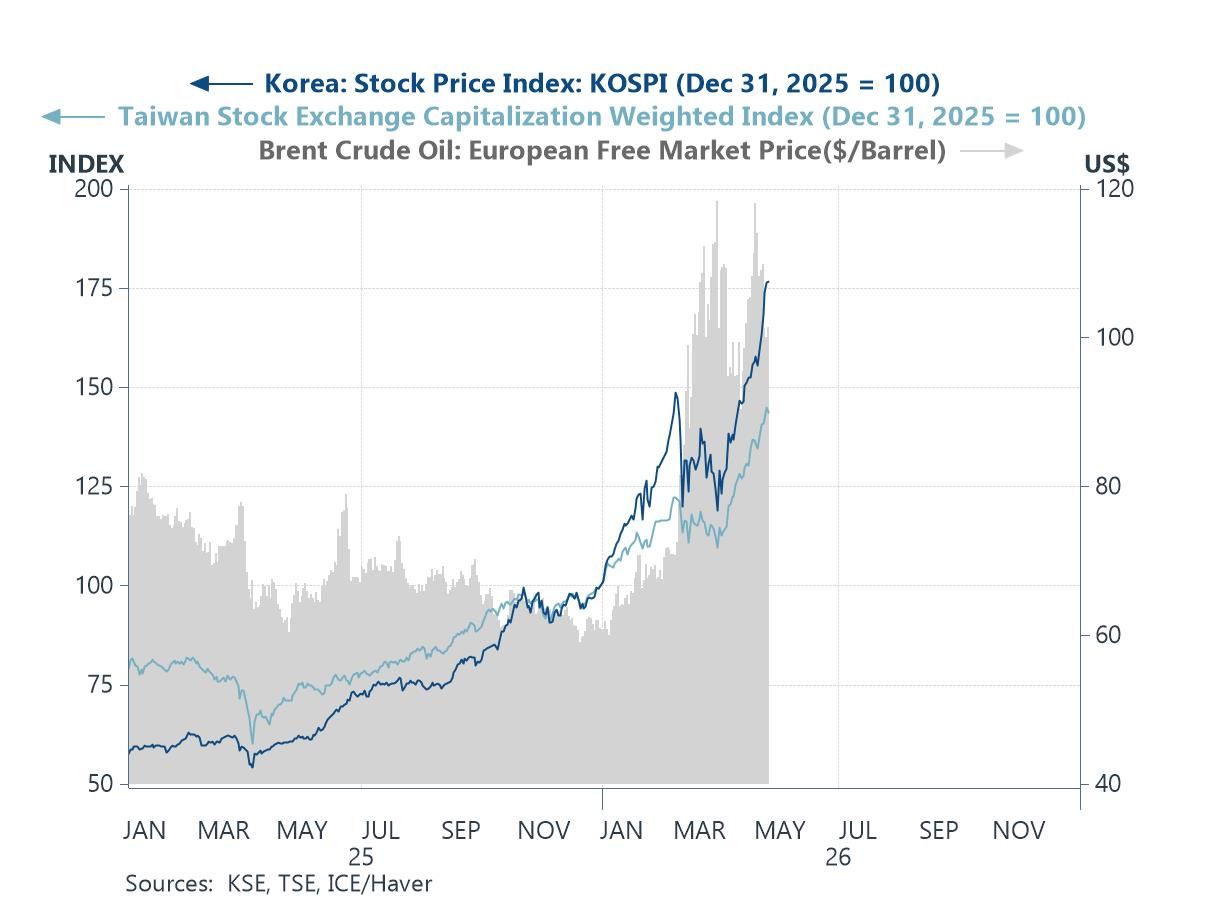
In this week’s Letter, we track the dual drivers of AI optimism and the ongoing Middle East conflict, and how they continue to shape market prices and investor expectations. AI-related enthusiasm has remained a key support for equity markets, particularly in highly exposed indexes in Taiwan and South Korea, while continued oil supply bottlenecks stemming from the closure of the Strait of Hormuz have kept crude prices elevated (chart 1). These dual forces are also evident in the latest Blue Chip Economic Indicators survey. Year to date, all Asian economies have seen upward revisions to inflation forecasts, while the most AI-exposed advanced Asian economy, Taiwan, has recorded a particularly large upgrade to real GDP growth expectations (chart 2). Looking more closely at the monetary policy implications of higher oil prices, this month’s survey shows an increasing share of panellists expecting central banks to resume or extend tightening cycles, marking a modest shift from last month’s results (chart 3). This shift is already partially reflected in recent data, with average inflation across Asia edging higher and several central banks already opting to tighten policy in response (chart 4).
Looking ahead, attention will likely centre on the Trump–Xi summit taking place in Beijing later this week. While any potential for additional Chinese mediation efforts regarding the Middle East conflict will be closely watched, developments on the US–China trade front should not be overlooked given the range of unresolved issues (chart 5). Finally, despite recent headline focus on the Middle East, China has continued to post steady export growth, while also managing to temper excessive domestic producer competition. Together, this has supported a combination of firmer external demand and more stable pricing dynamics—an “all-win” outcome for now (chart 6).
AI vs. the Middle East conflict The divergence between AI-driven equity market optimism and the persistence of elevated crude oil prices amid the ongoing Middle East conflict remains striking. On the one hand, equity markets—particularly in AI-heavy economies such as Taiwan and South Korea (chart 1)—have largely shrugged off concerns over energy supply disruptions. Investors remain focused on the upside potential from the current AI buildout cycle, driven by the rising computational demands of increasingly capable AI models. More recently, attention has shifted toward the scalability and broader applications of physical AI, including humanoid robots, and their potential implications for manufacturing, healthcare, and even household use. On the other hand, crude oil prices remain well above pre-conflict levels. The latest development is the US rejection of Iran’s most recent peace proposal, underscoring that a swift resolution to the US-Iran conflict remains unlikely.
 USA| May 08 2026
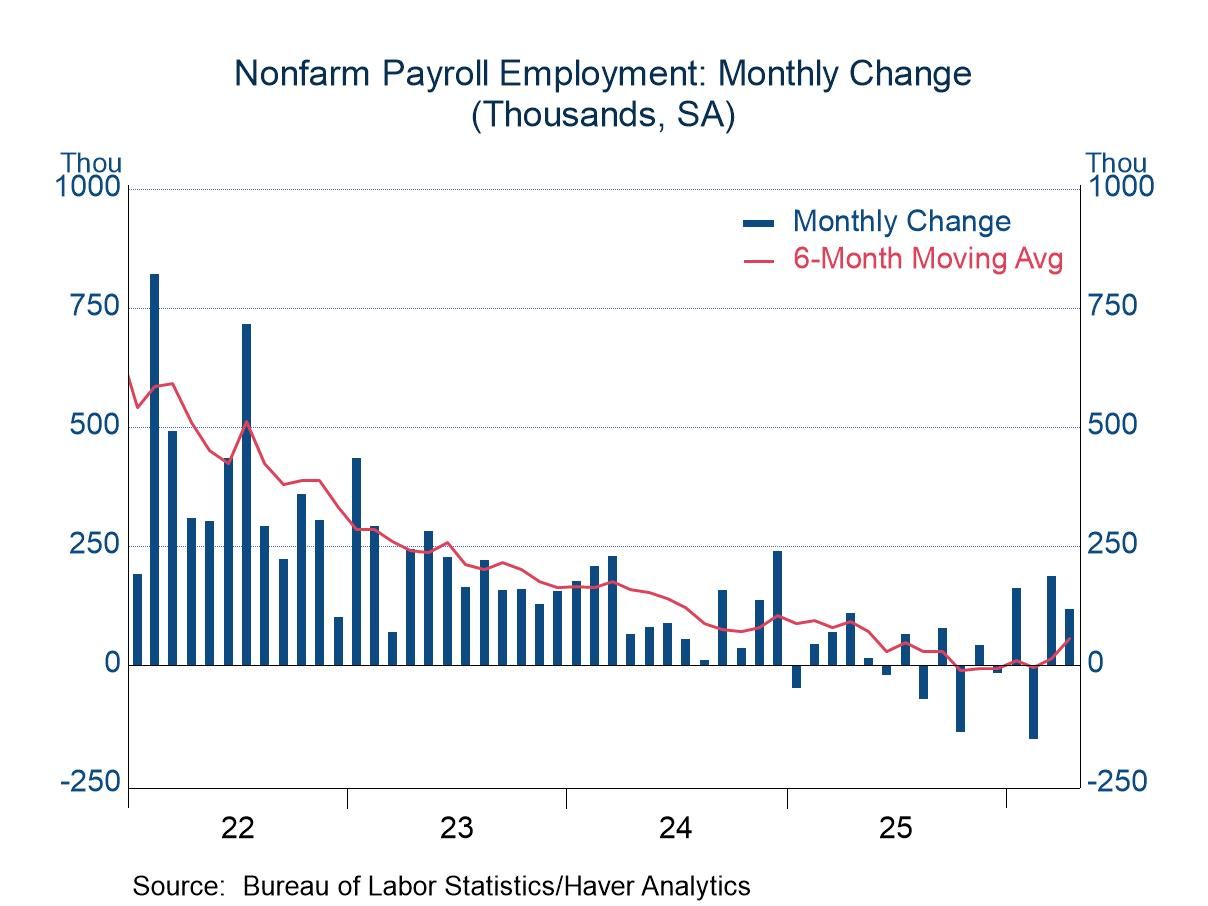
April Employment: Signs of Improvement
- Nonfarm payrolls advance for the second consecutive month.
- Unemployment rate steady; average hourly earnings tame.
 Global| May 07 2026
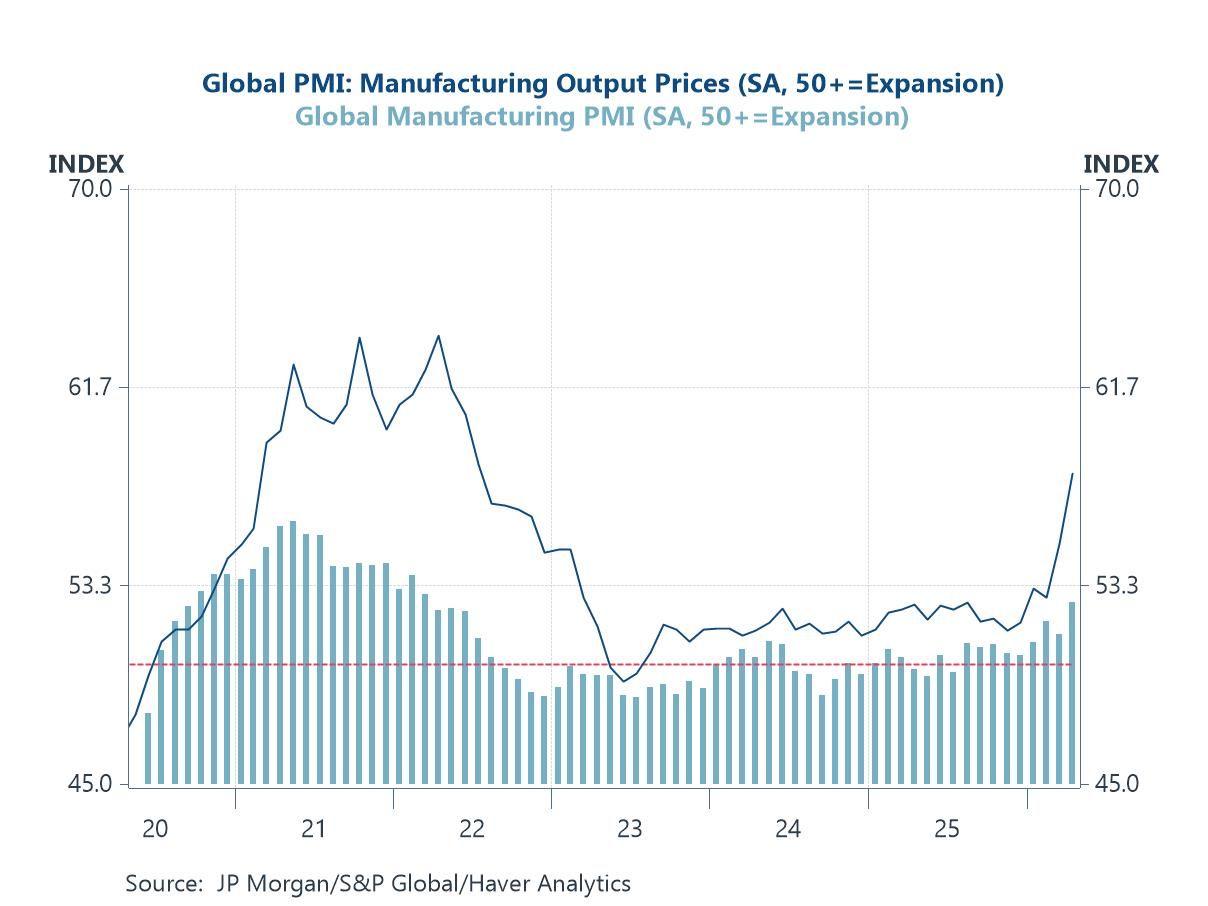
Charts of the Week: Still Standing
Recent developments point to the possibility of a peace settlement in the Middle East, which has offered some tentative relief to energy markets. Financial markets have responded with cautious optimism, but the outlook remains highly uncertain, with much depending on whether any agreement proves durable and supply disruptions are fully unwound. Against this backdrop, our charts this week highlight a global economy that is holding up better than expected but facing renewed cost pressures. Manufacturing activity remains resilient, supported by AI investment, reduced tariff disruption and defence spending, even as output prices firm (chart 1). Supply-side frictions are also still evident: shipping costs have risen, broader supply chain pressures are rebuilding (chart 2), and crude oil production has been curtailed by export and storage constraints among key regional producers (chart 3). These dynamics have reinforced inflation risks and shifted policy expectations in a more hawkish direction (chart 4). Meanwhile, US credit conditions appear broadly neutral, suggesting neither strong deleveraging nor releveraging pressures (chart 5). Finally, wage growth remains central to the outlook, particularly in the UK, where pressures are still comparatively elevated (chart 6). Taken together, the message is one of resilience under strain: growth is holding up, but the balance between inflation and activity is becoming increasingly delicate, leaving policymakers—and markets—navigating a narrow and uncertain path ahead.
by:Andrew Cates
|in:Economy in Brief
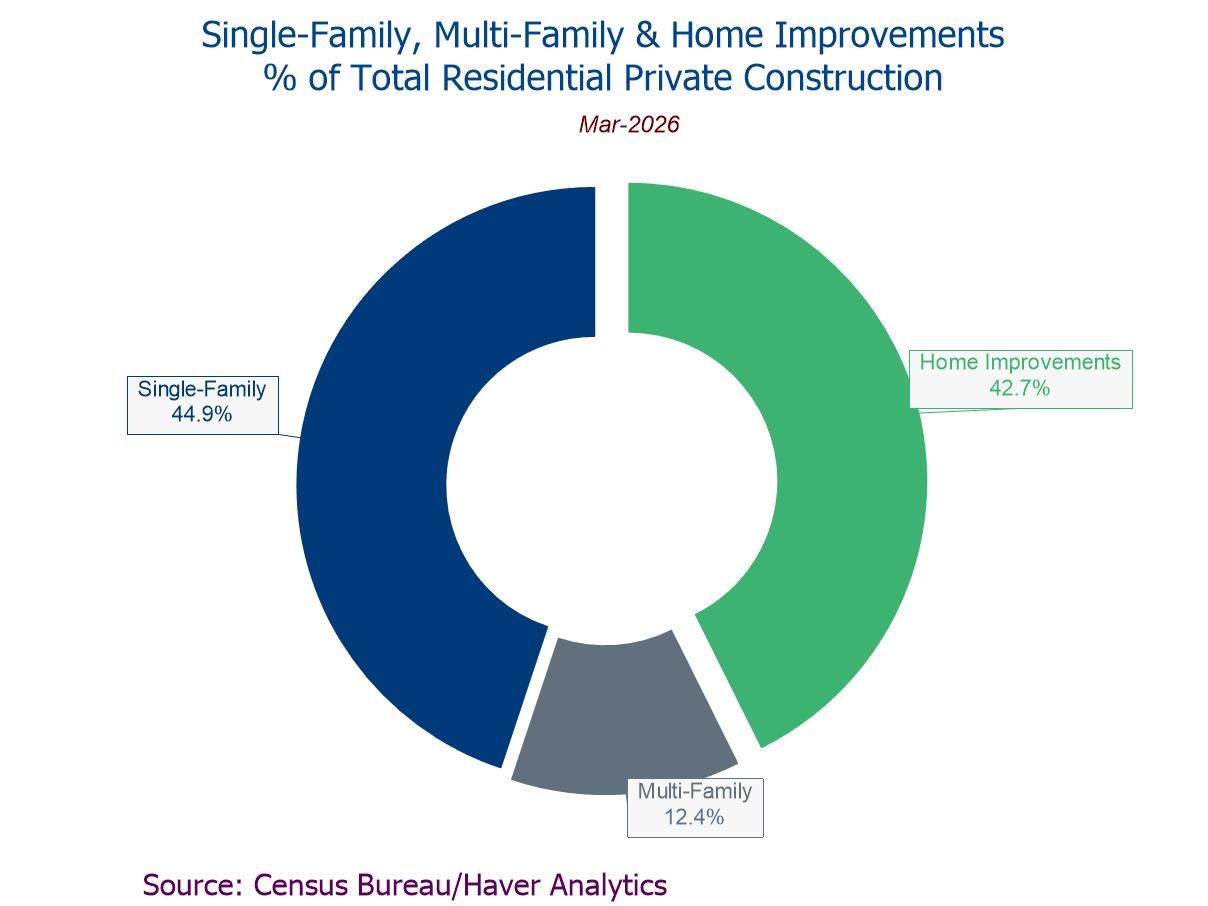
- Headline +0.6% m/m, first monthly gain in three mths.; +1.6% y/y, fourth straight y/y rise.
- Residential private construction +1.7% m/m, driven by a 2.7% rebound in single-family building.
- Nonresidential private construction -0.2% m/m, fifth decline in six mths.
- Public construction -0.2% m/m, led by a 2.3% drop in residential public building.
 USA| May 07 2026
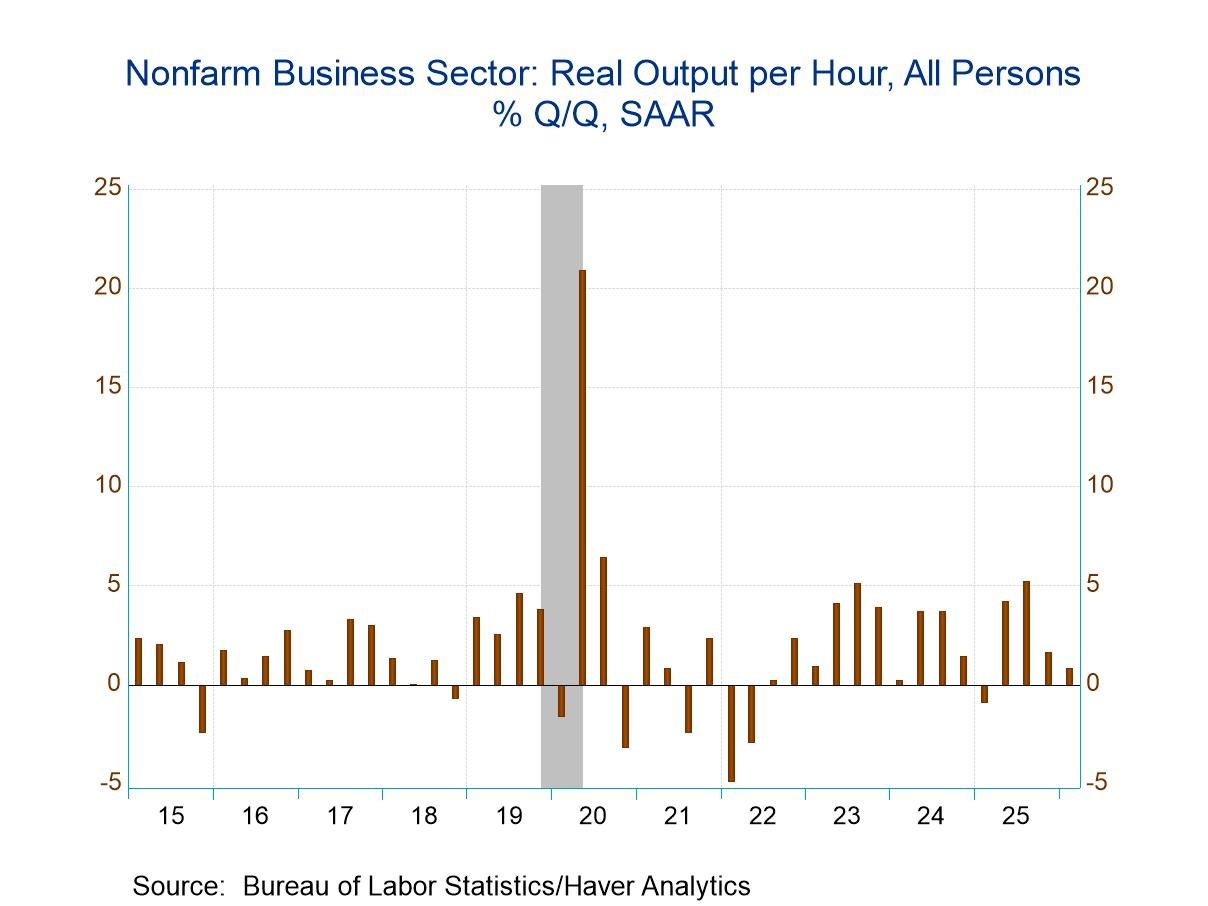
U.S. Productivity Growth Slowed in Q1 2026
- Output per hour growth slowed to 0.8% q/q saar in Q1 from 1.6%.
- However, longer-term productivity growth remained solidly well above trend.
- Compensation growth slowed to 3.1% q/q resulting in a slowdown in unit labor cost growth to 2.3% from 4.6% in Q4.
by:Sandy Batten
|in:Economy in Brief
 Europe| May 07 2026
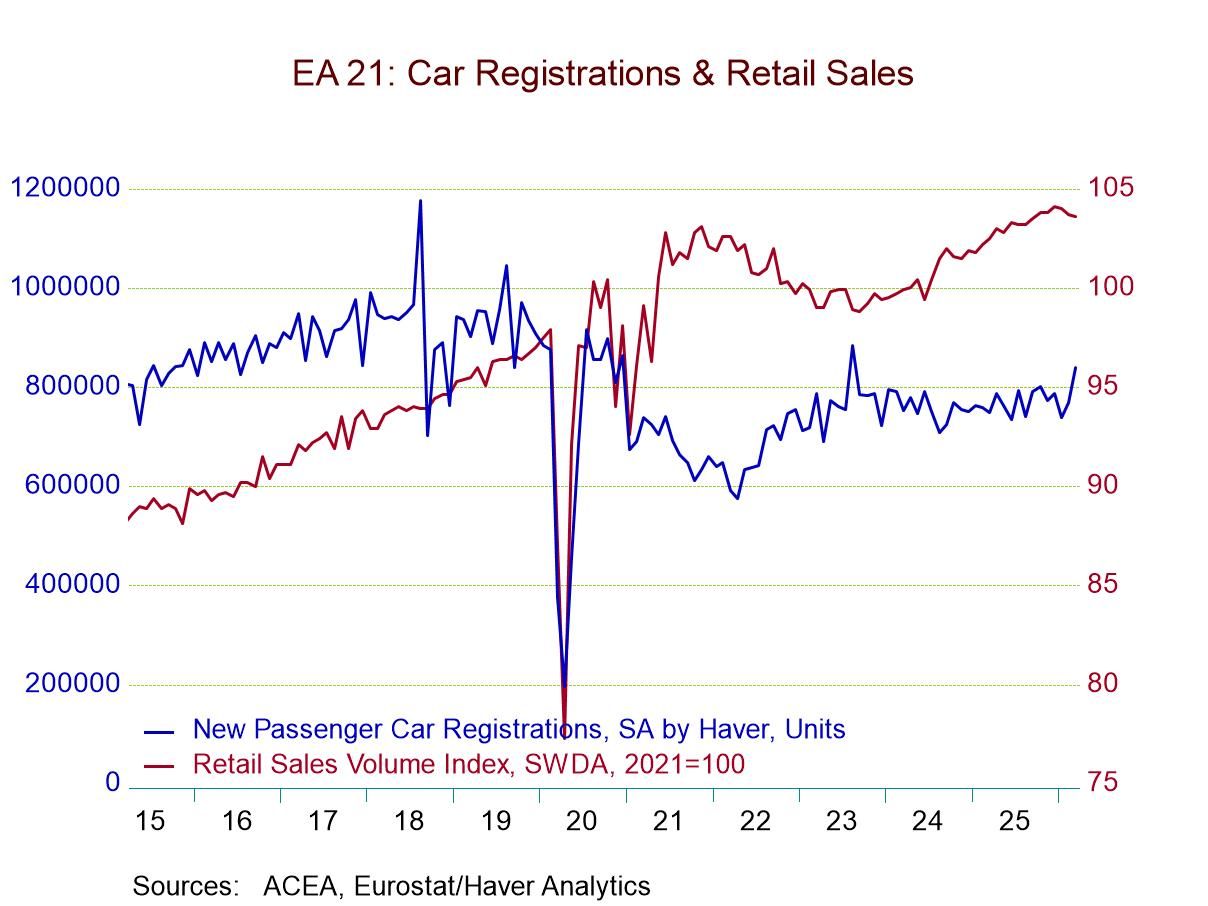
EMU Retail Sales Recede in April
Retail sales in the European monetary area fell in March by 0.1%, continuing a streak of declines in retail sales volumes since the beginning of 2026. Motor vehicle sales, however, as a separate category, showed recovery in registrations and sales from January to February to March.
Among six early reporting monetary union and other European countries, Germany and Norway showed sales declines in March, while Denmark, the Netherlands, the United Kingdom, and Sweden recorded month to month increases. However, these March data belie the weakness in February, when sales declined month-to-month in all six of these areas. Prior to that, January sales had increased month-to-month in all these countries except Germany; Germany posted a 1.1% decline in retail sales in January.
Sequential trends Sequential trends for these countries show that retail sales in Germany have been slipping more rapidly, falling 2% over 12 months, at a 3.9% annual rate of decline over six months, and at an accelerated 13.1% annual rate of decline over three months. Norway also has seen increasing weakness in retail sales, rising by 0.9% over 12 months, gaining at only a 0.4% annual rate over six months, and then falling at a 1.2% annual rate over three months. However, Denmark, the Netherlands, the U.K., and Sweden each show retail sales accelerating from their 12-month growth rate to their six-month growth rate and to their three-month growth rate. Only the Netherlands is an EMU member country. These data pool together monetary union and non-monetary union countries.
Looking at the headline for the monetary union, we see sales are clearly slipping and decelerating, with total sales volume up 1.1% over 12 months, up at a 0.2% annual rate over six months, and then falling at a 1.9% annual rate over three months. Sales in the monetary union are weak and getting weaker.
In the quarter-to-date (the now-completed first quarter), monetary union sales fell by 0.5% at an annual rate. Among the other countries in the table, only Germany—the largest economy in the monetary union—shows a quarterly decline at a 4.3% annual rate. All the other reporters in the table show increases, ranging from 0.1% at an annual rate in Norway to a 6.3% annual rate in the United Kingdom.
Looking at the sales gains back to January 2020, before COVID, in the euro area total retail sales volume is up by 6.3% over that broad period. U.K. sales volumes are actually lower by 0.6% over that same span. Germany, the largest euro area economy, shows a 2% increase since January 2020, implying a very slow gain for retail sales over that period. The strongest gains since January 2020 are logged by Denmark, with a 12% gain, followed by the Netherlands with a 6.4% gain and Sweden with a 5.6% gain. Since we're looking at a broad six-year period, on that time horizon these are all relatively weak numbers, with the exception of Denmark.
Activity in the monetary union has been weak, with the service sector having been quite weak during the period since COVID ended—especially on the back of the invasion of Ukraine by Russia. Recently, manufacturing and goods sector data have shown a little bit of life, even as service sector data continue to be very touch and go. We see that again in this retail sales report. Now oil prices are jumping, and there is a new ‘hot’ situation in the Middle East; the Strait of Hormuz is showing either impeded or shuttered traffic conditions. The outlook remains very uncertain. Consumer confidence measures continue to show consumers as somewhat off balance and concerned about circumstances and the outlook. This means we'll continue to watch all these trends closely. In the meantime, these retail sales trends indicate caution on the part of consumers as to their willingness to spend—even though they appear to have opened their pocketbooks to spend on vehicles in recent months and even sequentially. In context, the rebound in auto sales still leaves total vehicle registrations 5% lower than they were in January 2020—six years ago. There is nothing there to indicate that the consumer is out of the woods and back to normal.
 USA| May 06 2026
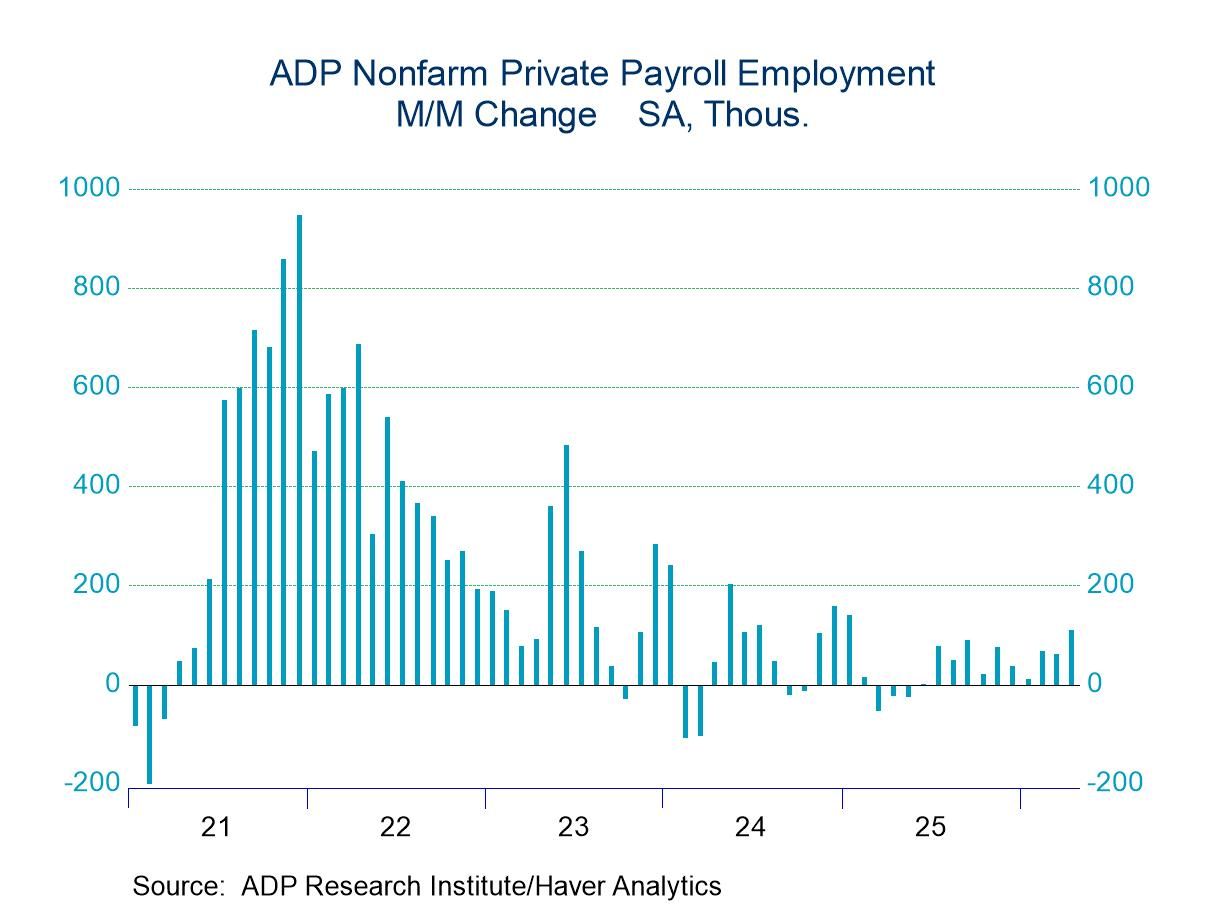
U.S. ADP Employment Rises More than Expected in April
- Private-sector payrolls rose 109,000 led by a pickup in service-producing employment.
- Services employment increased by 94,000 while the rise in goods employment slowed to 15,000.
- April job gains continued to be dominated by job increases at small firms.
- Wage growth was little changed but remained elevated for job stayers.
by:Sandy Batten
|in:Economy in Brief
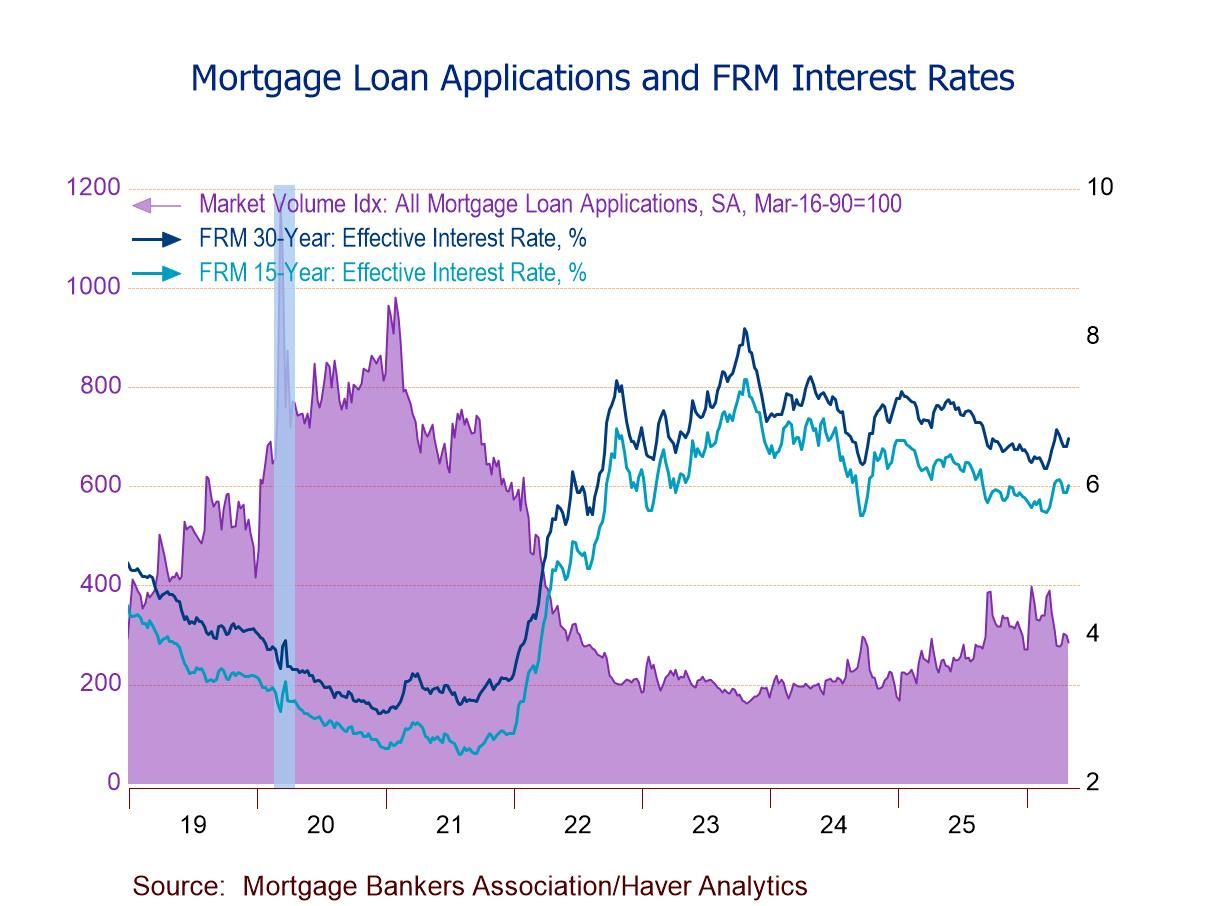
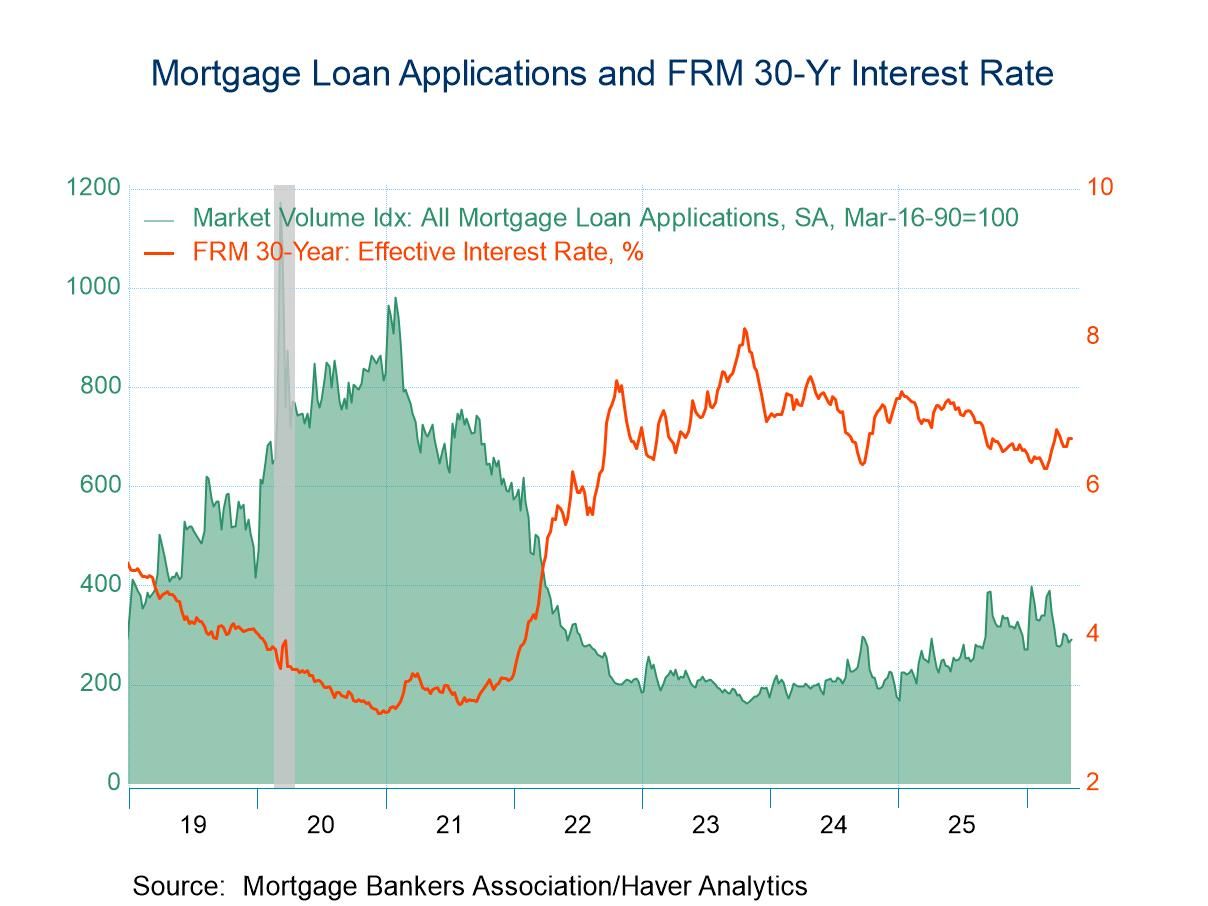
- Purchase applications -3.7% w/w, first decrease in three weeks; refinancing loan applications -5.0% w/w, second consecutive drop.
- Effective interest rate on 30-year fixed loans up 10bps to 6.64%, a four-week high.
- Average loan size up for the fifth straight week, highest level since the March 6 week.
- of2715Go to 1 page