GDP in the European Monetary Union rose by 1.3% at an annual rate quarter-to-quarter in the fourth quarter of 2025. This is a step up from 1.1% in the third quarter and from 0.6% in the second quarter. Year-over-year growth in the monetary union slowed to 1.3% in the fourth quarter compared to 1.4% in the third quarter and 1.5% in the second quarter; however, GDP growth is holding up well, and the quarterly profile suggests that the current growth rate is solid.
Early-stage GDP reporters At this early stage, only seven countries have reported publicly GDP figures, and we see them in the table. Among them, the strongest growth rate in the fourth quarter is from Portugal at 3.2%, followed by Spain at 3.1%, and then the Netherlands at 2.1%; the weakest growth rate reported in the table is from France at 0.7% at an annual rate in Q4.
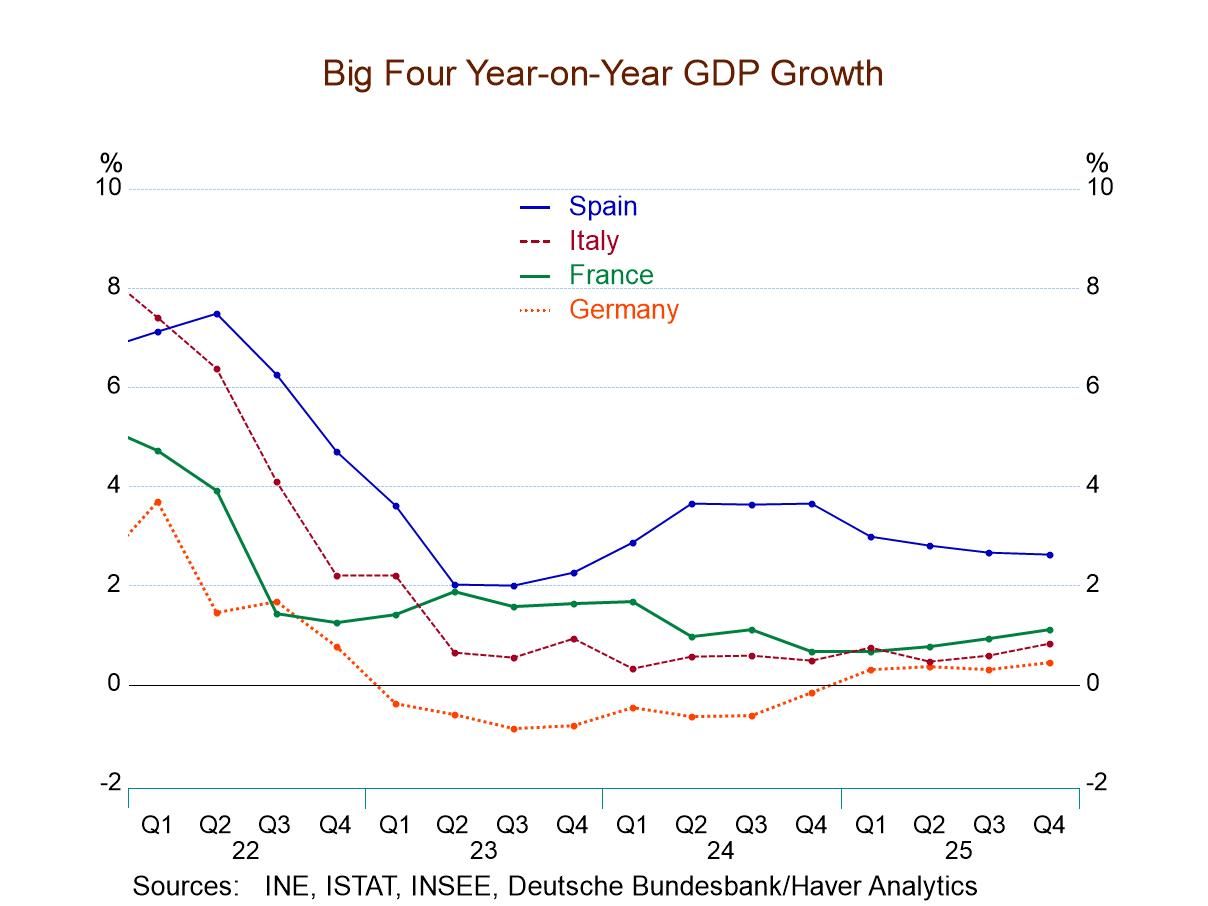
Quarterly acceleration/deceleration In the fourth quarter with GDP measured quarter to quarter, GDP has accelerated in the monetary union from 1.1% in Q3 to 1.3% in Q4. At the country level, there are accelerations in Germany, Italy, Portugal, and Spain; the Netherlands logs the same growth rate in Q3 as in Q4 at 2.1%. Belgium and France log slowdowns, with Belgian growth posting a 0.8% annual rate in Q4 compared to 1.0% in Q3 and with France at 0.7% in Q4 compared to 2.1% in Q3.
Year-on-year trends Year-over-year trends are different from this, however. On a year-over-year basis, the monetary union shows slightly slower growth at 1.3% in Q4 compared to 1.4% in Q3. Accelerating comparisons show Belgium, France, Germany, Italy, and the Netherlands all on rising growth rate profiles for year-on-year growth. Growth slows quarter-to-quarter in Portugal and in Spain.
Growth in historic context The year-on-year growth rate overall ranked on data back to 1997 shows only Italy and Portugal with rates of growth above their respective medians for the period (back to 1997). Italy's growth rate has a 55.4 percentile standing, the same as for Portugal. Spain’s 48.9 percentile standing places its growth rate near its median, while the other countries produce growth rates largely in the mid-30th to low 40th percentiles for this period.
Large economy/small economy Comparing growth rates for the largest four economies to the rest of the monetary union, we have the large economies growing stronger quarter-to-quarter in the fourth quarter of 2025 at 1.4% compared to 1.2%; this is a reversal of the pattern that we saw in Q3 and Q2. In fact, the year over year growth rates show the four largest economies growing slower than the rest of the monetary union, for the last four quarters. In the fourth quarter, they have a 40.2 percentile standing on growth rates back to 1997 while the rest of the monetary union comes in very close to its median growth rate with a percentile standing at 48.9%. It doesn't appear that any particular part of the monetary union is doing especially well, but the smaller countries appear to be closer to normal than the larger countries where growth remains more significantly challenged than it has been over the last 30 years.
 Global