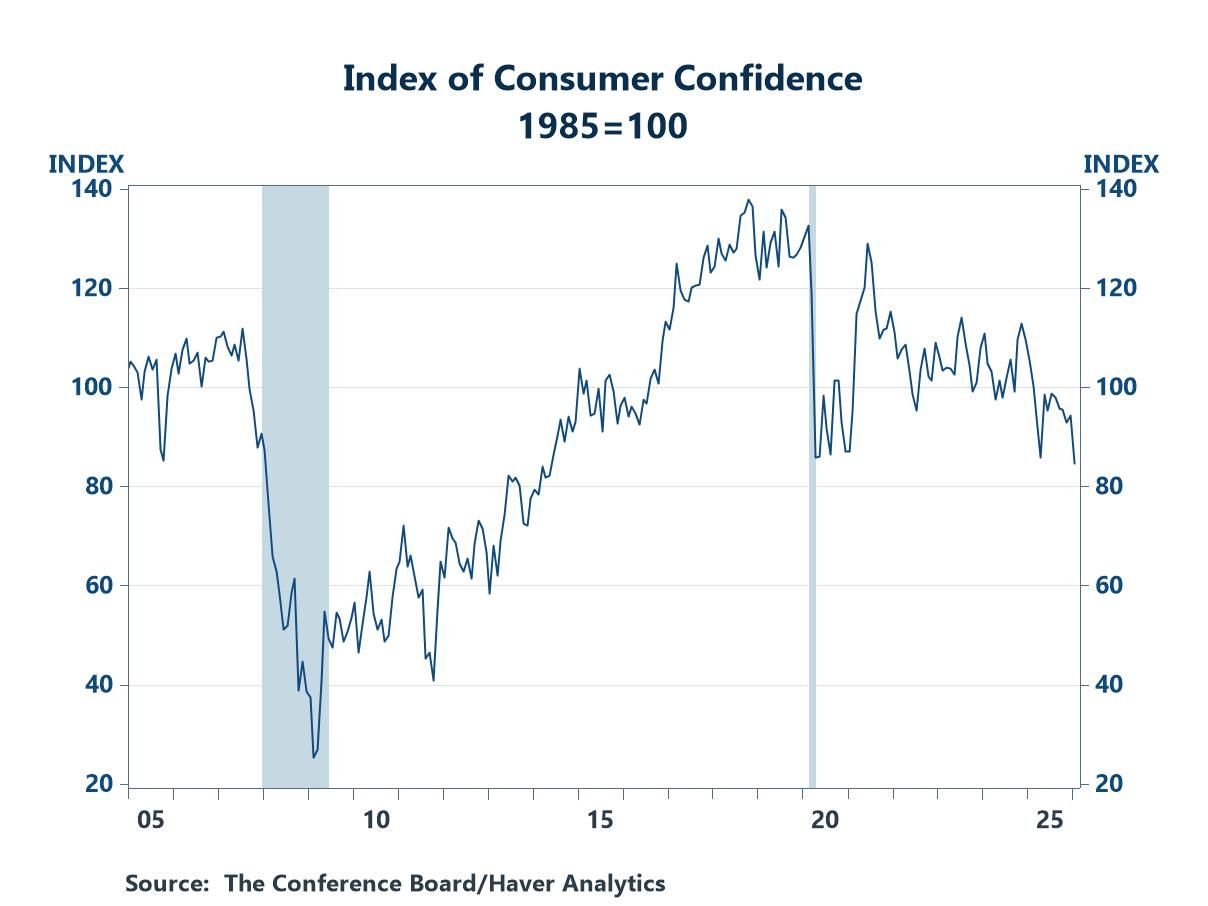
- Both expectations and assessments of the present situation contributed to the decline
- The index moved to a new low for the current cycle.
- A softening labor market played a role.
 USA| Jan 27 2026
Consumer Confidence Tumbled in January
 USA| Jan 27 2026
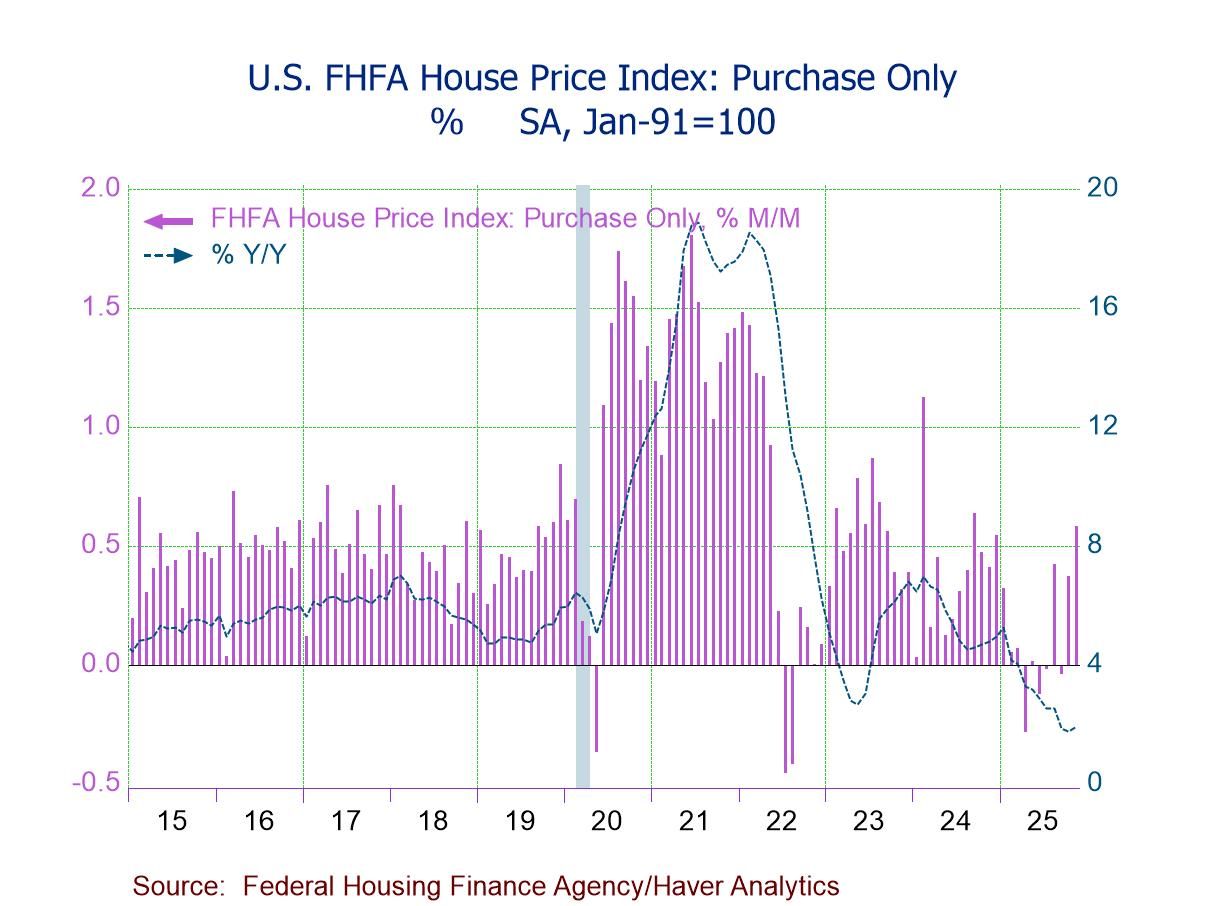
U.S. FHFA House Prices Advance in November
- FHFA HPI +0.6% (+1.9% y/y) in Nov., third m/m gain in four months.
- House prices up m/m in eight of nine census divisions, led by East South Central (+1.1%); prices flat m/m in Middle Atlantic.
- House prices up y/y in six of nine regions, led by East North Central (+5.1%), but down in Pacific (-0.4%) and Mountain (-0.1%); prices flat y/y in South Atlantic.
 Europe| Jan 27 2026
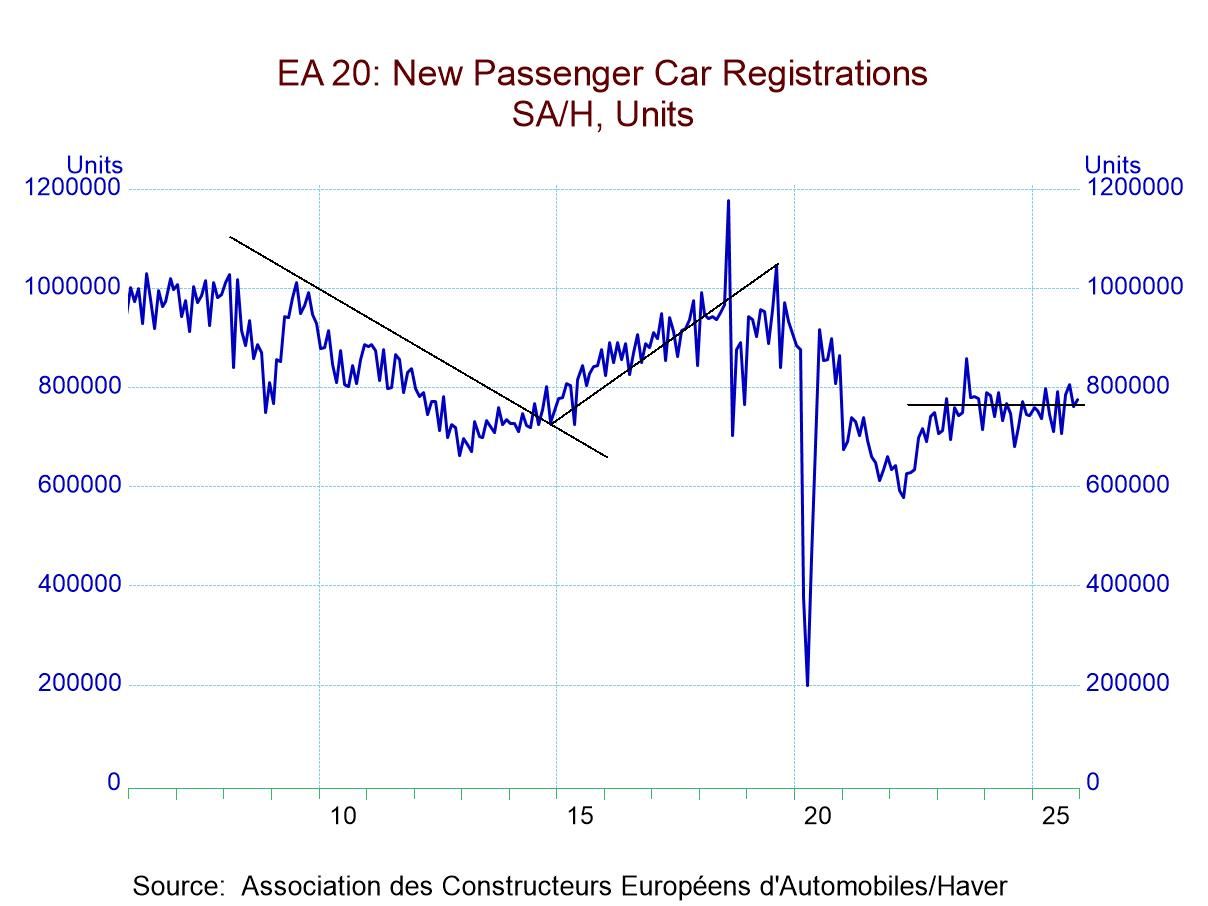
European Vehicle Registrations Show Some Life
European vehicle registrations rose 2% in December compared to November; year-over-year registrations are up by 4.5%. The three-month average in December is lower by 0.4% compared to where it was in November and the three-month average has a 12-month growth rate of 3.8% compared to the unadjusted rise of 4.5%.
The growth rate progression shows a 12-month growth rate of 4.5%, jumping up to a 19.5% annual rate over six months and falling back to a contraction of 4.8% at an annual rate over three months. However, the annualized growth rates calculated from three-month moving averages show a 12-month gain of 3.8%, a six-month gain of 8.1%, and the three-month gain of 10.8%. The 3-month smoothed data show that there is an ongoing acceleration in car registrations that is masked by volatility in the month-to-month numbers: the 10.8% growth rate over three months is quite a good sign if it can hold up and, of course, it's on the heels of 8.1% growth over six months.
Looking at the individual reporting countries Germany, France, Italy, Spain, and the United Kingdom, we see gains in registrations in December compared to November in three countries. In the U.K. registrations rise by 6.1% month-to-month, in Italy they rise by 4.2% month-to-month and in Germany they gain 1.8%; however, registrations fall on a month-to-month basis by 2.1% in Spain and by 1.5% in France.
The country level sequential growth rates show a mixed picture in Germany where registrations are up 10.6% over 12 months and accelerate to 19.5% over six months but are declining at a 16.8% annual rate over three months. In France registrations rise by 3.6% at an annual rate over three months; however, they are stronger over six months and they then are contracting over 12 months. In Italy registrations are up by 2.5% over 12 months, the growth rate jumps to 25.4% at an annual rate over six months, but then, over three-months, registrations fall at a 1.8% annual rate. Spain also shows erratic performance with the decline of 2.9% over 12 months, a gain over six months and then a decline at a 12.4% annual rate over three months. And the U.K. registrations trends are deteriorating with a 3.7% gain over 12 months, a 4.8% annual rate drop over six months, and then over three months the annual rate plunges to -30.8%.
The reporters in the table show registrations weaker than they were in January 2020 just before the COVID virus struck; overall registrations are lower by 12.2%. Registrations are down by 13.3% in Italy, down about 10% in Germany and France, down by 5.7% in Spain, while the U.K. registrations are lower at just 1.5%
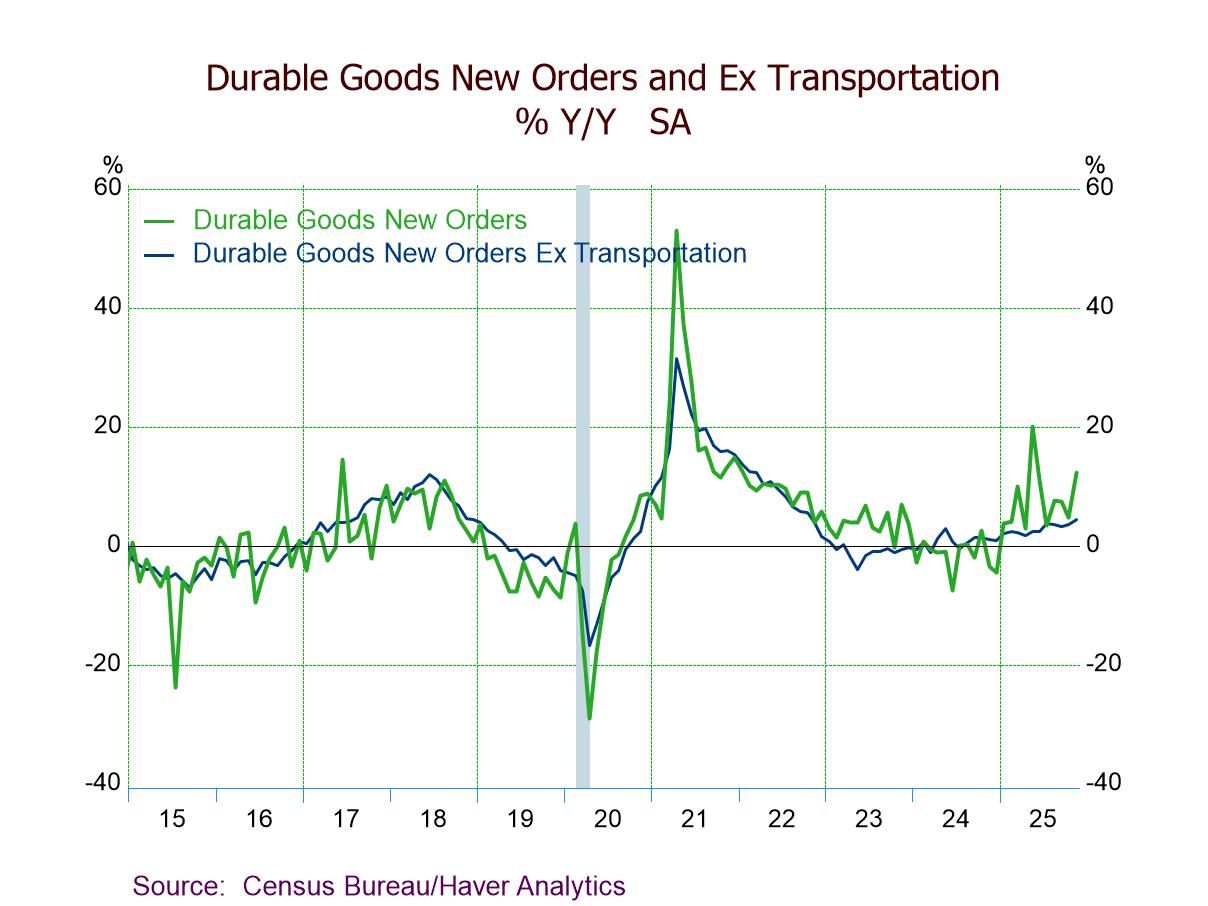
- Headline orders +5.3% (+12.3% y/y) in Nov., third m/m rise in four months.
- Nondefense aircraft orders surge 97.6% m/m vs. a 17.8% Oct. drop.
- Transportation orders rebound 14.7% m/m; orders ex transportation rise 0.5%.
- Core capital goods shipments +0.4%, sixth m/m gain in seven months, adding to Q4’25 momentum.
- Durable goods shipments -0.2%; unfilled orders +1.3%; inventories +0.2%.
 Germany| Jan 26 2026
IFO Readings for Germany Mostly Waffle; Services Lag
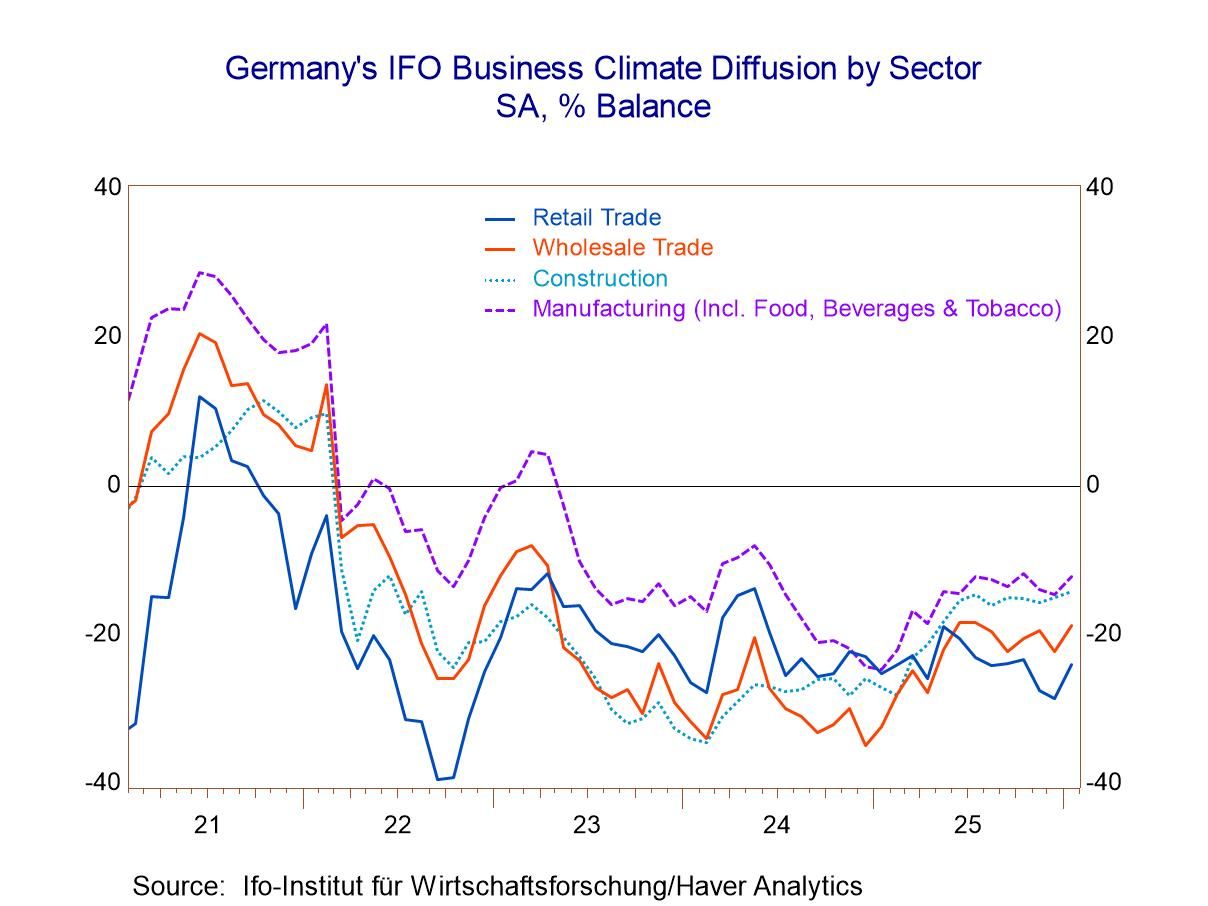
Germany’s IFO readings in January show a bit more strength in the climate reading, nearly unchanged current conditions, and nearly unchanged expectations. These readings that tend toward small changes or unchanged readings are - and have been - characteristic of the IFO survey for most of 2025 where the various sector readings basically made some improvement through about the first quarter of the year and then pretty much flatlined for the rest of the year. Growth Dynamics in Germany have become fairly stagnant. The question is when something will occur that will light a fire under growth or, more unfortunately, send the economy back into a tailspin.
The climate readings on long-dated rankings are all weak with only one reading for construction above its 50th percentile and data back to 1993. However, on a shorter timeline looking at conditions just since February 2022 that marks the invasion of Ukraine, we have the climate reading at a 63.8 percentile standing, construction at an 89.4 percentile standing and wholesaling at a 72.3 percentile standing. Manufacturing also manages a positive standing at its 55.3 percentile.
Month-to-month in January, there are small changes afoot across the five sectors and all of them show some modest improvement except for services that backtrack slightly moving from a reading of -2.1 in December to -2.6 in January.
Current conditions show almost no change at all with a -4.8 reading in January compared to a -4.9 reading in December. Across sectors in January, there's about a two-point improvement in manufacturing, a small improvement in construction and more sizable improvement in wholesaling, a small improvement in retailing, and a step back for services.
For current conditions, the percentile standings on the long-view to 1993, again, show only construction with a reading above its 50th-percentile - that is, above its historic median - at 61.6%. The all-sector reading has only a 11.9 percentile standing which is quite weak and generally weaker than the individual sectors. That fact simply underpins the notion of how this coincident-weakness across all the sectors is unusual because the all-sector index has a weaker ranking than any of the individual industries or sectors on the long timeline. On the shorter timeline, construction, again, is at a 59.6 percentile reading, above its 50th percentile, wholesaling comes close at a 48.9 percentile, reading retailing is exceptionally weak at a 4.3 percentile reading, and services are at a 10.6 percentile rating also quite weak. The current index is dominated by weakness.
Expectations in January show a step back for the overall reading and that's based on weakness in services. There are nearly 3-points of improvement in manufacturing, unchanged readings in construction, a slight improvement in wholesaling, a sizeable 6-point improvement in retailing, and a weaker reading from services, which back off by half a point on the month. The percentile standings when data are ranked over the long period to 1993 show everything below the 50th percentile; all rankings are below their historic medians on that timeline. However, when compared to February 2022, marking the invasion of Ukraine, all of the readings are above their 50th percentile, generally in about the 80th or 90th percentiles, except for services that only manage a ranking in the 55th percentile.
 Asia| Jan 26 2026
Economic Letter from Asia: Forecasts, Chips, and Polls
This week, we take stock of key developments across Asia. The IMF’s latest outlook delivered several positive growth revisions, with India once again seen at the forefront of regional expansion, while China is still seen unlikely to reach a 5% growth target this year should it be adopted (chart 1). Between China and the US, a clear divergence in trade strategies persists. China has continued to pivot toward Asia to sustain relatively robust export growth, while the US has turned inward—effectively narrowing its trade deficit in line with President Trump’s objectives (chart 2). Within Asia, trade ties with China have become increasingly two-way, as China’s share as an export destination has risen steadily over the past decades to rival that of the US for many economies (chart 3).
In the AI space, notable developments emerged following reports that Chinese authorities may soon formally allow domestic tech firms to import Nvidia’s H200 chips. The news could provide a boost to US tech equities, although broader geopolitical risks remain a possible resurgent drag on sentiment (chart 4). Turning to Japan, last week’s Bank of Japan (BoJ) meeting left policy rates unchanged, as expected. However, the BoJ’s latest outlook report delivered upgrades to both growth and inflation forecasts—developments that could pave the way for further monetary tightening (chart 5), albeit likely only after near-term uncertainties, most notably upcoming snap elections, have passed. Ahead of the polls, the yen and Japanese government bonds have come under sustained pressure (chart 6), though short sellers may become more cautious given the risk of official intervention.
The IMF’s World Economic Outlook The International Monetary Fund (IMF) unveiled its updated forecasts last week in its World Economic Outlook (WEO) publication. On growth, World GDP growth for 2026 was revised up by 0.2 ppts to 3.3%, driven by a surge in technology investment, including AI. China and India each saw a 0.3 ppt upgrade to their growth forecasts, while Japan and South Korea received more modest 0.1 ppt upgrades. Within Asia, India continues to be seen as the region’s growth leader (chart 1). By contrast, despite the IMF upgrade, China is still not expected to reach 5% growth this year should it re-adopt such a target, though there has been some discussion of a lower target range of 4.5–5%. On the downside, only a handful of economies saw downgrades; in Asia, the Philippines stands out with a 0.1 ppt downward revision to 5.6% for the year.
 Global| Jan 23 2026
S&P Flash PMIs Rebound But Emit No Clear Signal
The S&P PMIs for January show flash readings that indicate broadly stronger conditions across the early reporters in this table. Exceptions are the European Monetary Union as a whole with its composite reading weaker and France with its composite reading weaker, but Germany, the United Kingdom, Japan, Australia, India, and the United States all have composite readings that are stronger month-to-month in January. With these eight countries, there are 24 readings in each period, three for each country: a composite, one for manufacturing, and one for services. Among these 24 readings, only five of them were weaker month-to-month in January. Of course, this follows a December when only 6 of the readings were stronger month-to-month.
The sequential readings, that we calculate only off hard data (which means that calculations are done from December backward) are still mixed. Substantially weaker conditions period-to-period are reported comparing three-months to six-months. Over three months, only nine of the 24 readings are stronger whereas over six months only one of the 24 readings is weaker when compared to the 12-month average. Over 12 months, the average is stronger than it was one-year ago in 15 of the 24 readings.
Only the United States and France have service sectors that are below their medians over this period back to 2022. Only France and India have composite readings that are below their respective medians over this period. But by comparison, there are very strong composite readings as well. There is a 91-percentile standing on the composite in Australia, an 87-percentile standing in Japan and the United Kingdom. The German composite has a 79-percentile standing.
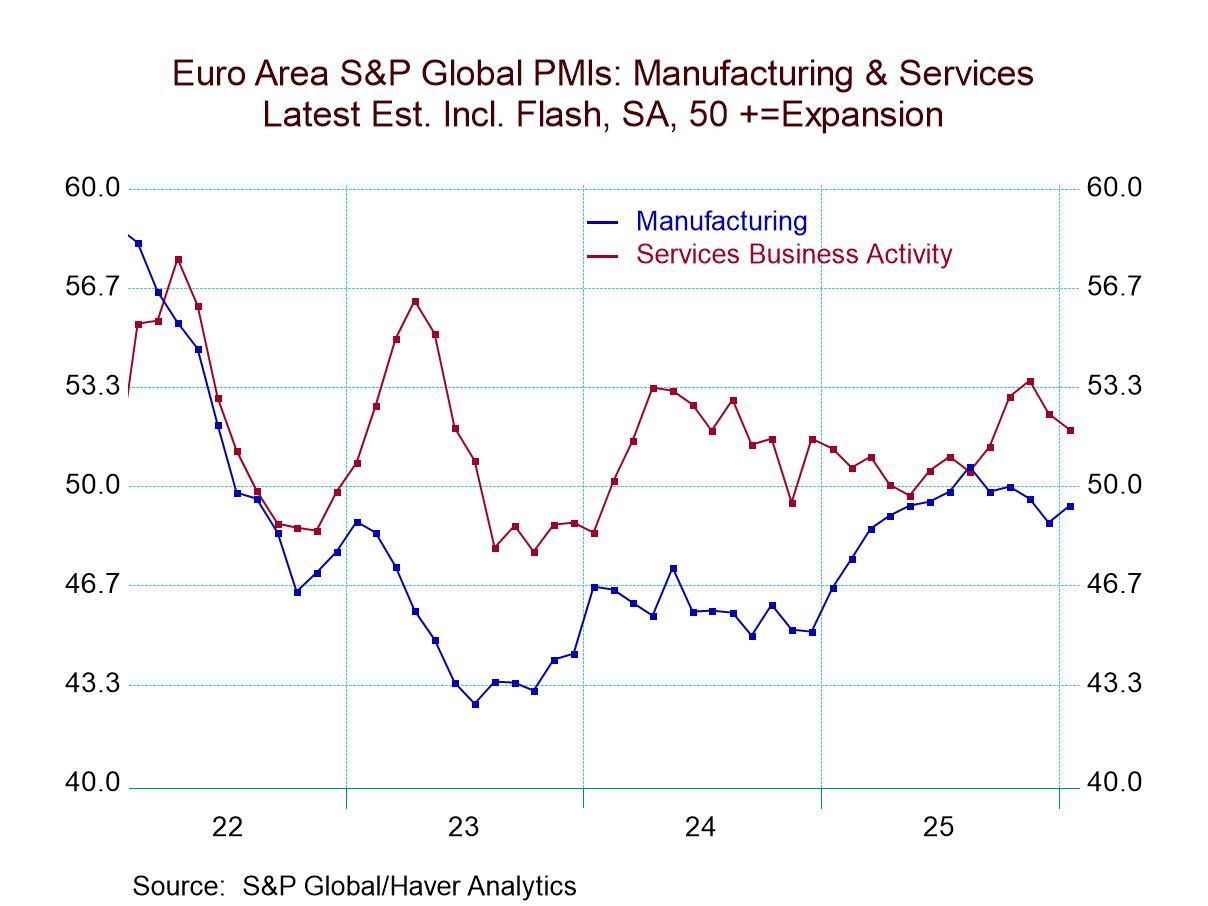
The recent data have been running sporadically hot and cold, making it difficult to make sense out of what's happening. But broadly, it's clear that the PMIs in the European Monetary Union have been working their way higher and this is the general theme.
For the 8 reporters in the table back to January 2022, all of them except India show weaker manufacturing readings in January 2026 than what they showed in January 2022. But January 2022 was, of course, part of the COVID recovery move. Manufacturing in the European Monetary Union slipped from its high point over this period to its low point around mid-2023.
 Global| Jan 22 2026
Charts of the Week: Seeing Green
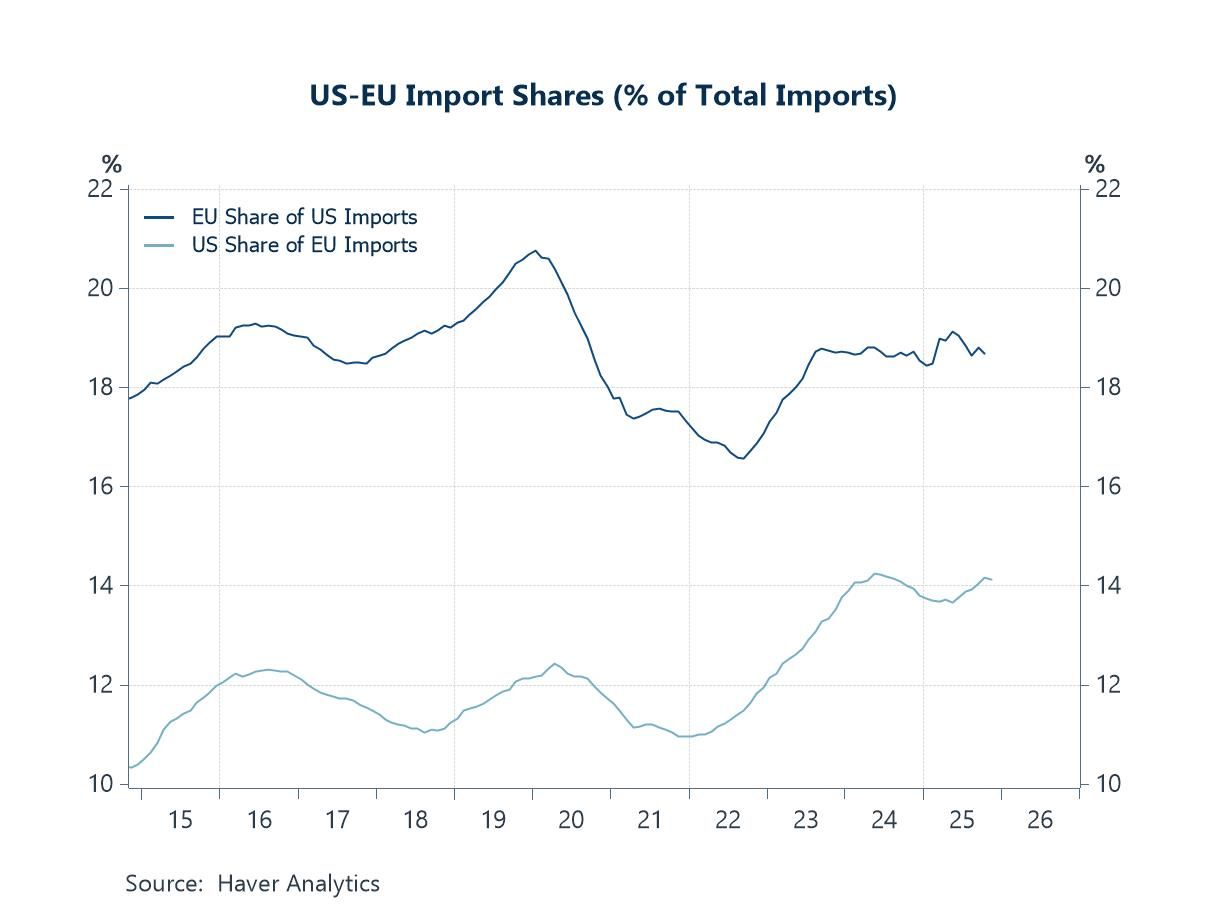
This week’s data and market moves have been framed by an abrupt escalation in geopolitical tensions surrounding Greenland, which has served as a catalyst for broader financial unease rather than a standalone shock. The episode has sharpened investor focus on US policy predictability, amplifying concerns already evident in the charts on EU–US trade exposure, where tariff threats risk feeding directly into confidence effects and capital flows. At the same time, recent turbulence in Japanese government bonds appears to have been an underappreciated driver of the sell-off in US Treasuries, highlighting how global capital reallocation—rather than geopolitics alone—has contributed to higher US yields. These forces intersect with growing questions around the durability of US monetary credibility, as inflation expectations have shown signs of decoupling from traditional oil-price anchors, raising the sensitivity of markets to any perceived constraints on the Federal Reserve. Beyond the US, UK data delivered a modest upside surprise in headline inflation, with persistent services and wage pressures reinforcing a cautious policy backdrop for the Bank of England. In China, meanwhile, Q4 GDP growth of 4.5% y/y kept full-year expansion aligned with the government’s target, but continued weakness in the property sector remains a significant drag on investment and household confidence. Taken together, the week’s developments point to a global outlook increasingly shaped by geopolitical risk, capital-flow dynamics and domestic structural constraints, rather than by straightforward cyclical momentum alone.
by:Andrew Cates
|in:Economy in Brief
- of2693Go to 3 page