Haver Analytics
Haver Analytics

Economy in Brief

    • Retail inventories up 0.6%, led by motor vehicles.
    • Business sales flat in May as manufacturers’ shipments fell.
    • Overall inventory/sales ratio unchanged for a fourth month.
  • EMU trade trends show a decline in both exports and imports in May; exports fall harder than imports. Exports decline in May, but log a small increase over six months; they are generally contracting or weak on all horizons. Contrarily, imports fall over 12 months, then step up to grow by 2.3% over six months and even faster growing at a 7.2% annual rate over three months.

    We can divide export trends into manufactured goods vs. nonmanufactured goods. Manufacturing exports fall over three months, six months, and 12 months. The declines are in a rough range of -1.5% to -2.5%, annualized. Exports of nonmanufactured goods grow over all horizons but are also slowing steadily from 9.9% over 12 months to 4.6% at an annual rate over three months.

    On the import side of the ledger, manufacturing imports are gaining pace and accelerating. Growth logs -8.1% over 12 months, then registers at a -1.8% annual rate over six months before imports break out to grow at a 5.5% annual rate over three months. Imports of nonmanufactured goods have generally stepped up from a 1.8% growth rate over 12 months to a 12.9% pace over six months then stepping back to a still-strong 11% annual rate over three months.

    Export and import data for the EMU is for the region’s trade with areas outside of the EMU. All intra-community trade is netted out. The strength in imports suggests that some recovery may be afoot in the community with both imports of manufactured and nonmanufactured goods improving. Exports, on the other hand, show that the EMU export markets may still be quite weak since manufacturing exports are widely contracting and exports of nonmanufactured goods are slowing. Both hint at demand weakness.

    Select data for a few European economies show German exports and imports both declining and both decelerating. France shows a tendency for imports to slide as its exports gain footing and accelerate. U.K. exports and imports are transitioning from declines over 12 months to increases over three months. Export data show a slippage with growing declines and weakness for Finland and Portugal. In contrast, Belgian exports are gathering strength and accelerating modestly, sequentially.

    Trade trends show mixed results with manufacturing data underlining ongoing weakness while manufacturing imports are growing at a stepped-up, strong pace. The EMU trade balance has been relatively steady over 12 months, six months, and three months. The balance on manufactured goods is exceptionally steady at a surplus of €37bln to €39bln. The balance on nonmanufacturing trade has been steady over 12 months, six months and three months at €23bln.

  • In this week's newsletter, we explore shifts in trade patterns across Southeast Asia. Our analysis reveals considerable changes in the region's export landscape, both in terms of destination markets and product composition. Economies like Vietnam and Thailand are now proportionally increasing their exports to the US, whereas Indonesia has seen a marked rise in shipments to China. Further investigation into ASEAN-6 exports highlights a growing dominance of electronic and electrical products, barring Indonesia. This trend reflects both the current upswing in the electronics cycle and deliberate strategies by regional economies to capitalize on heightened global demand, including for semiconductors.

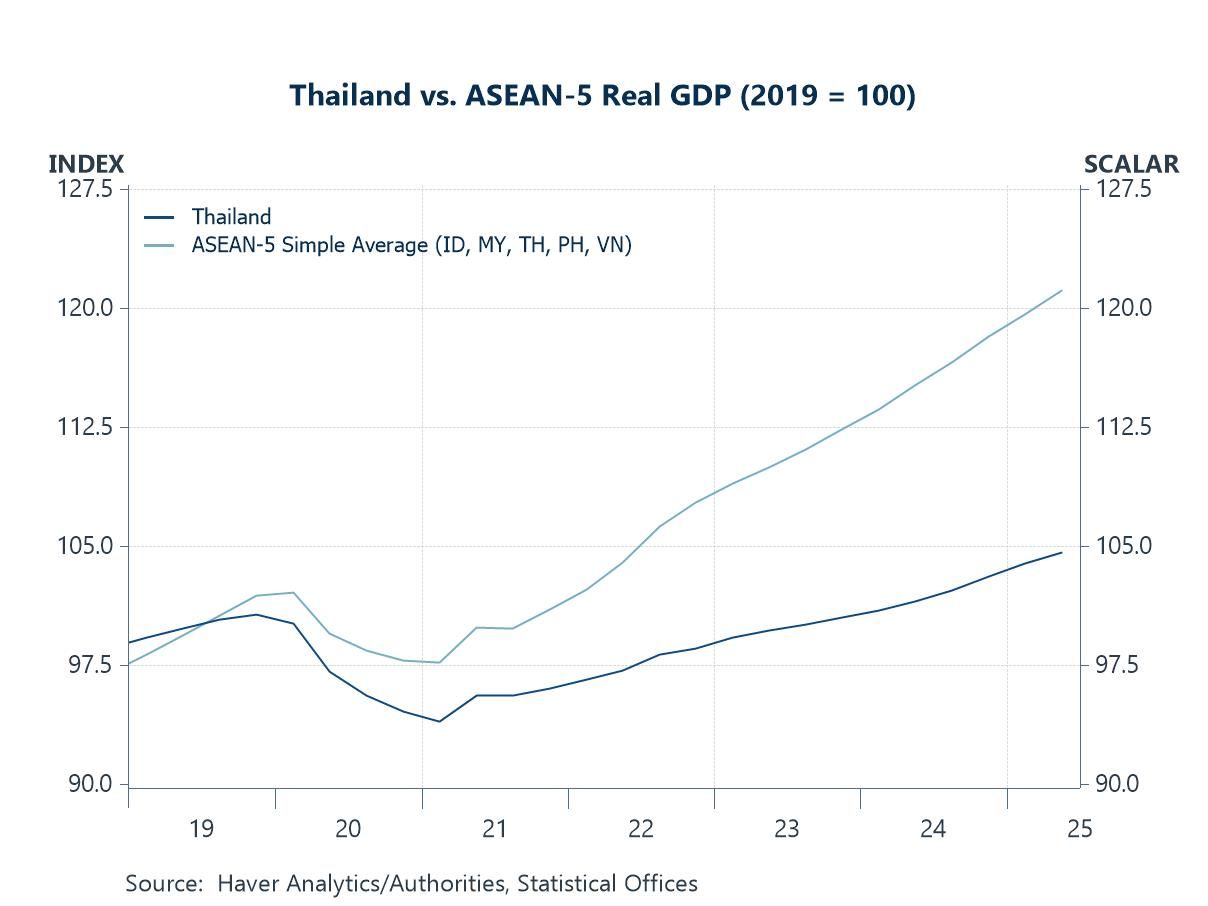
    We also delve deeper into Vietnam, where gains stem from global supply chain shifts and deepening economic integration with China, its geographical neighbour. Our focus then shifts to Indonesia, emphasizing its unique reliance on commodity exports within the ASEAN-6, particularly in its trade relations with China. Lastly, we examine labour and productivity dynamics within the ASEAN-6. We discuss potential challenges arising from rising labour costs, which could impact regional competitiveness. Conversely, we also highlight substantial productivity advances in Vietnam, which contrast with slower progress seen in peers such as Thailand.

    Trade shifts by export destination and product The global trade landscape continues to evolve, even in Southeast Asia. Chart 1 illustrates how the trade destination mix among Southeast Asian economies has undergone significant changes compared to the pre-pandemic era. For one, economies such as Thailand and Vietnam have experienced a substantial increase in their share of exports to the US since late 2019. Equally noteworthy, Indonesia has seen a surge in its exports to China during this period. Interestingly, Vietnam and Singapore have also shown an uptick in their share of exports to China, albeit to a lesser degree. These trends challenge, at least for ASEAN-6 economies, narratives of trade diversification away from China. Moreover, the importance of exports to the EU and Japan has declined for the region in recent years.

    • Negative reading indicates slightly greater rate of contraction.
    • Inventories & order backlogs decline while new orders, shipments & employment edge higher.
    • Prices paid rise slightly but prices received ease.
    • Expectations decline but upward trend remains in place.
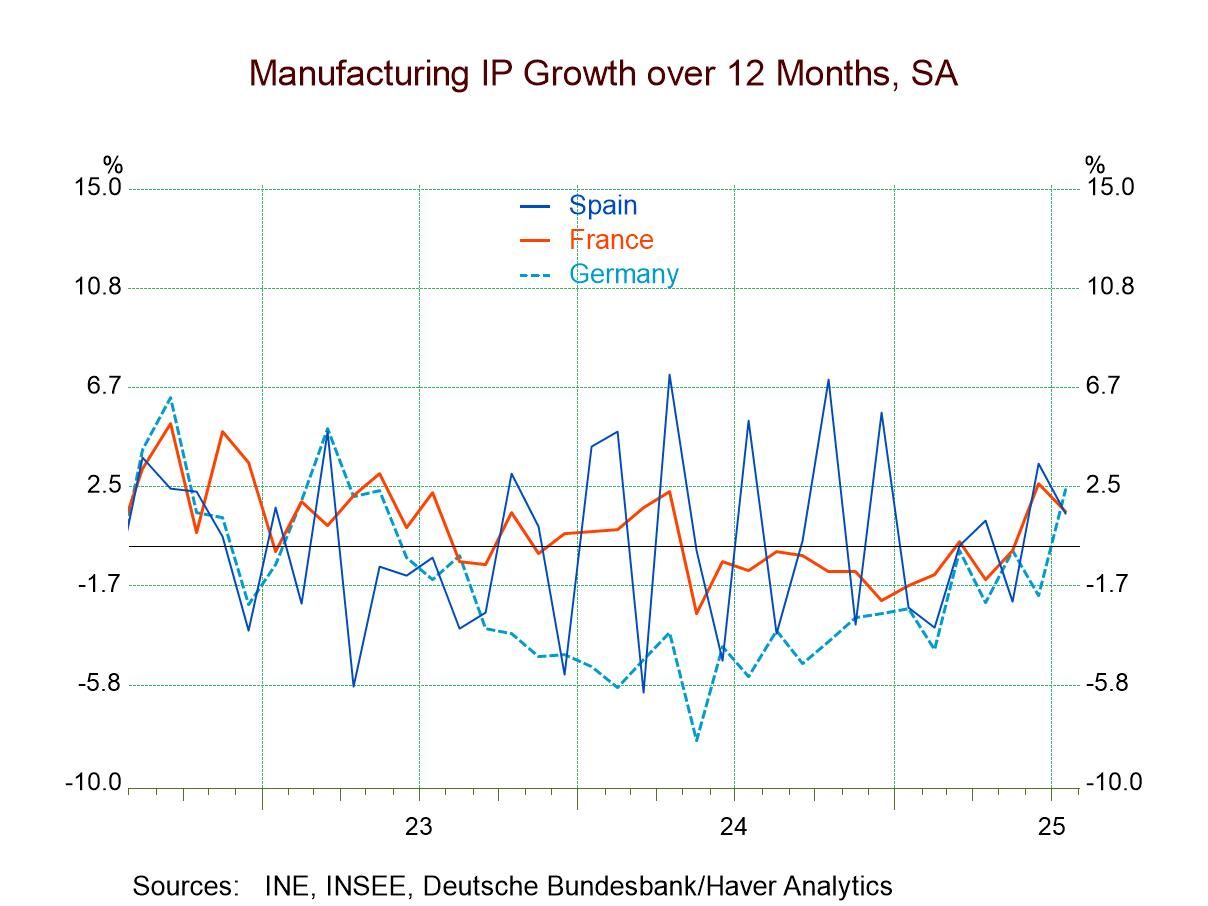
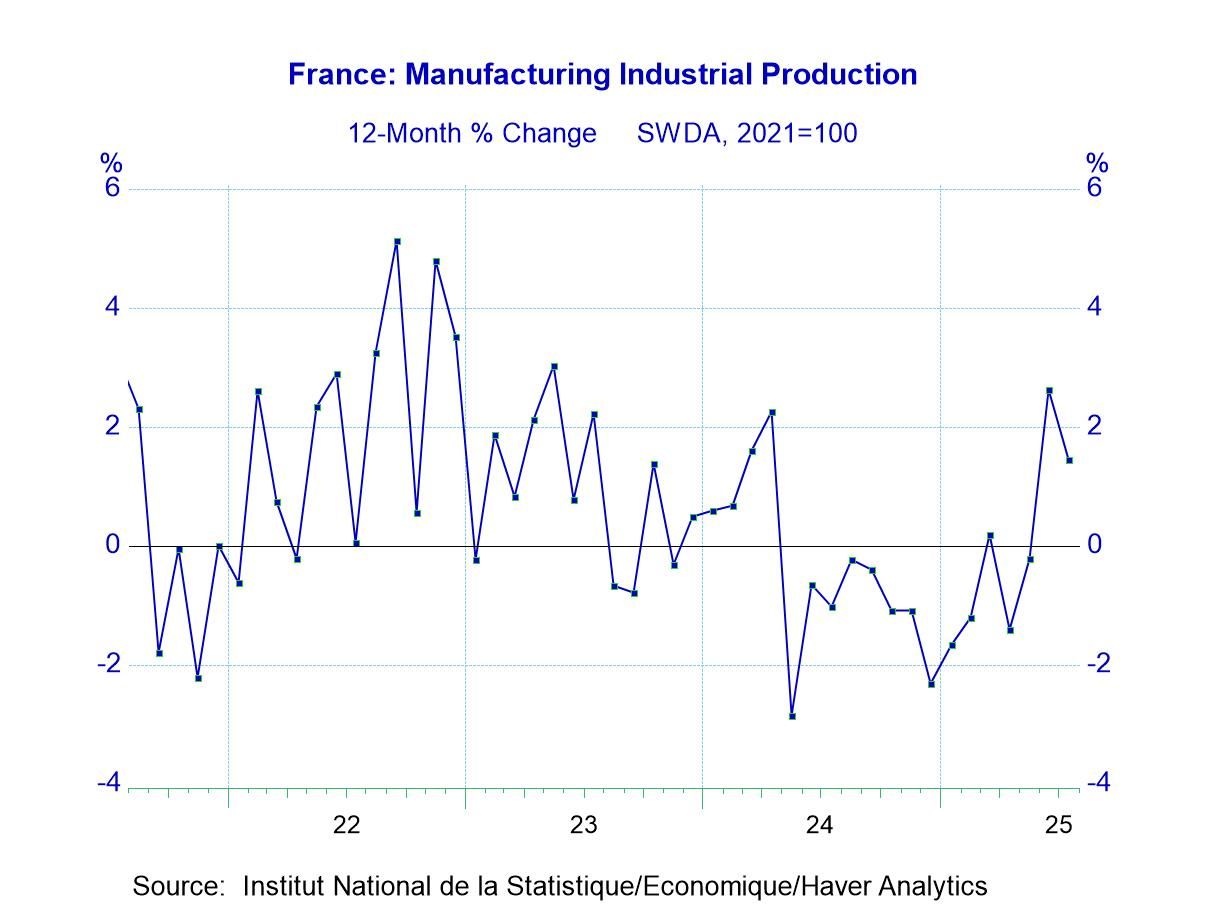
  • European IP trends are muted in May as the headline fell by a sharp 0.6% month-to-month after coming up flat in April. Manufacturing output fell by 0.8% month-to-month. Output in May fell in consumer durable industries, for intermediate goods and for capital goods. In seven of thirteen EMU members presented in the table output also fell in May. Month-to-month changes in output, while admittedly are quite volatile, show flip-flopping as 46.2% of table reporters demonstrate accelerating output in May compared to 53.8% in April and 30.8% in March.

    EMU output is in the process of a ‘soft acceleration.’ I term it as such because growth rates get progressively larger from 12-months, to 6-months, to 3-months. But all these growth rates are negative. So, the declines are becoming less pronounced. Manufacturing displays the exact same general characteristics.

    Sector growth rates sequentially show consumer goods output growing on all horizons and engaged in a steady sequential acceleration. Consumer durables are closer to showing a declining trend on all negative sequential rates of growth. Nondurable consumer output is close to a pure sequential acceleration on very strong growth over three months and positive growth over all three sequential periods. Intermediate goods have no clear trend, but output does decline on all horizons. Capital goods output is also trendless but logs a rise over three months after significant declines logged over six months and 12 months.

    The EMU median shows three negative numbers across the 13-reporting members. With acceleration across these members fading from 58.3% over 12 months and 66.7% over six months to 33.3% over three months.

    Quarter-to-date (QTD) growth shows a gain for the EMU over all as headline IP is up at a 0.2% pace and manufacturing is up at a 0.7% annual rate. However, across 13 members in the table, eight report QTD declines in manufacturing sector output. However, there are three showing growth QTD that is very strong growth, of 20% or more, and another showing growth of nearly 17% (Belgium).

    Output in EMU countries flounder through May. The trends are mild or muted even where they are somewhat positive.

    • Services prices surge.
    • Goods prices less food & energy are unchanged.
    • Energy prices fall again; food prices weaken.
    • Affordability continues to fall, w/ HAI down for four straight months.
    • Median sales price of a home rises for the fourth consecutive month to a record high.
    • Mortgage rates up to a six-month-high 7.14%; mortgage payments up to a record high.
    • Median family income rises to a record-high $102,364 (+5.3% y/y).
  • EMU inflation ticked up by 0.1% in June after also rising by 0.1% in May – good stuff! The large countries show May changes ranging from 0.3% to -0.1%. May saw inflation rising in a range of 0% to 0.2% for the Big Four economies. That’s a nice, tight, low range.

    Sequential inflation shows headline inflation running at 2.5% over 12 months and at 2.8% over six months, that decelerates to 1.7% over three months, more good news. But across the large economies in the EMU, inflation generally accelerates over three months to a 5.4% pace in Germany, 3.5% in France, and 3.0% in Italy. Only Spain shows a slower 1.7% pace. However, the year-on-year rates are more target-friendly. There, Spain has a high gain at 3.6%, Germany and France have 12-month rates that cluster around 2.5%, and Italy has a gain of 1%.

    However, when we look at the core – excluding food & energy or just ex-energy - the results are much less target-friendly. Year-over-year France and Italy are close to target, with France at 1.9% and a 2.1% pace in Italy. German inflation is up at a 2.6% pace ex-energy while the core in Spain has inflation up by 3%. However, the tables are turned over three months where Germany and Spain show inflation as moderate at a 2.1% pace and France and Italy have core inflation up at a 2.6% to 2.8% pace. Still, these numbers are getting closer to the ‘two-percentish’ target the ECB current has.