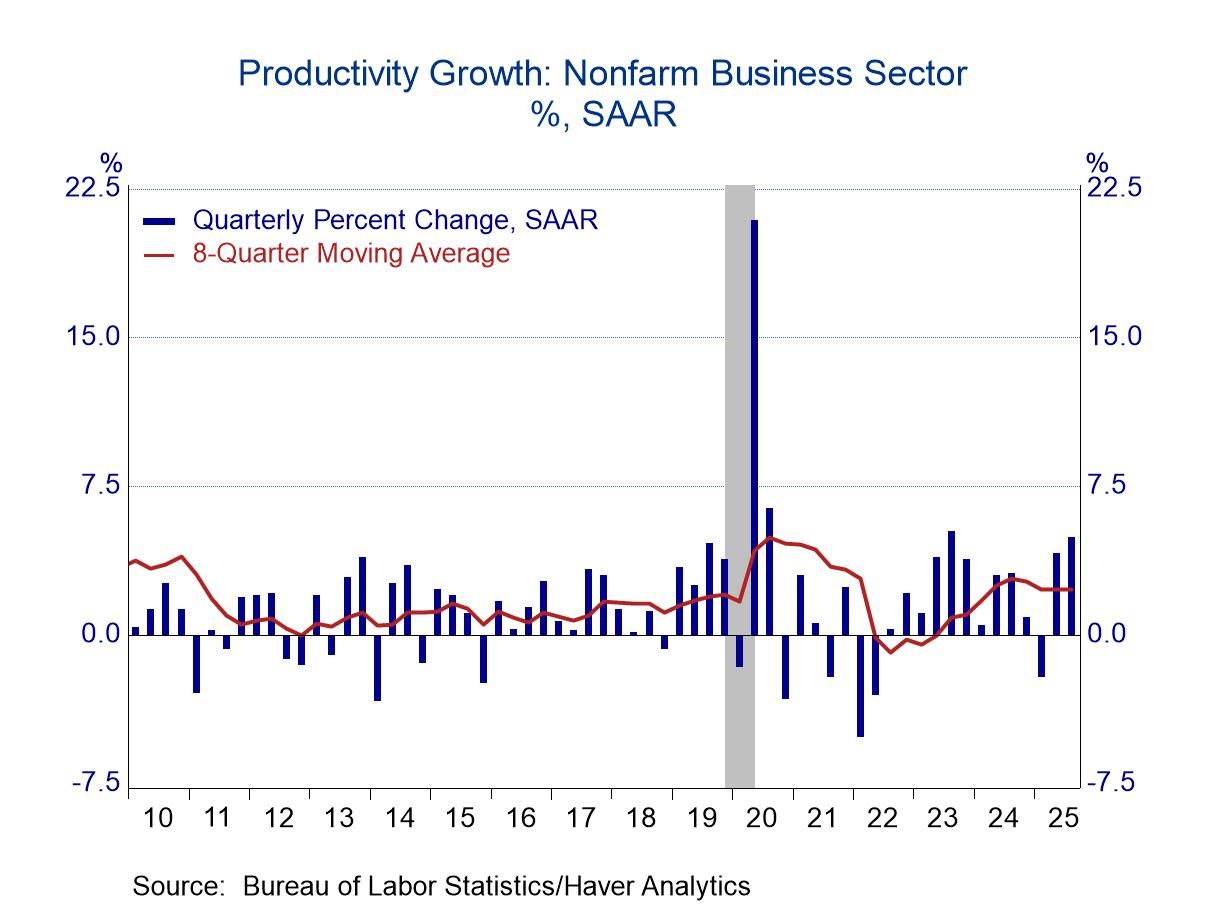
- Strong growth in output with little increase in labor input reinforced a firm underlying trend in productivity.
- Efficiency gains in Q3 more than offset growth in labor compensation.
 USA| Jan 29 2026
Revised Productivity: No adjustment to Robust Growth in Q3
 USA| Jan 29 2026
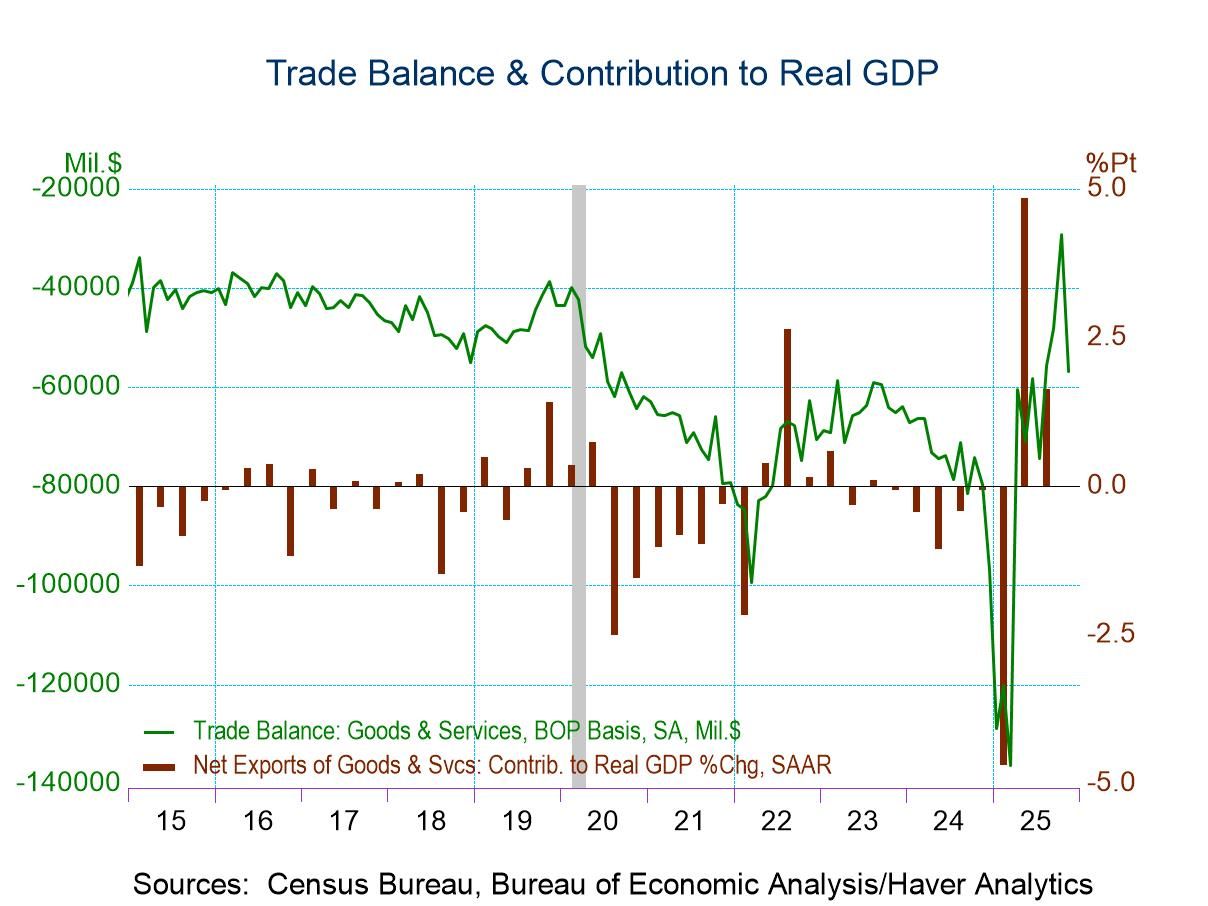
U.S. Trade Deficit Widened in November
- The overall deficit widened to $56.8 billion in November from $29.2 billion in October.
- The goods deficit widened markedly to $86.9 billion from $59.0 in October.
- The services surplus widened modestly to $30.1 billion from $29.8 billion in October.
- Exports fell 3.6% m/m, the first monthly decline in six months, while imports rebounded 5.0% m/m.
by:Sandy Batten
|in:Economy in Brief
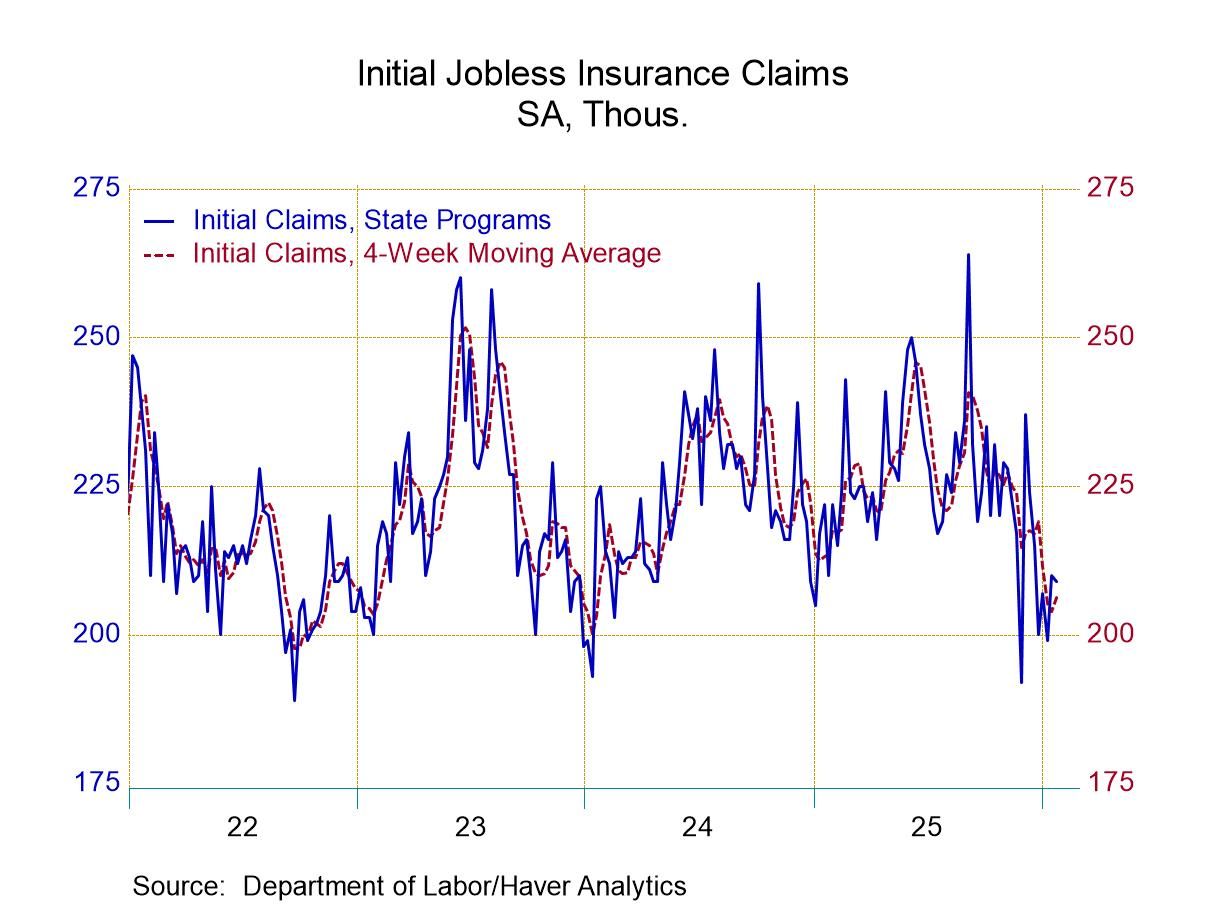
- Initial claims declined by 1,000 from the prior week.
- Continuing claims declined by 38,000 from the prior week to the lowest level since September 2024.
- The insured unemployment rate was unchanged.
 Europe| Jan 29 2026
EU Commission Indexes for EMU Turn Higher
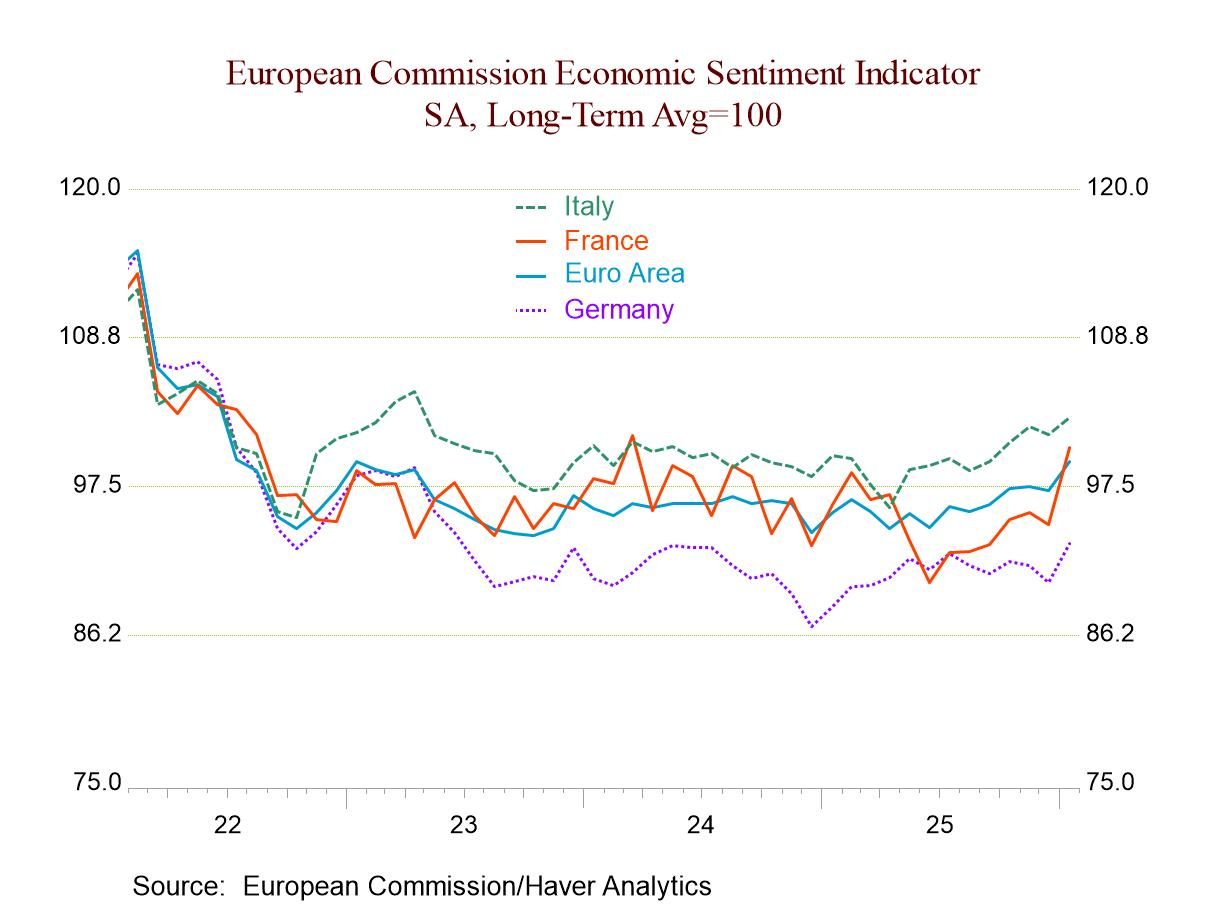
In January, we see an uptick in the EU Commission indexes that chronicle conditions in the European Monetary Union. The overall index is up smartly to 99.4 in January from 97.2 in December with improvement in four of the five subindexes with construction being unchanged month-to-month and for three months in a row; construction is also the strongest sector among the five by a long shot. The top line EMU reading was last this strong in January 2023, two years ago, on an isolated reading. It was last stronger for a string of period March 2021 through February 2022, in the heat of the post-Covid revival, averaging 111.6 on that span and reaching a monthly value as high as 119.9.
Rank standings rise and firm The overall EU Commission index has the queue percentile standing at its 46.7 percentile, very close to the 50% mark that establishes the median for the series among the five components. Retailing and construction are both above their respective 50% marks, with retailing at a 56-percentile standing and construction at an 81.9 percentile standing. The weakest reading is on consumer confidence at a 26.6 percentile standing, while services have a 43.5 percentile standing with the industrial sector at a 43.4 percentile standing. Both the services and industrial readings are climbing up closer to their respective medians but not quite there yet.
Largest economies show the clearest turns All four of the largest economies showed monthly increases in January with the largest increase a 6.1% month-to-month increase by France; the smallest was a 1.3% increase by Italy. While that's good news, it's also true that all four of those readings had declined in December compared to November. For the rest of the countries of the Monetary Union, eight of those 14 countries experienced month-to-month setbacks to their overall confidence readings in January, but only 3 of those 14 countries had experienced contractions in December and only 3 of them had experienced contractions in November; and, in November, only one of the four largest economies had experienced contraction.
Generally, positive developments are afoot Generally speaking, the trends are moving in a positive direction despite monthly volatility across the 18 early reporting countries; 9 of them show queue percentile standings above the 50th percentile, 2 of those are among the four largest economies, Italy and Spain. Quite clearly conditions within the monetary union remain mixed but the upward momentum and recent improvement is unmistakable.
Sector performance in largest EMU economies Among the four largest economies, the industrial sector has an above 50 percentile ranking in France and in Spain. Germany, and Italy are lagging behind. Construction has above 50-percentile standing in each of the four largest economies except France where its percentile standing is in its 42nd percentile. Spain does not report consumer confidence, retailing, and services numbers separately. Among the remaining big three countries, only Italy has readings above its 50-percentile mark and those are only in retailing and services. Consumer confidence continues to lag everywhere with the highest assessment among the BIG-4 economies in Germany with the 45.8 percentile standing and the lowest in France at a 20.4 percentile standing.
Tracking improvement The chart at the top shows that in broad terms we can see the improvement is relatively long lived for the BIG-3 economies and in EMU. We can be hopeful that there really is a trend of improvement that is taking hold. From mid-2025 or so onward, there are steady improvements in gear. Two of the BIG-3 economies are improving along with the EMU aggregate; only Germany tends to flatline on that timeline. The recent improvement in Germany is a relatively new feature in what otherwise looks like German stability. These trends now have some length, making the momentum seem more durable.
 USA| Jan 28 2026
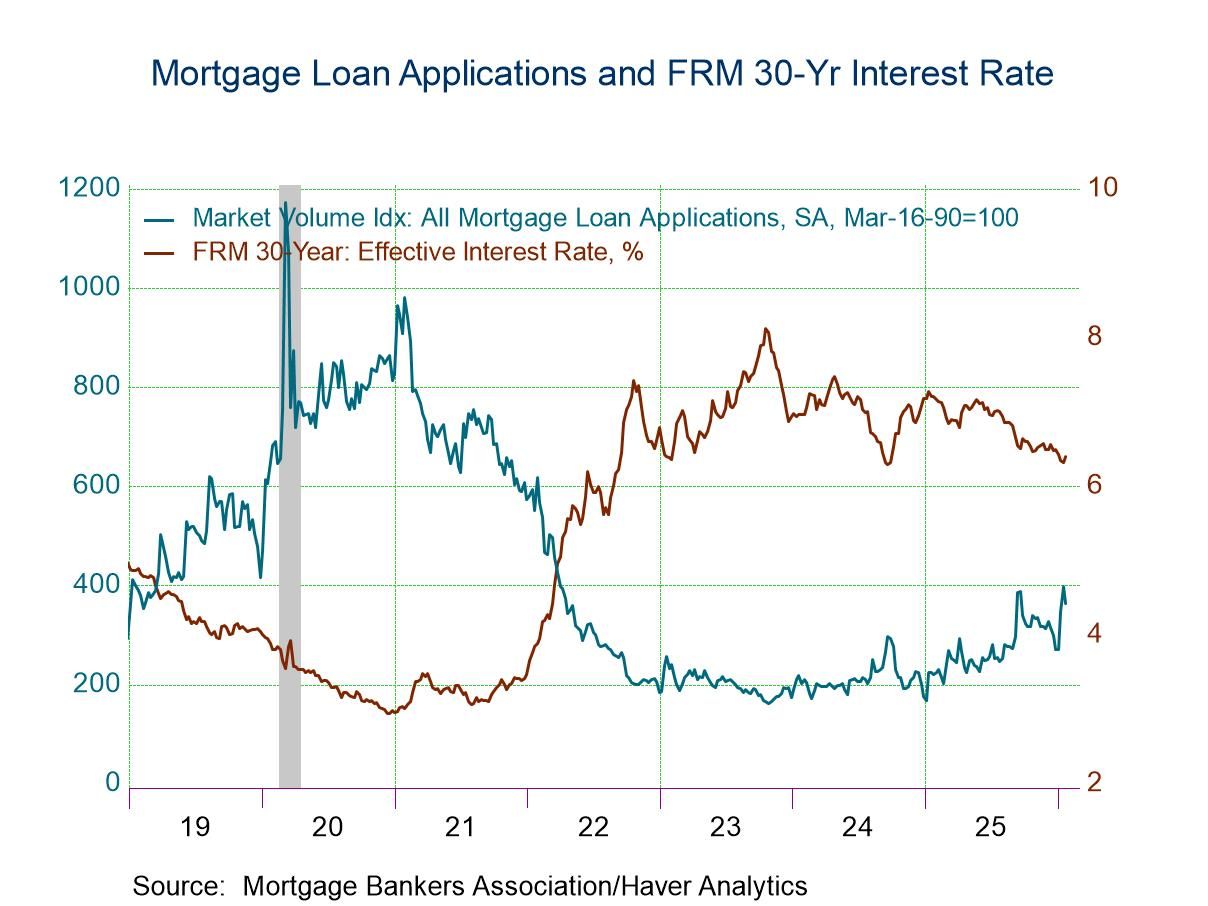
U.S. Mortgage Applications Dropped in the Week of January 23
- Purchase and refinancing loan applications declined in the latest week.
- Effective interest rate on 30-year fixed loans rose 8bps to 6.40%.
- Average loan size declined.
 USA| Jan 27 2026
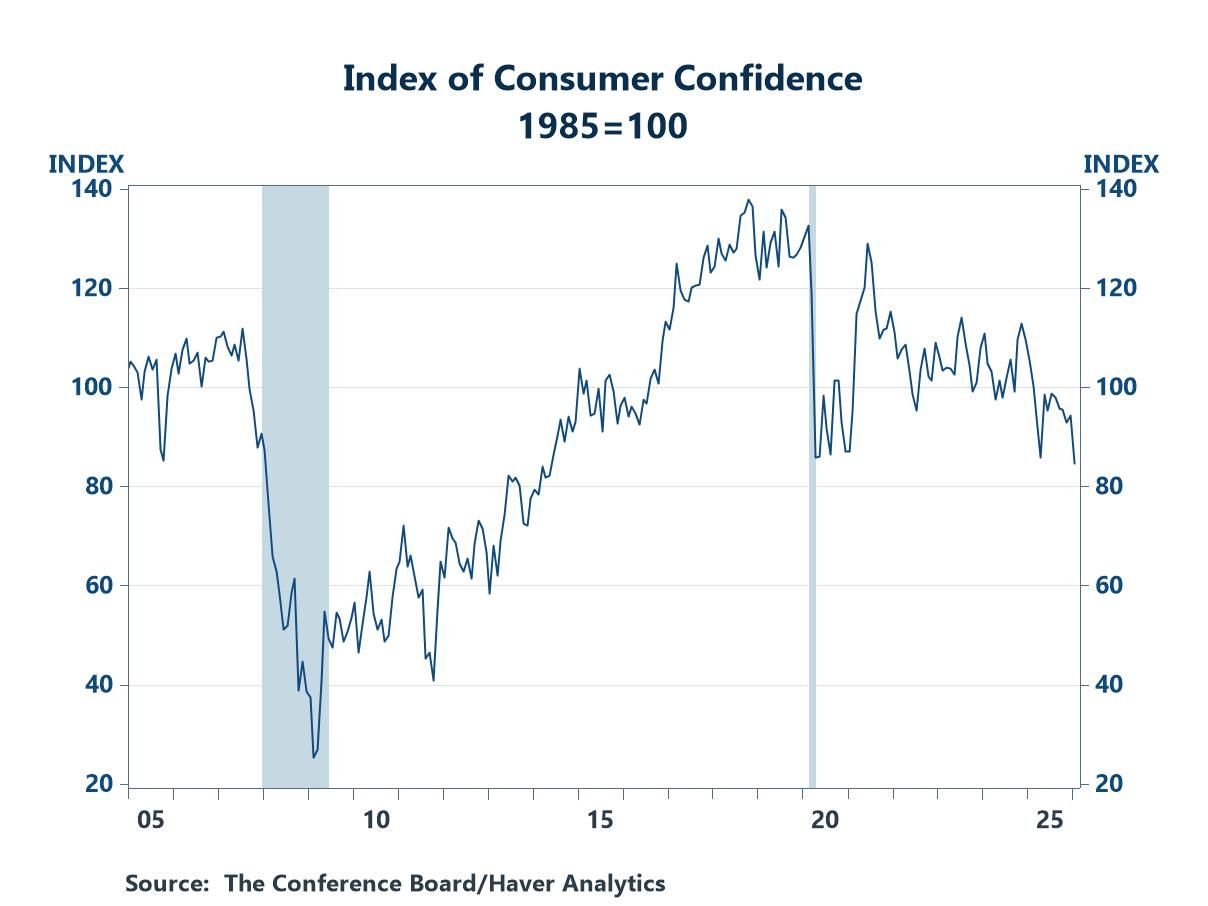
Consumer Confidence Tumbled in January
- Both expectations and assessments of the present situation contributed to the decline
- The index moved to a new low for the current cycle.
- A softening labor market played a role.
 USA| Jan 27 2026
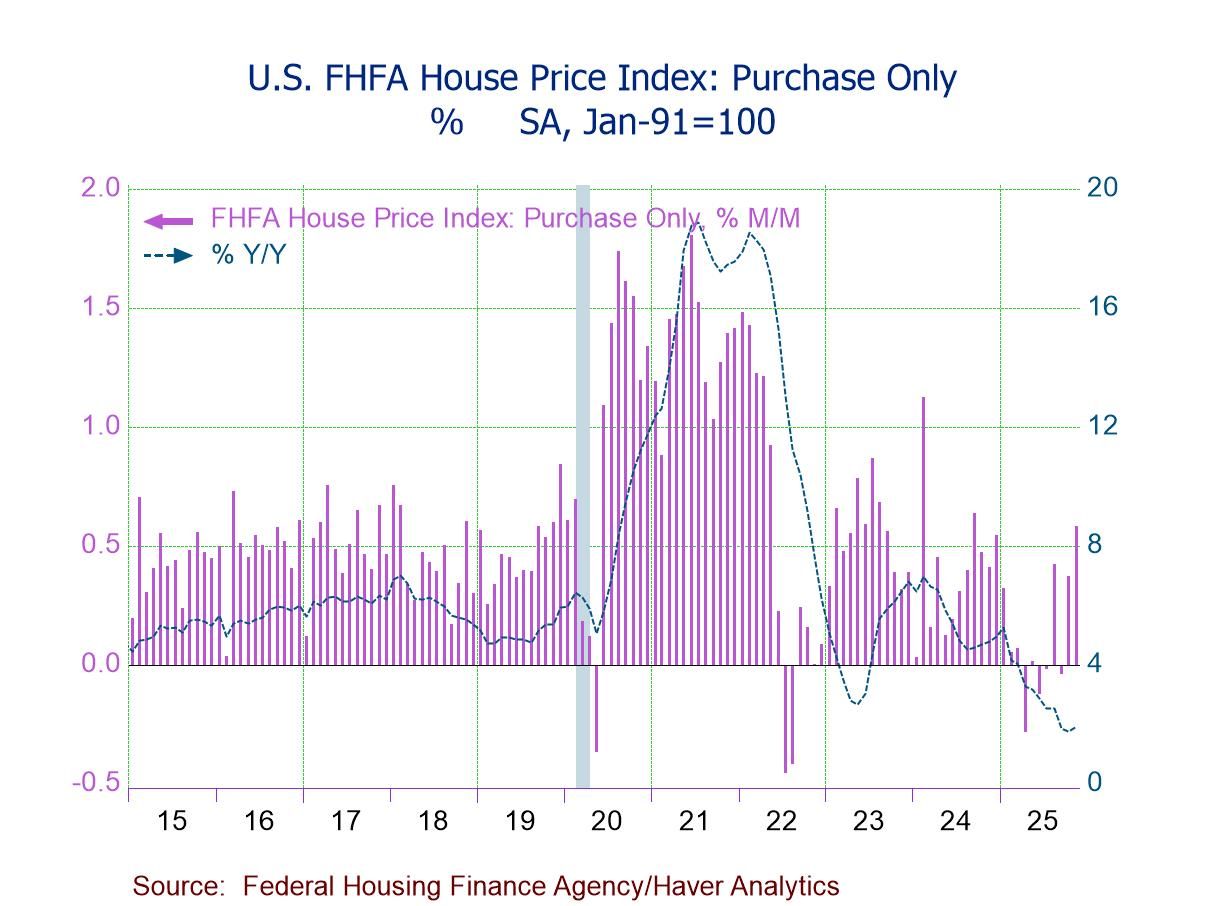
U.S. FHFA House Prices Advance in November
- FHFA HPI +0.6% (+1.9% y/y) in Nov., third m/m gain in four months.
- House prices up m/m in eight of nine census divisions, led by East South Central (+1.1%); prices flat m/m in Middle Atlantic.
- House prices up y/y in six of nine regions, led by East North Central (+5.1%), but down in Pacific (-0.4%) and Mountain (-0.1%); prices flat y/y in South Atlantic.
 Europe| Jan 27 2026
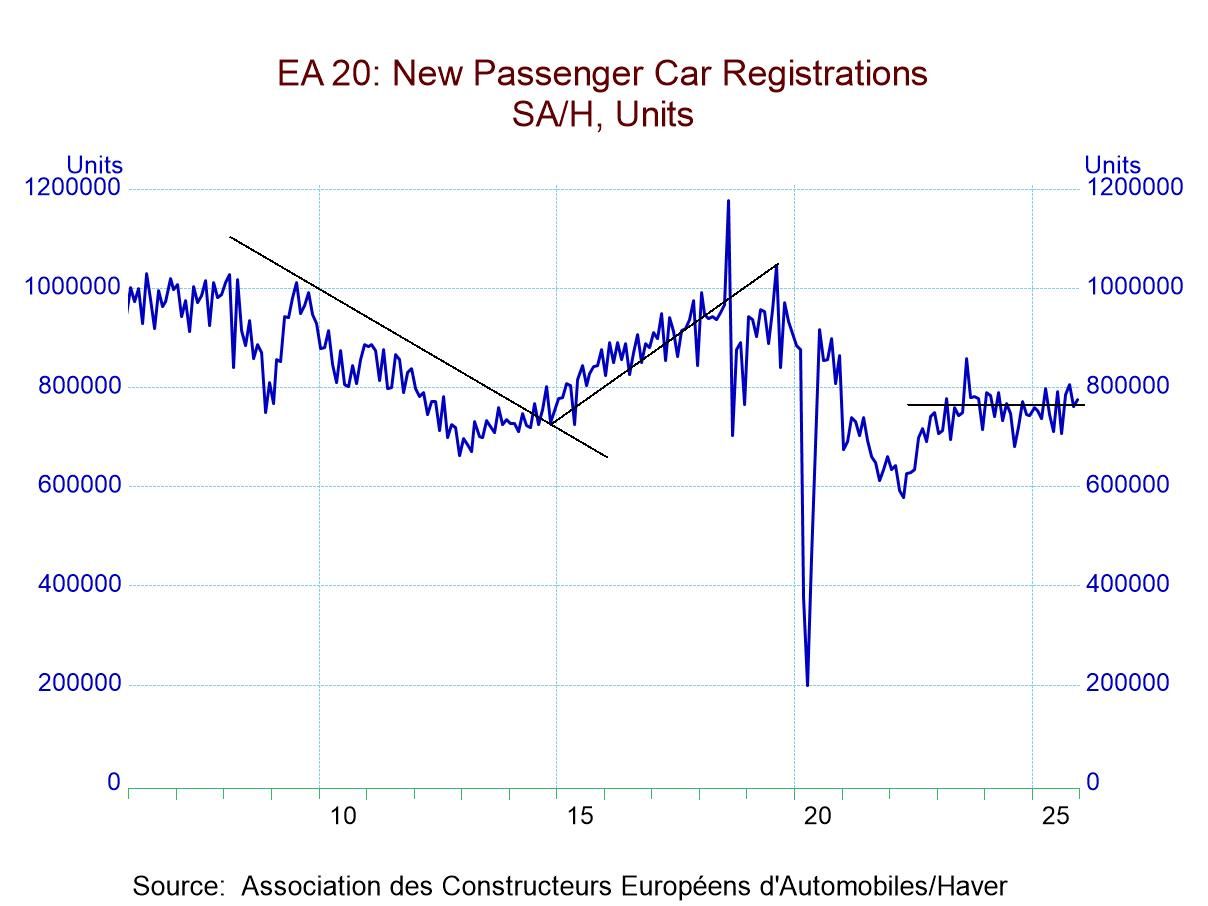
European Vehicle Registrations Show Some Life
European vehicle registrations rose 2% in December compared to November; year-over-year registrations are up by 4.5%. The three-month average in December is lower by 0.4% compared to where it was in November and the three-month average has a 12-month growth rate of 3.8% compared to the unadjusted rise of 4.5%.
The growth rate progression shows a 12-month growth rate of 4.5%, jumping up to a 19.5% annual rate over six months and falling back to a contraction of 4.8% at an annual rate over three months. However, the annualized growth rates calculated from three-month moving averages show a 12-month gain of 3.8%, a six-month gain of 8.1%, and the three-month gain of 10.8%. The 3-month smoothed data show that there is an ongoing acceleration in car registrations that is masked by volatility in the month-to-month numbers: the 10.8% growth rate over three months is quite a good sign if it can hold up and, of course, it's on the heels of 8.1% growth over six months.
Looking at the individual reporting countries Germany, France, Italy, Spain, and the United Kingdom, we see gains in registrations in December compared to November in three countries. In the U.K. registrations rise by 6.1% month-to-month, in Italy they rise by 4.2% month-to-month and in Germany they gain 1.8%; however, registrations fall on a month-to-month basis by 2.1% in Spain and by 1.5% in France.
The country level sequential growth rates show a mixed picture in Germany where registrations are up 10.6% over 12 months and accelerate to 19.5% over six months but are declining at a 16.8% annual rate over three months. In France registrations rise by 3.6% at an annual rate over three months; however, they are stronger over six months and they then are contracting over 12 months. In Italy registrations are up by 2.5% over 12 months, the growth rate jumps to 25.4% at an annual rate over six months, but then, over three-months, registrations fall at a 1.8% annual rate. Spain also shows erratic performance with the decline of 2.9% over 12 months, a gain over six months and then a decline at a 12.4% annual rate over three months. And the U.K. registrations trends are deteriorating with a 3.7% gain over 12 months, a 4.8% annual rate drop over six months, and then over three months the annual rate plunges to -30.8%.
The reporters in the table show registrations weaker than they were in January 2020 just before the COVID virus struck; overall registrations are lower by 12.2%. Registrations are down by 13.3% in Italy, down about 10% in Germany and France, down by 5.7% in Spain, while the U.K. registrations are lower at just 1.5%
- of2725Go to 35 page