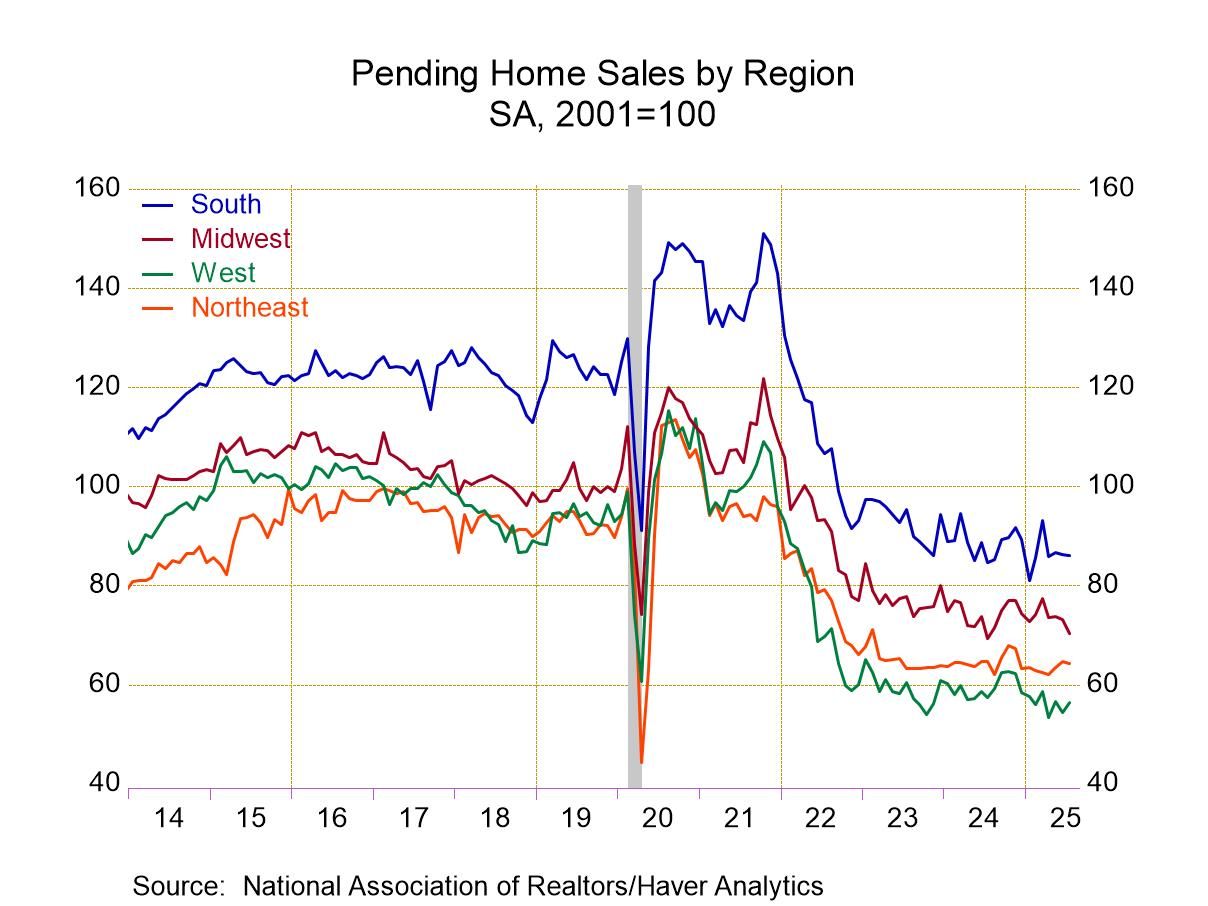
- Decline adds to June weakness.
- Regional changes are mixed.
 USA| Aug 28 2025
U.S. Pending Home Sales Decline in July
by:Tom Moeller
|in:Economy in Brief
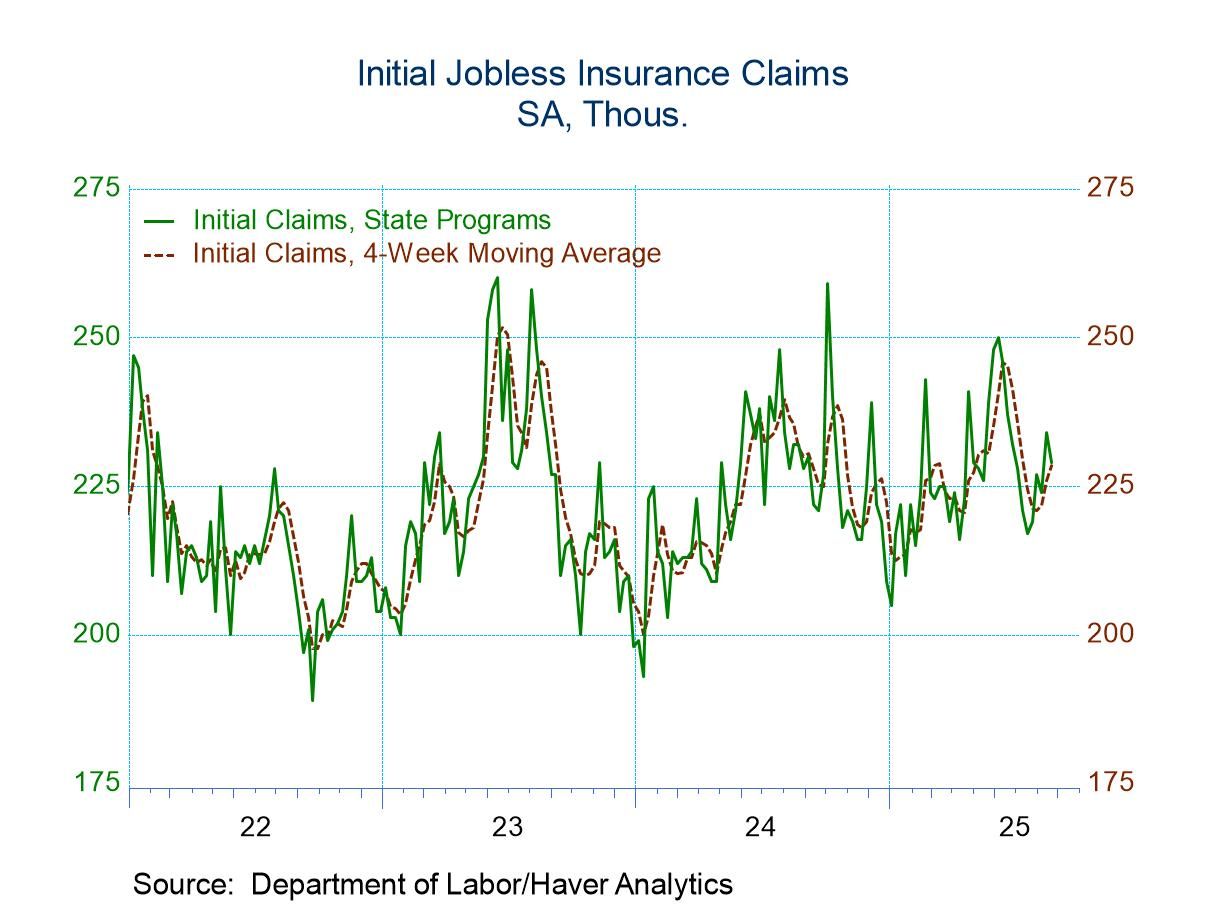
- Initial claims declined in latest week after a surge in the prior week.
- Continuing claims declined.
- Insured unemployment rate holds steady.
 Global| Aug 28 2025
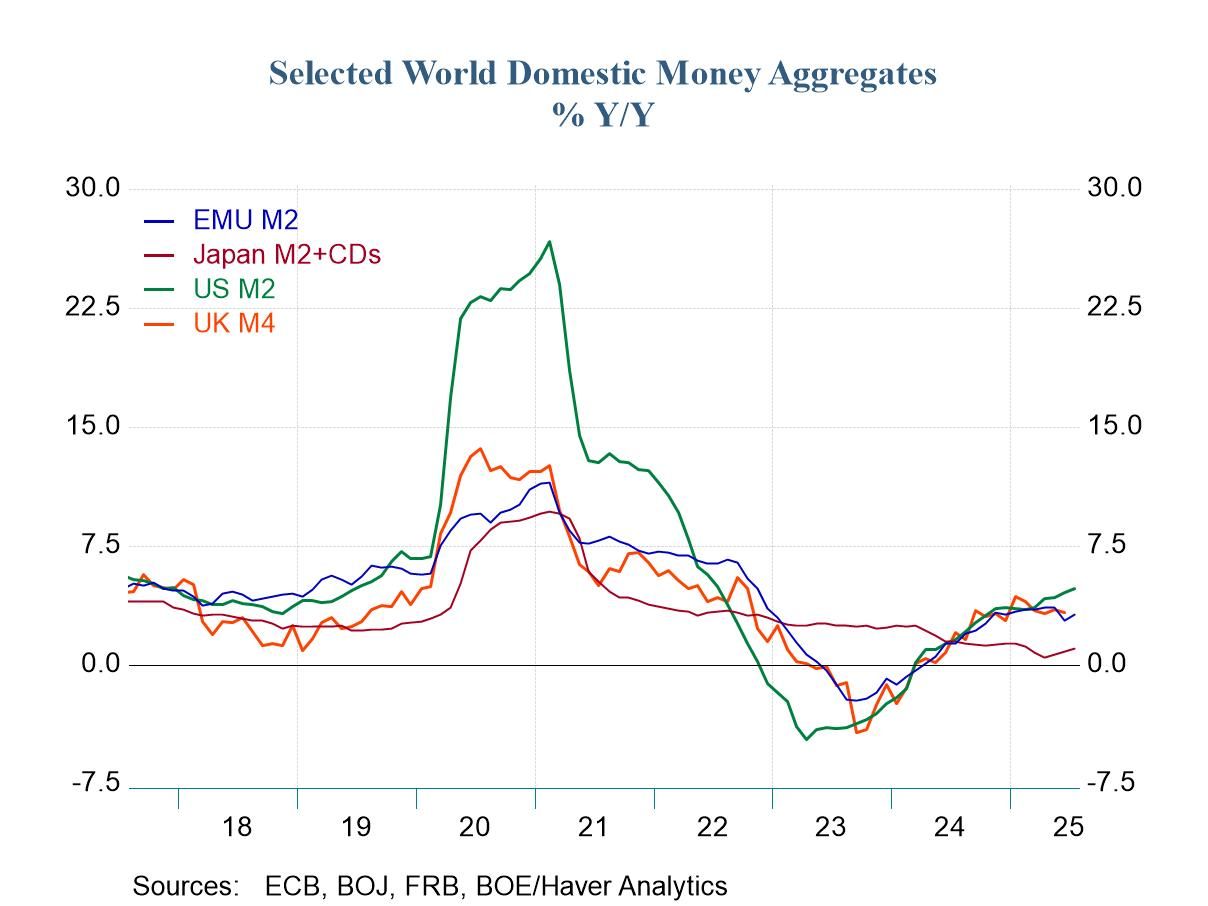
Key Money Aggregates Stabilize Except in U.S. Where Growth Accelerates
Japan is a clear exception going, it alone on its money growth path. The United States, the United Kingdom, and the European Monetary Union have largely seen their money growth aggregates coordinated for annual growth in recent years. Money growth generally bottomed in 2023 with growth actually negative during part of that year. However, into 2024 money growth began to accelerate and it achieved positive growth. By the end of 2024, money growth rates had been restored to a moderate pace and money growth in the U.S., the U.K. and the European Monetary Union had mostly stabilized. However, in the last few months money growth in the U.S. has been accelerating. Money growth in the U.K. and the European Monetary Union has stabilized or weakened slightly. Money growth in Japan during all of this, has tended to decelerate marginally and now, in 2025, there is the slightest pickup in money growth in Japan to a still very weak pace.
Nominal money In the European Monetary Union, M2 growth has been at 1.1% over 3 years, 2.2% over 2 years and 3.2% over 1 year. Over shorter periods, six-months growth decelerated to 1.9% and over three months it decelerated further to about 1%, all at annual rates. Credit growth in the EMU has decelerated as well with private credit a little over 2% over six months and over 12 months, and the falling back to a 1.4% annual rate over three months.
The U.S. money growth progressed from 0.7% over 3 years, then 3.2% over 2 years, to 4.8% over 12 months. It moved up to 5.7% at an annual rate over six months and then moved up further to 5.8% at an annual rate over three months as nominal money growth continues to accelerate.
In the United Kingdom, money growth accelerated from 3-years to 2-years to 12-months from 1.3% to 2% to 3.3%. However, moving on to 6 months, U.K. money growth accelerated to 4.6% and then decelerated, downshifting to a 1.6% pace over 3 months complicating its true path.
In Japan, M2 plus CDs showed weak growth of 1.7% over 3 years, 1.2% over 2 years, and 1% over 12 months; over 6 months the annual growth rate sank to 0.3%, but over 3 months it has picked up to a 2.5% annual rate.
Real money balances Turning to real money balances, we find negative growth rates for money supply over 2 years and 3 years for the European Monetary Union, the U.K., and Japan. In addition, private credit growth in real terms in the EMU is negative over 2 years and 3 years. In the U.S., real money growth is -2.2% over 3 years, moving up to 0.3% over 2-years and then to 2% over 12 months.
The U.S. continues to be an exception with 6-month real money balances at a 3.7% annual rate and at a 3.5% annual rate over 3 months. In the EMU, real money balances are only growing 0.2% over 6 months and then fall back to drop at a 1.9% at an annual rate over 3 months. In the U.K., real money balances grow by 0.3% over 6 months and then fall 2.6% at an annual rate over 3 months. In Japan, real money balances decline 1.3% over 6 months and grow 0.4% over 3 months as money growth in Japan begins to stabilize slightly in real terms over 3 months.
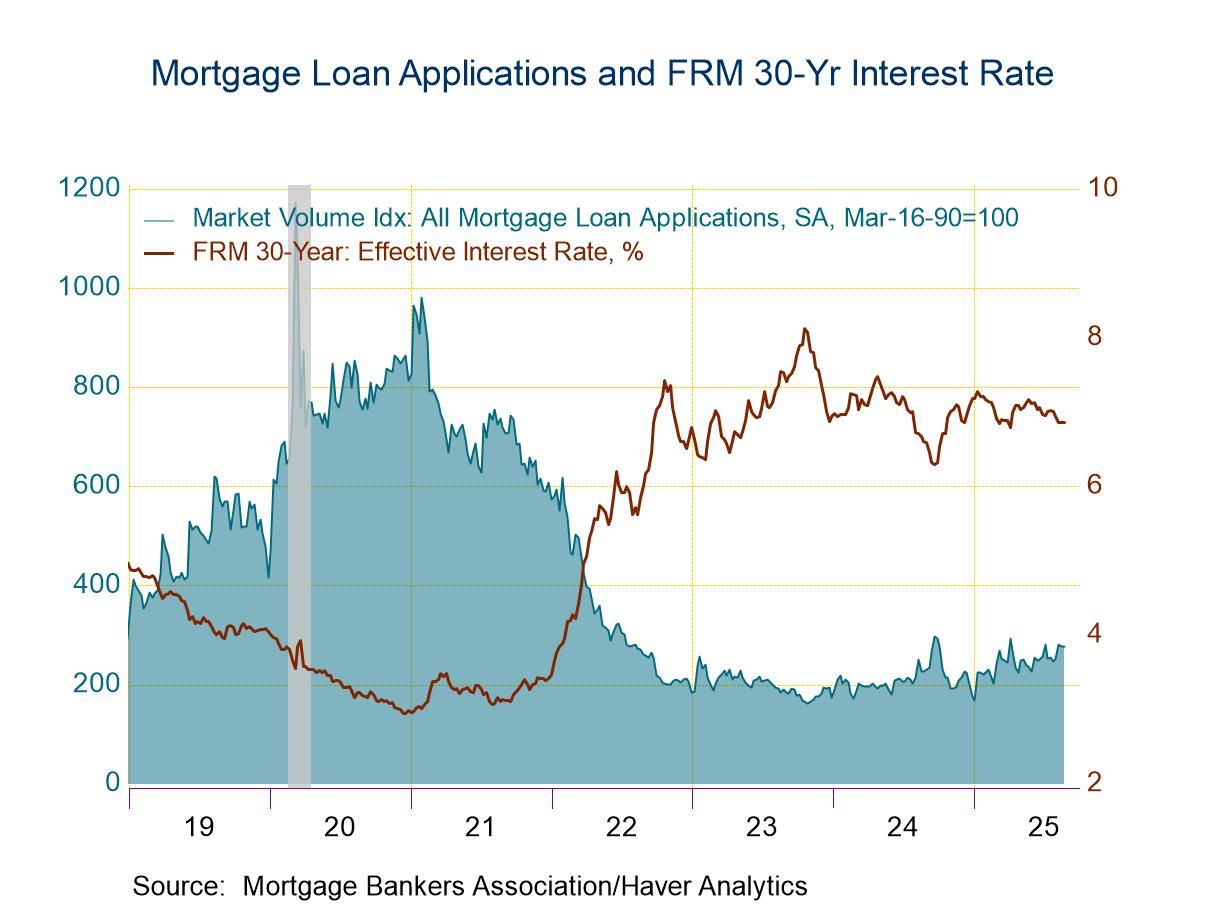
- Purchase applications increase while loan refinancing eases.
- Fixed-interest rate on 30-year loan holds at four-month low.
- Average loan size declines again.
by:Tom Moeller
|in:Economy in Brief
 Germany| Aug 27 2025
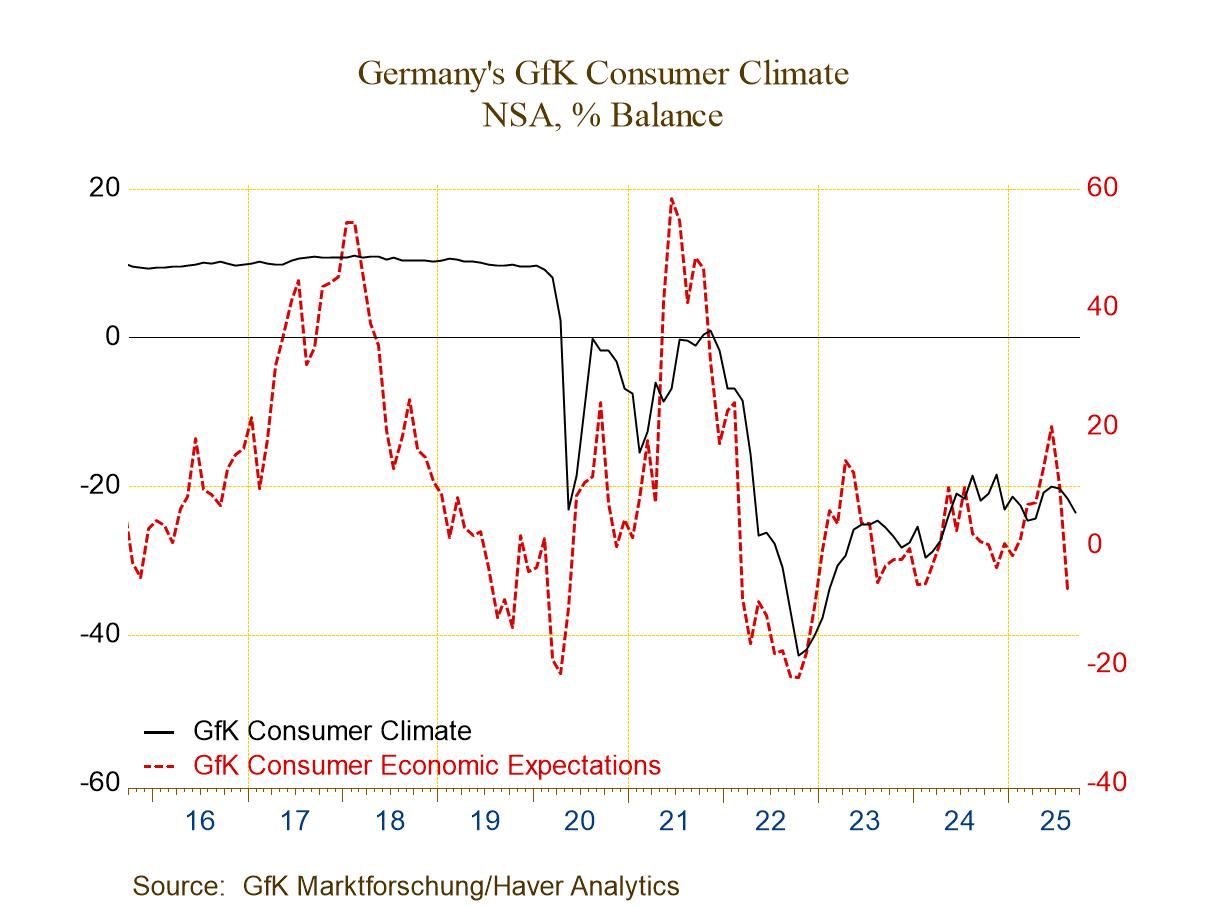
German Climate Stabilizes But Eco-expectations Plunge
The GfK consumer climate indicator for Germany slipped in September to -23.6 from -21.7 in August. The slippage brings the index to its weakest level since April 2025 and in fact it's the weakest reading since May 2024 with only two-monthly exceptions.
The components for the GfK index are up to date through August. The economic index in August fell to -7.4, its weakest reading since December 2022. The decline in August was both sharp and deep. Income expectations backed-off; after a reading of 15.2 in July, the index fell to 4.1 in August and was last weaker in March 2025. The propensity to buy index weakened again for the second month in a row to -10.1 in August from -9.2 in July; it's the weakest reading since February 2025.
Percentile standings The percentile standing for the climate index and its components show climate is still very weak at a 9.7 percentile standing among data back to mid-2002. Economic expectations have a 23.7 percentile standing, the propensity to buy has a 28.8 percentile standing, while income expectations have a 38.8 percentile standing. These count percentiles or queue percentiles however you like to think of them, are all quite weak. The median in terms of this sort of gauge occurs at the 50th percentile reading, so all of these readings are well below their historic medians and data back to mid-2002.
Consumer confidence – selected other Europe Other European confidence measures are up to date through August in France where the INSEE confidence measure slipped to 87 from 88.3 while in the United Kingdom the confidence measure improved to -17 in August from -19 in July. Italy's confidence reading is up to date only through July, and on that timeline, it showed a one-month improvement to 97.2, up from June’s 96.1. Italian confidence has the strongest standing at a 76.8 percentile standing, the U.K. has a 40.3 percentile standing, while France has a 19.8 percentile standing. There's a good deal of variation in how consumers perceive current circumstances. Based on these standings, Germany has the lowest assessment in the its lower 10 percentile, while Italy sees a top 25 percentile standing, the U.K. sees an assessment that's about 10 percentile points below its median, while France is at its 20th percentile closer to the German metric in standing. It's a substantial variation especially since three of these countries are in the European Monetary Union.
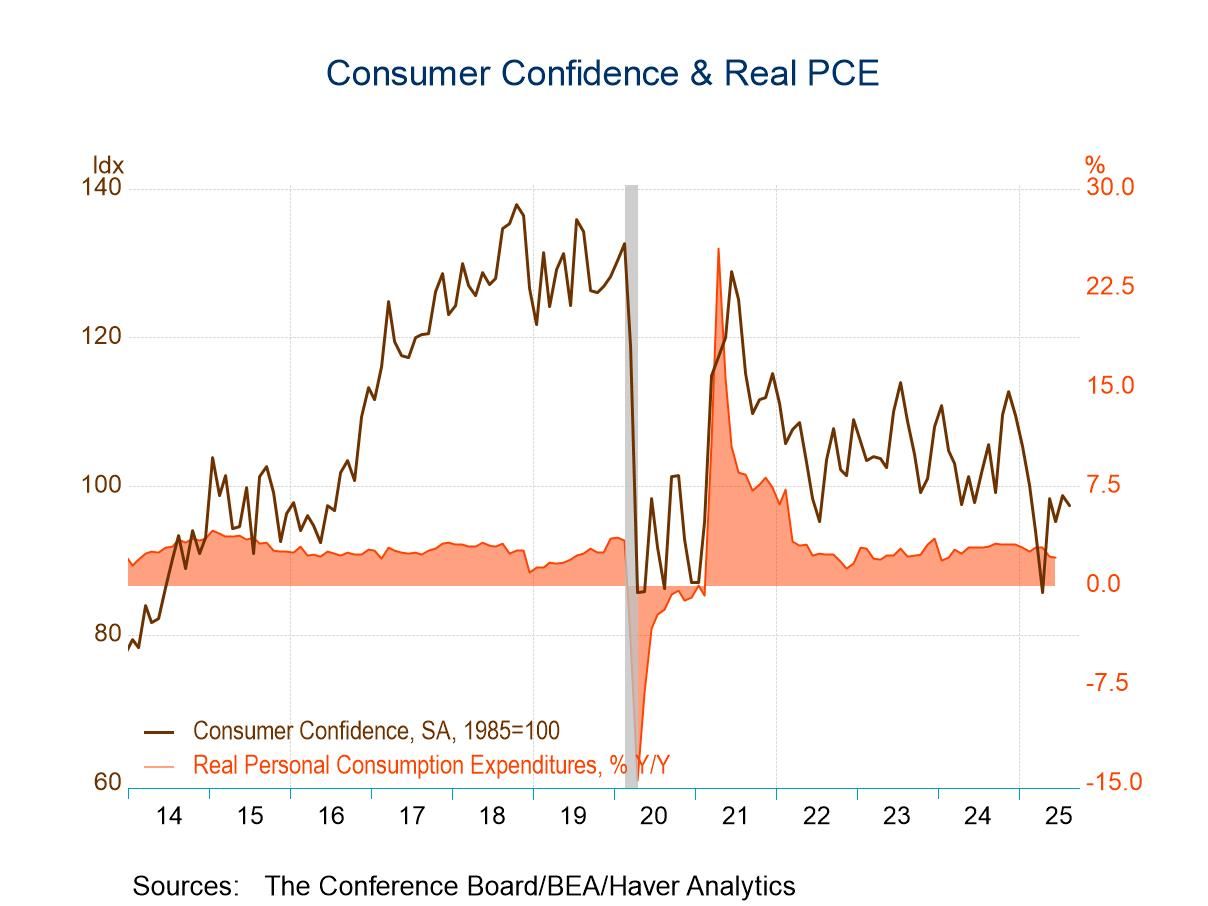
- Monthly decline is slight, level remains up sharply from April low.
- Expectations and present situation readings decline.
- Inflation expectations rise after falling for two months.
by:Tom Moeller
|in:Economy in Brief
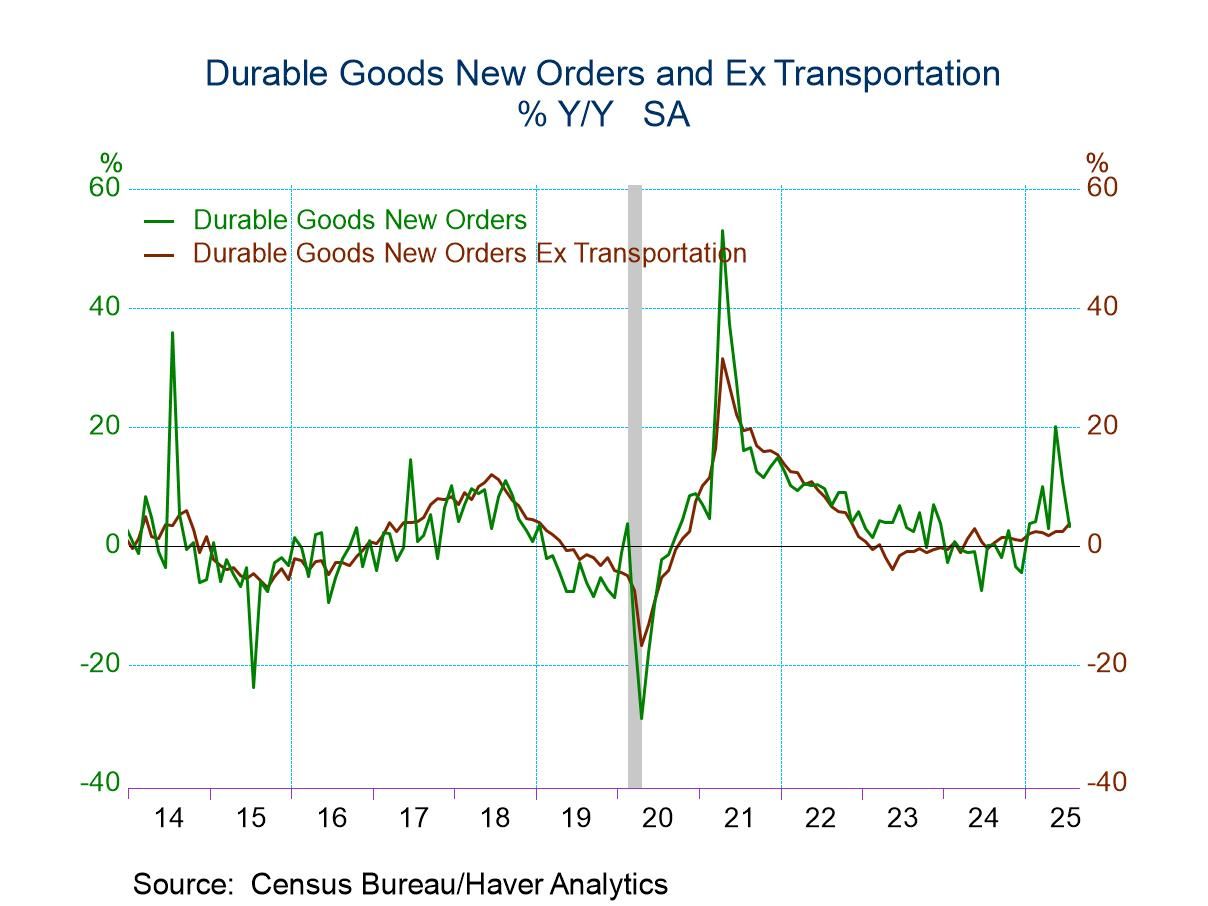
- Durable goods orders fell 2.8% m/m in July on top of a 9.4% monthly drop in June.
- Once again, weak nondefense aircraft orders were the key factor; nondefense aircraft orders plunged 33% m/m in July on top of a 53% m/m decline in June.
- In contrast, orders excluding transportation rose a solid 1.1% m/m in July, their largest monthly gain since September 2024.
- Core capital goods orders rebounded, and shipments posted a solid gain.
by:Sandy Batten
|in:Economy in Brief
 USA| Aug 26 2025
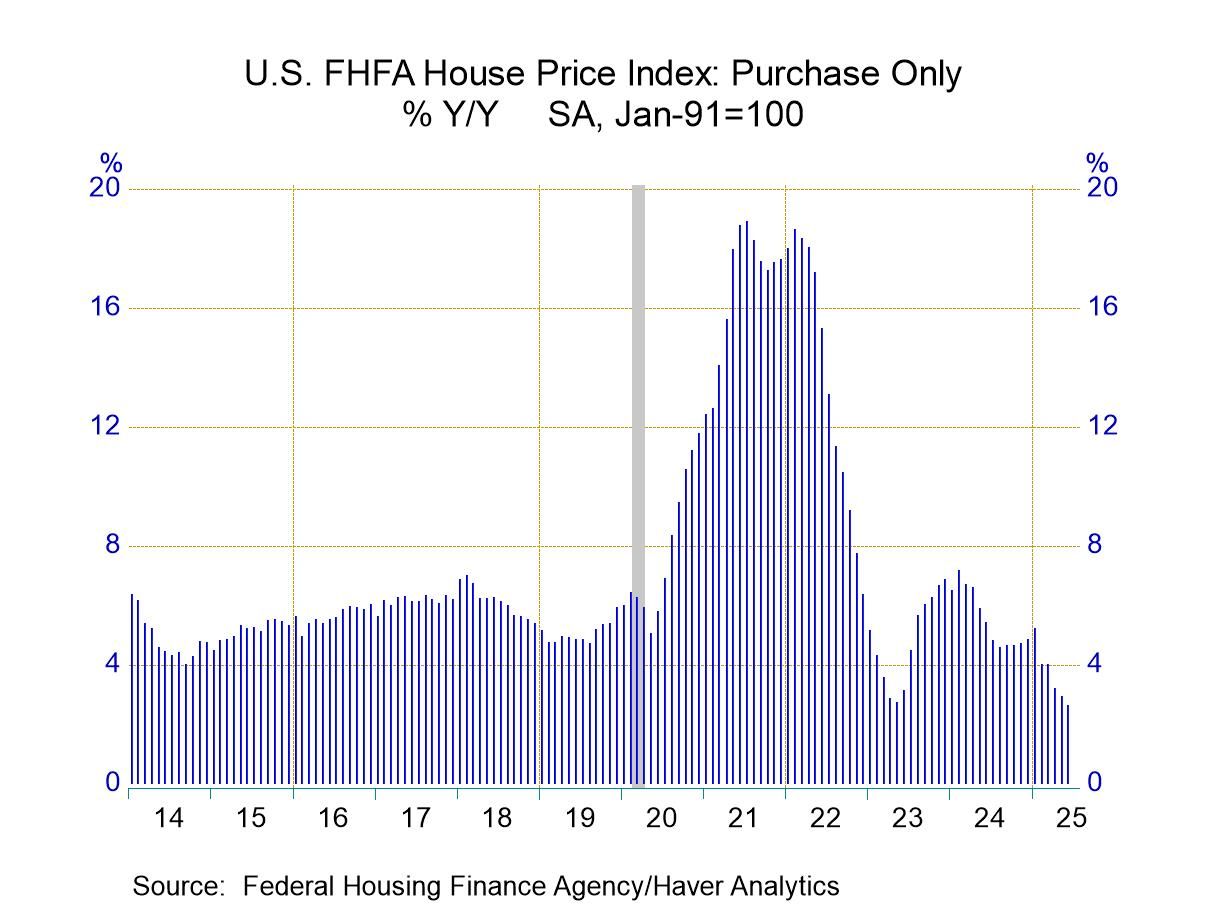
U.S. FHFA House Prices Continue to Decline in June
- Prices edge lower for third straight month.
- Annual increase is near two-year low.
- Price changes are uneven amongst regions.
by:Tom Moeller
|in:Economy in Brief
- of2693Go to 40 page