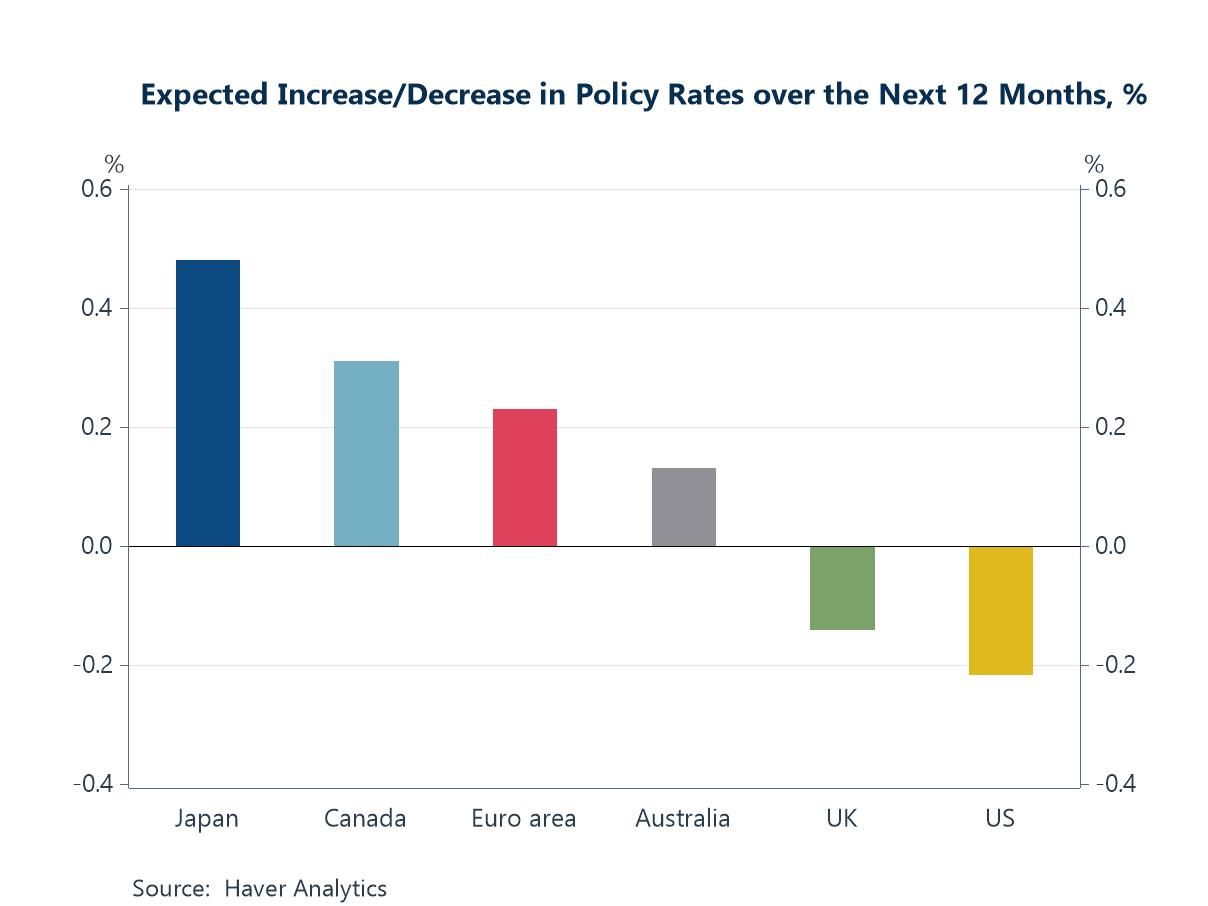
The global macro backdrop continues to evolve in ways that would have surprised many investors at the start of the year. Expectations of widespread monetary easing have steadily receded as inflation has proven more persistent and economic activity more resilient than anticipated. The latest Blue Chip Financial Forecasts point to a growing bias towards policy tightening rather than loosening in several major economies (chart 1), while rising US job opening rates suggest labour demand remains firmer than expected (chart 2). At the same time, ongoing instability in the Middle East continues to generate supply-side inflation risks and lengthier delivery times (chart 3). There are, however, also reasons for optimism. Manufacturing activity appears to be finding some support from a reduction in effective tariff rates facing many major US trading partners (chart 4). More importantly, the AI investment boom continues to gather momentum. South Korea's semiconductor exports surged by an extraordinary 169% year-on-year in May, highlighting the strength of global demand for AI-related hardware (chart 5). Unsurprisingly, investors continue to direct capital towards those markets most exposed to these trends, with Taiwan and South Korea attracting substantial equity inflows (chart 6). The bottom line is that inflation concerns and higher-for-longer interest rates remain important risks, but they are increasingly being offset, for now, by a combination of improving economic conditions and one of the strongest technology-driven investment cycles in modern history.
 Global| Jun 04 2026
Charts of the Week: Inflation Fears, AI Cheers
by:Andrew Cates
|in:Economy in Brief
 USA| Jun 04 2026
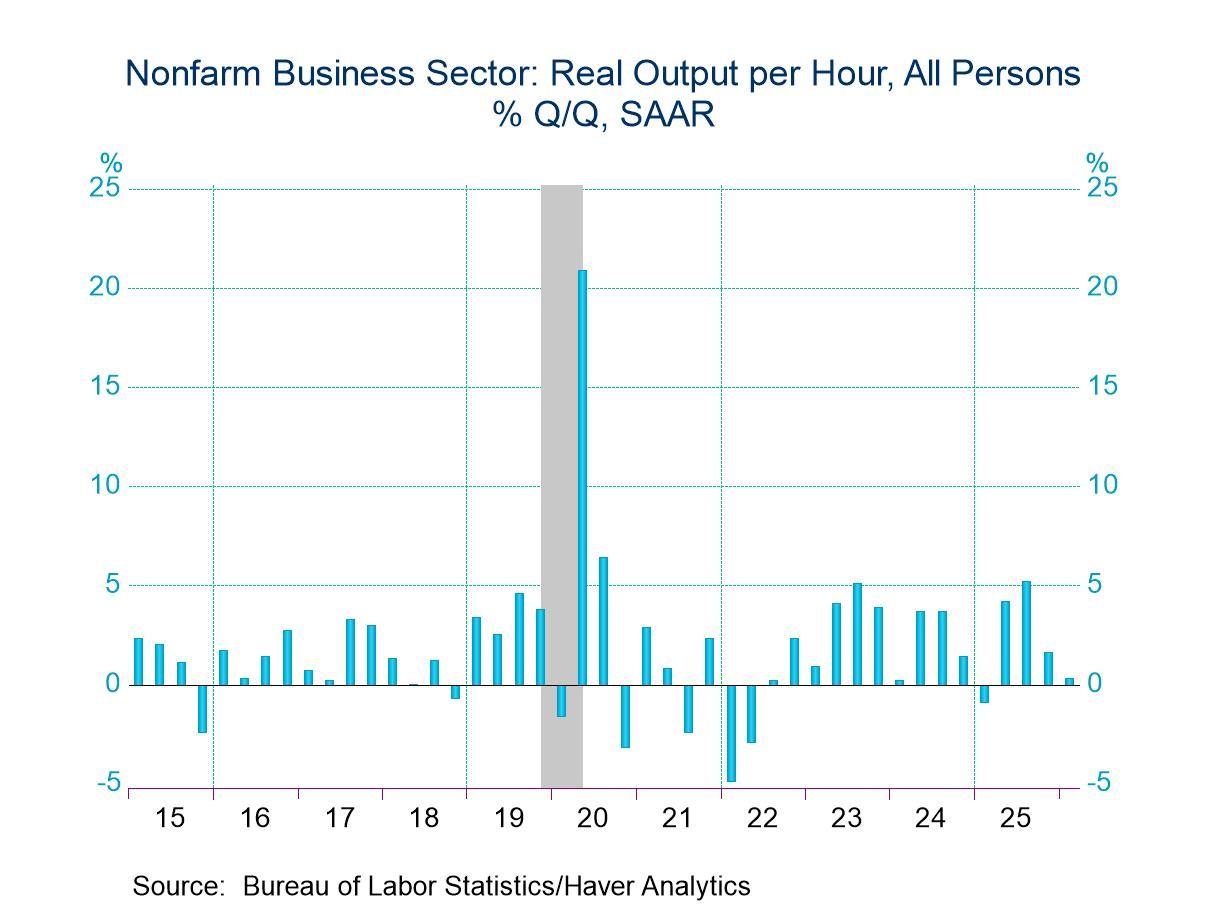
U.S. Q1 Productivity and Unit Labor Cost Growth Revised Down
- Q1 output per hour growth was revised down to 0.3% q/q saar in the second estimate from 0.8% in the first, reflecting a downward revision to output.
- However, longer-term productivity growth remained solidly well above trend.
- Compensation growth was revised down meaningfully, resulting in a downward revision to unit labor cost growth to 1.8% from 2.3% previously.
by:Sandy Batten
|in:Economy in Brief
 USA| Jun 04 2026
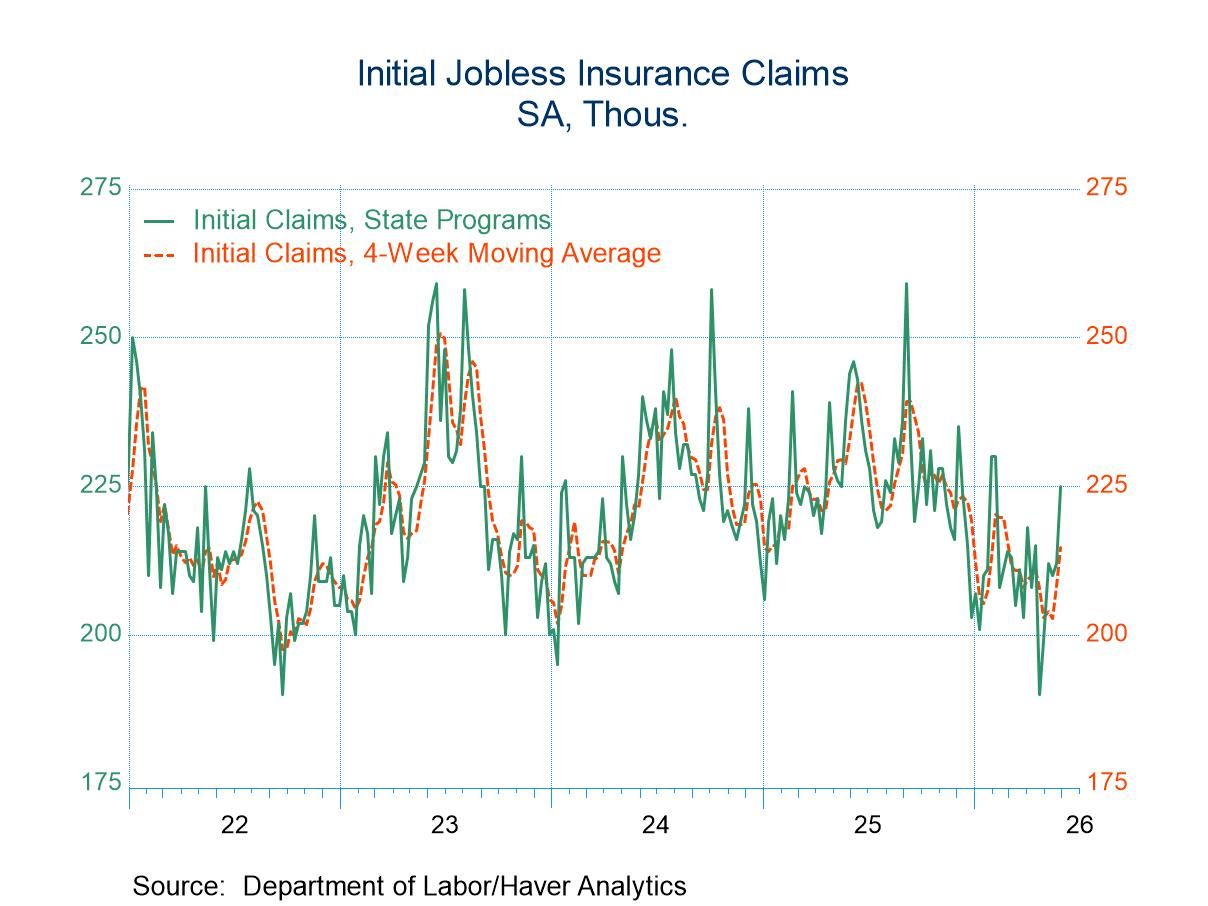
U.S. Initial Unemployment Claims Jumped in Latest Week
- Initial claims rose more than expected to 225k in the week ending May 30.
- This is the largest weekly claims figure since February 7.
- However, continuing claims continued to trend down, falling to 1.777 million in the week ending May 23 from 1.785 million in the previous week.
by:Sandy Batten
|in:Economy in Brief
 Europe| Jun 04 2026
Retail Sales in Europe Continue to Struggle
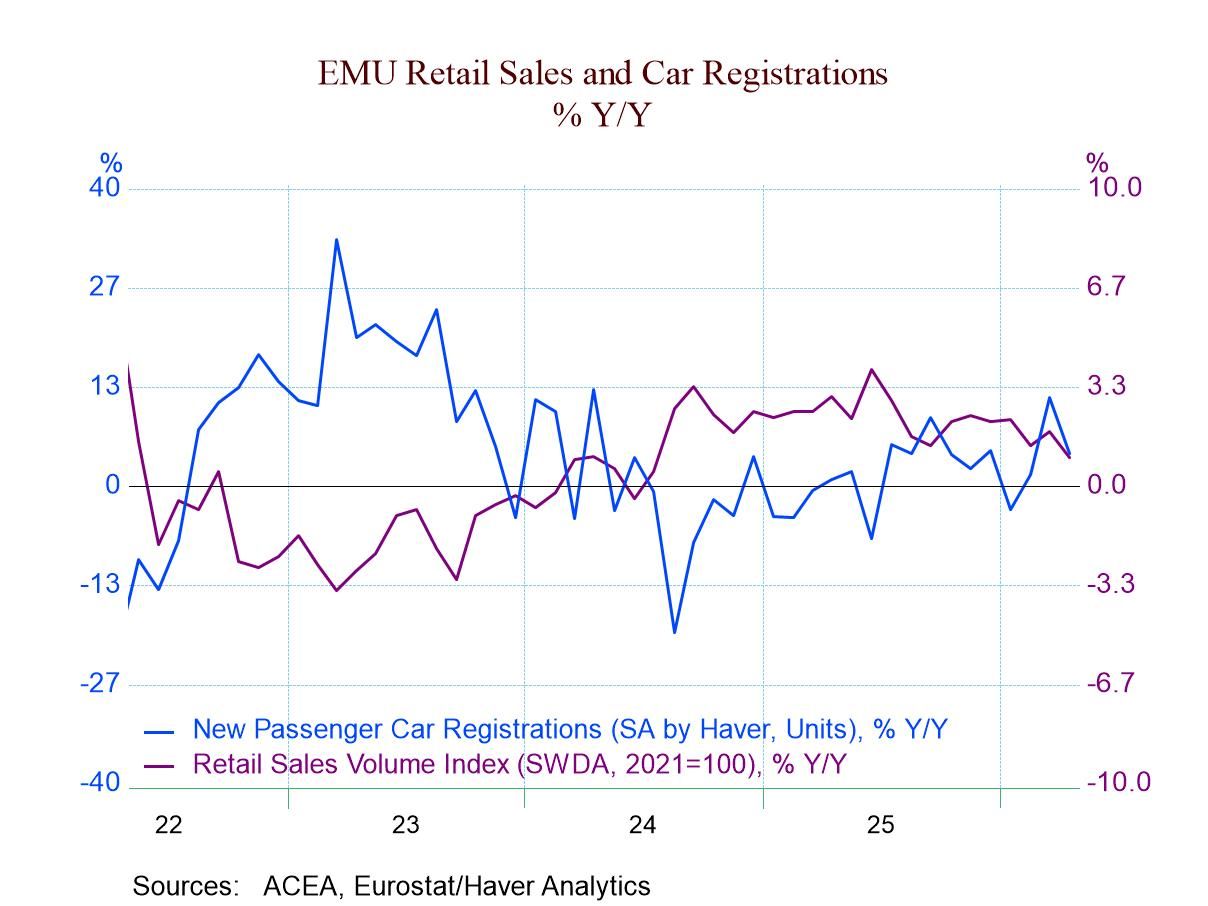
Retail sales in the euro area declined in volume terms in April, falling 0.4% on the month after rising 0.8% in March and falling 0.5% in February. Food and beverage volume recovered to post an expansion after two monthly declines.
Sales trends slip: However, the headline for retail volume growth shows that there has been steady slippage, with growth over 12 months weaker than it was over the previous 12 months, growth over six months at a weaker pace than it was over 12 months, and growth over three months posting an outright decline compared to a gain over six months. The highlighted red background in the table shows this string of continuous slowing that marks decelerating retail spending in the euro area as of April. In the quarter to date, retail sales volumes are declining at a 0.2% annual rate—a very slight contraction but a net reduction in sales volume, nonetheless, to start the second quarter.
Contrarian strength in vehicle demand: Motor vehicle registrations pulled back in April after some strong gains in earlier months. Motor vehicle registrations are accelerating as the growth rate rises from 12 months to six months to three months; growth actually explodes over three months, rising at a 52.4% annualized rate. With this strength, naturally, motor vehicle registrations are logging strong growth at the beginning of this new quarter, rising at a 33.6% annual rate.
Despite the strength in motor vehicle registrations, registrations are still a lot lower in comparison to January 2020. They have averaged a decline of 1.2% per year over this period. Since January 2020, just before COVID struck, retail sales in the euro area have risen by 6.7%, implying an average annual growth rate of 1% per year. This has generally been a lethargic period for retail sales.
Sales trends by country Looking at the individual countries in the table, we chronicle developments for EMU members Germany and the Netherlands, EU member Denmark, and Northern European countries Norway and Sweden, plus former EU member the United Kingdom. We see that all of these countries have had a long period of weak growth going back to January 2020. Among these countries, only Denmark and the Netherlands have averaged retail volume growth of over 1% for this date-span; Denmark averages 1.5% per year, and the Netherlands averages 1.3%. Sweden and Norway’s trends average 0.8% and 0.7% growth per year back to January 2020. Germany posted a compounded annual increase of only 0.6% annually, while in the U.K., in the wake of the problems that COVID and Brexit created, saw its retail sales volumes decline annually by 0.4%, marking a 2.2 percentage point decline in retail sales since January 2020. It has been a weak environment for retailing.
Recent sales performance: Up-to-date observations for April show declines in retail sales volume in Germany, Denmark, and the U.K., with flat sales in Sweden. Norway logs an increase of 0.3% month-to-month, and the Netherlands logs an increase of 1.6% month-to-month. The sequential data, looking at sales over 12 months to six months to three months, largely points to a continuation of this period of lethargic sales. Germany, the U.K., and Norway each are posting a sequential deceleration, as the rate of sales slows over progressively shorter time periods. Denmark and the Netherlands have somewhat erratic performance on retail sales, with no clear trends. Sweden stands alone as the only country with retail sales clearly accelerating, rising 4.2% at an annual rate over 12 months, at a 4.4% annual rate over six months, and at a 5.8% annual rate over three months.
Challenging outlook The retail environment remains challenging in Europe. Oil prices are rising; the European Central Bank is expected to take steps to deal with excessive inflation and rising oil prices with at least one rate hike. The war in Ukraine remains hot; the war in the Middle East may be cooling down, but the Strait of Hormuz is still not open for business. The global economy continues to face significant challenges.
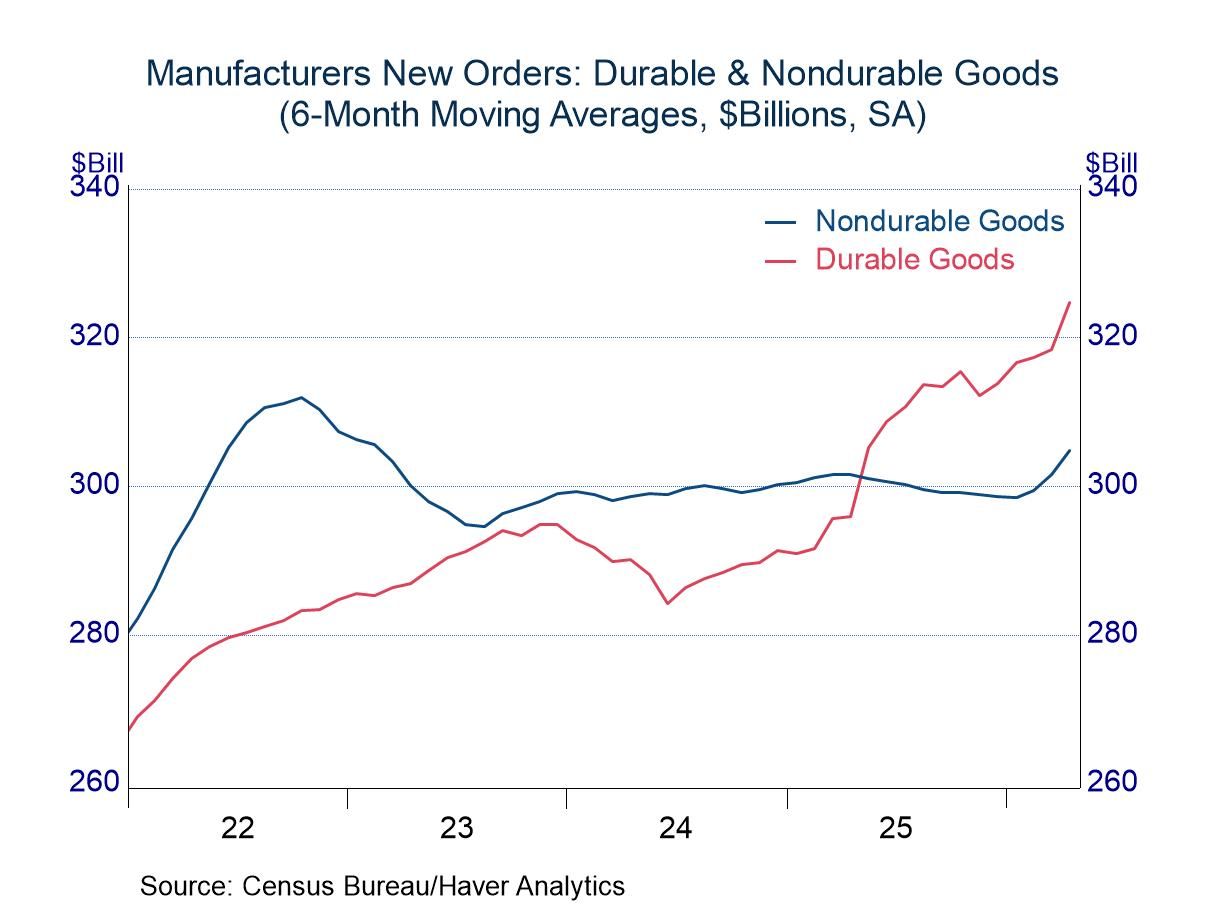
- Aircraft bookings fueled durable bookings in April, accenting solid gains in prior months.
- Petroleum prices inflated nondurable orders in April, but orders ex-petrol advanced as well.
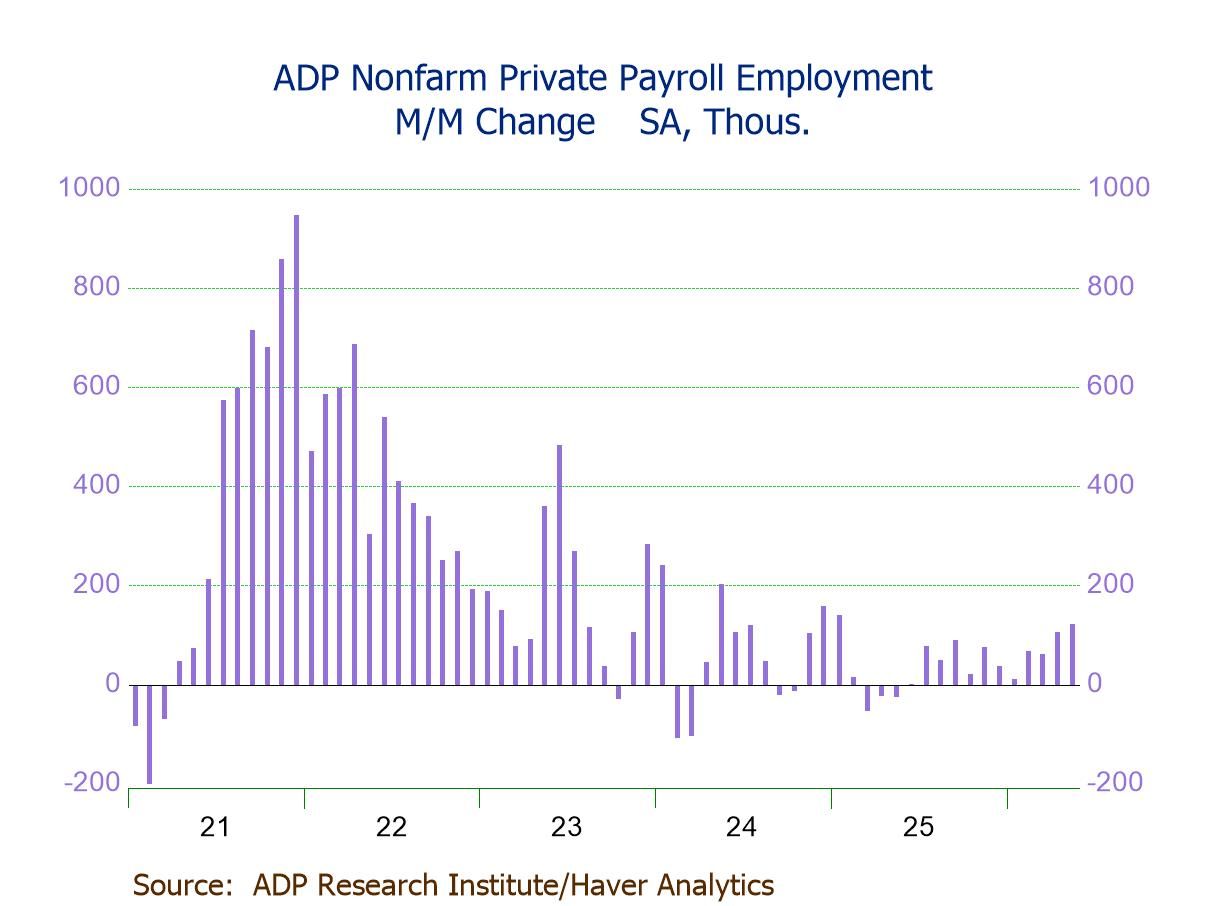
- Private payrolls +122K in May, largest of 11 straight m/m gains, indicating sustained labor-market momentum.
- Broad-based hiring across company sizes, driven by small businesses (+67K).
- Service-sector jobs up (+114K), led by education & health svs. (+57K) and trade, transp. & utilities (+36K), partly offset by information (-9K).
- Goods-producing jobs up (+8K), driven by construction (+8K).
- Wage growth down marginally y/y for job changers (6.5%) but steady for job stayers (4.4%).
 Global| Jun 03 2026
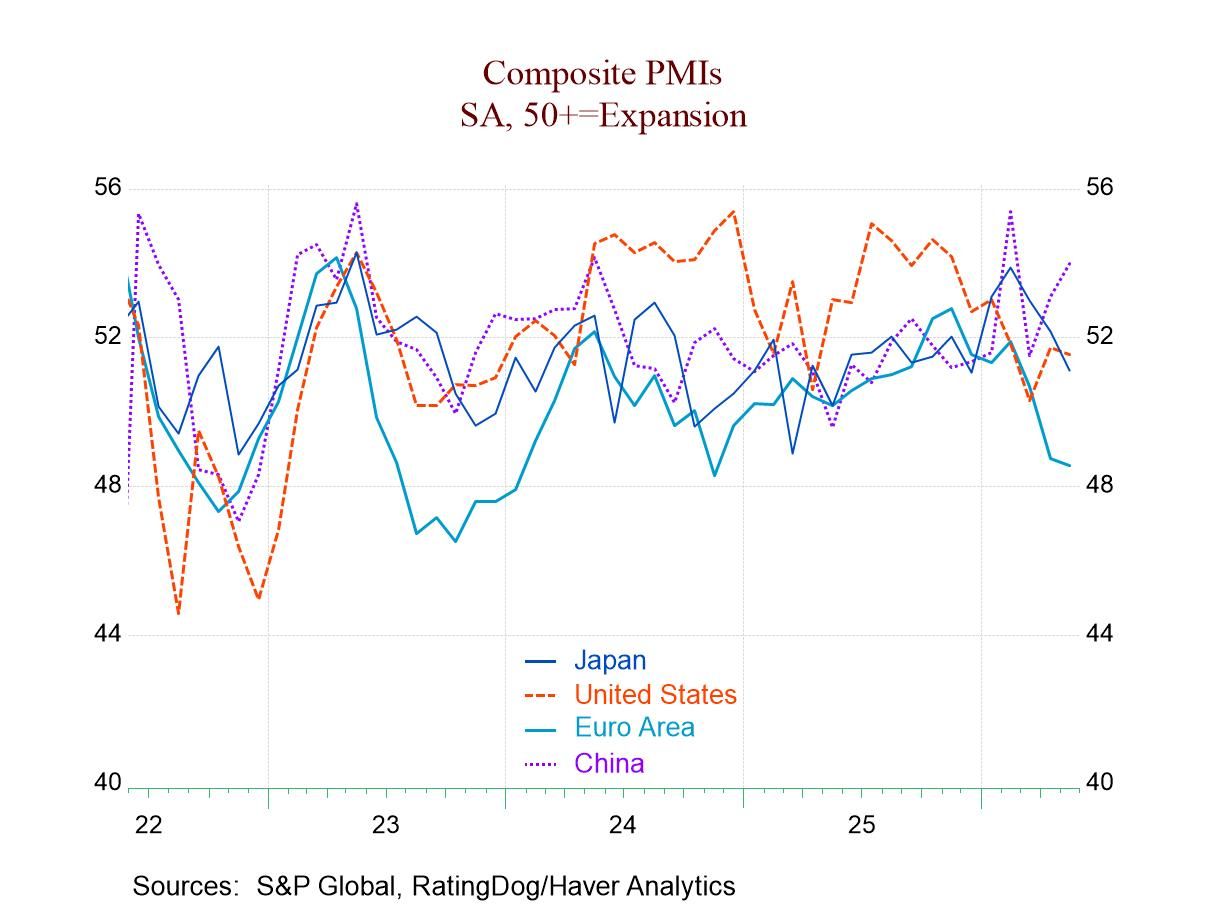
Composite PMIs Ride Weakening Trend
With 25 countries in the mix, it can be hard to draw a simple summary statement about the condition of the global economy judging from the S&P composite PMIs. The manufacturing sector has recently been doing better, while the services sector is still in an extreme bout of lethargy globally. Fewer countries issue specific services sector indexes than issue manufacturing or composite PMI results.
The services sector tends to dominate the composite readings, so what we see this month is a great deal of weakness in the S&P composites, reflecting service sector weakness. The 18 early reporting manufacturing reporters registered a median queue ranking in their 67.7 percentile; that compared to a median ranking of 26.2% for this group of 25. However, the two groups are not the same. If we recalculate for the 10 common reporters, we get a median manufacturing ranking of 61.5% compared to a composite median ranking of 23.8%; for those same ten, the services sector median ranking was in its 16.9 percentile. That is a ranking that seems to flirt with recession potentially. To that point, in May 2026, eleven of twenty-five composite PMIs registered diffusion values below 50, indicating contraction.
In May, among the 25 reporting composite PMI reporters, 44% of them were weakening month-to-month, which is less than half but still a very large proportion and not particularly good news; this followed 48% weakening in April and 84% weakening in March. So, with the heating up of war in the Middle East and the closure of the Strait of Hormuz, service sector conditions have gotten a lot worse even though it might have seemed logical that it would be the manufacturing sector that would suffer. The PMI data do not bear out that expectation. In March, the global PMI data improved only in Spain, Sweden, Zambia, and Ghana—thin gruel for good news.
On a monthly basis, there is sequential weakening in progress in the European Monetary Union, France, Ireland, and Japan.
If we look at the broader sequential data over three months, six months, and 12 months, we see that conditions have gotten progressively weaker, with 82.6% of these reporters weaker over three months, 78.3% weaker over six months, and 43.5% weaker over 12 months. There is progressive weakening on this broader timeline in the United States, Spain, India, Saudi Arabia, and the United Arab Emirates. There's sequential improvement indicated only in Singapore.
The queue percentile standing evaluations at the far right of the table rank and therefore order the data across these reporters, on observations back to January 2021. On that relatively long timeline, only 5 reporters have current readings above their respective 4.5-year. medians. Those are Singapore, China, Nigeria, India, and Sweden. On this timeline, the French composite is at its absolute lowest ranking of the period. The European Monetary Union reading is in its lower 10th percentile, with the four largest monetary union economies each having a ranking below their respective 35th percentiles. The U.S. ranking is in its 26th percentile, roughly just above the bottom quarter of its raked results. The U.K. is in its lower 18th percentile. Japan is near its median, at its 49th percentile; however, none of these readings are reassuring. For example, Japan’s near 50th percentile ranking compares to a weaker U.S. ranking, but the U.S. composite PMI diffusion value at 51.5 is stronger than Japan’s at 51.1. But the U.S. value is weaker relative to its history back to January 2021. Japan’s higher ranking actually simply refers to performance that is still quite weak, but nearly as good as it has done over the past 4.5 years. It is important to keep the relative (ranking) and the absolute (diffusion value) comparisons separate. Diffusion values are not presented in the table—except for a few averages/medians—because putting those data in table for the countries is prohibited by the data provider.
The weakness is broad-based. While the manufacturing sectors have been digging out, the services sectors have continued to worsen during the improvement in manufacturing—which I take to be a bad sign. Manufacturing tends to be the more sensitive signal, and we often think of manufacturing showing a turnaround in the economy before it becomes a process involving the entire economy. But in this case, it doesn't look like the manufacturing revival is progressing across the various economies. Certainly, one reason could be rising oil prices and the fact that oil prices eventually become an input to just about every single business—because if it's not a direct input, it's an indirect input through its impact on transportation costs.
Broad but mild slippage If we look at the average and median PMI values, we can see that while there has been broad slippage, the slippage has been quite slow. The average reading for this group over 12 months is the PMI at 52; that has slipped to 50.8 over three months and sits at 50.8 in May. The median for the group is 51.8 over 12 months; it has slipped to 50.6 over three months and registers 50.2 in May. The bad news is more that these economies have lingered at very weak readings than that there is technical slippage in progress. Over 12 months, there were only four of 25 reporters with PMIs below 50. Over three months, that figure has mushroomed to 9, and as of May, there are 11 reporters with PMIs below 50, indicating economic contraction. These are poor trends and clearly ones to watch. Weakness has been driven by the services sector where we get fewer observations and data, and this is a sharp counterpoint to some of the manufacturing data that have been improving.
 USA| Jun 02 2026
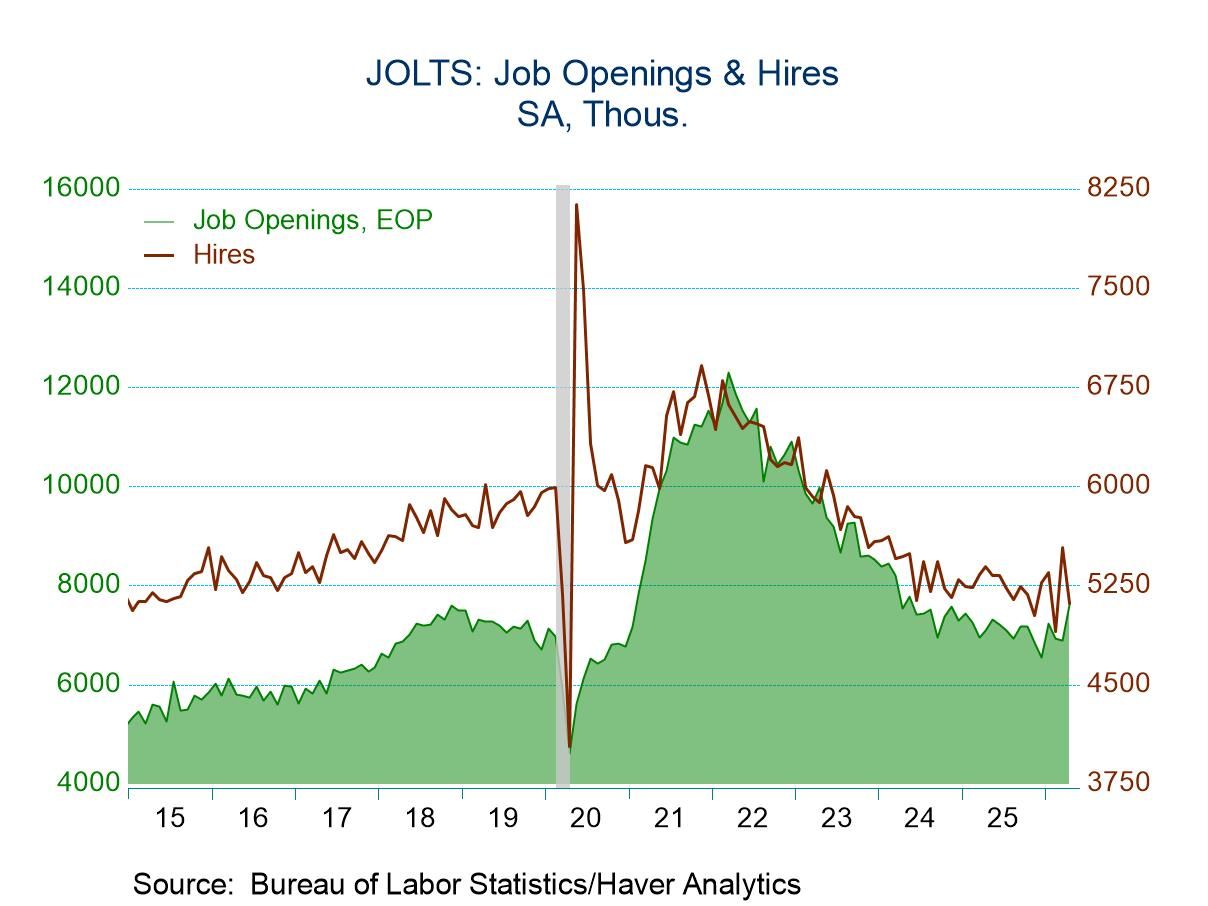
U.S. JOLTS: Openings Rose and Hires Fell in April
- Openings increased to their highest level since May 2024.
- However, hiring slumped, reversing most of the March increase.
- Separations fell with declines in quits, layoffs and other separations.
by:Sandy Batten
|in:Economy in Brief
- of2733Go to 13 page