
The global economy is still caught between two powerful and competing forces. On one side, the AI investment boom continues to support growth, industrial activity and equity markets, particularly in the US and parts of Asia. On the other, renewed Middle East tensions and higher energy prices are adding to inflation risks and broader policy uncertainty. The latest Blue Chip survey reflects this divide clearly: growth expectations have generally held up best in economies tied to AI-related investment and technology supply chains, while inflation forecasts have risen more sharply in more energy-exposed economies such as the UK and euro area (chart 1). Forecasters still largely expect only limited pass-through from higher energy prices into core inflation, although recent US CPI data suggest underlying price pressures remain somewhat sticky (charts 2 and 3). At the same time, the extraordinary continued surge in global AI investment — now approaching $300 billion annually — highlights the sheer scale of capital being deployed into semiconductors, data centres and digital infrastructure, particularly in the United States (chart 4). The divergence in industrial production trends also reinforces the growing gap between economies benefiting from structural growth drivers — such as Taiwan’s semiconductor sector and Denmark’s pharmaceutical industry — and those struggling with higher energy costs and weaker competitiveness, notably Germany and the UK (chart 5). Meanwhile, improving Chinese activity indicators suggest policy support and stronger technology demand may finally be helping to stabilise growth (chart 6). Overall, the world economy remains resilient, but increasingly uneven, with AI-related investment continuing to offset — though not eliminate — the drag from geopolitical fragmentation and rising energy insecurity.
More Commentaries
 Europe| May 13 2026
Manufacturing IP in EMU Slogs Ahead
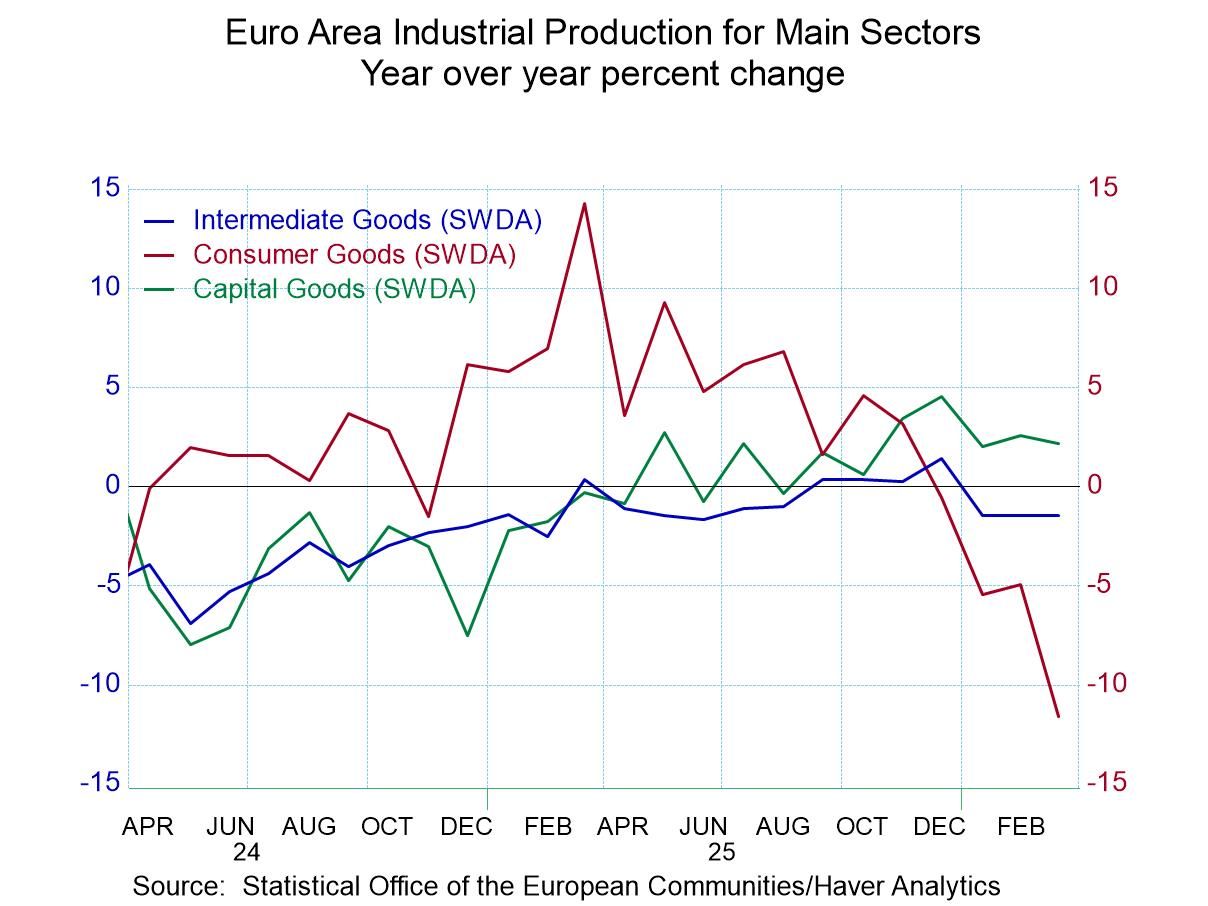
Industrial production in the European monetary area in March rose by 0.2%. Manufacturing output rose by 0.4%, marking two-months in a row of output increases. Output is still falling overall and in manufacturing over three months. Over three-months total manufacturing output excluding construction falls 2.7% annualized, over 6-months, it falls at a 0.4% annual rate, and over three-months the pace of decline steps back up again to -1.2% at an annual rate. The declines in manufacturing are more or less along the same lines.
Sectors Output of consumer goods fell in March, driven by a decline in the output of nondurable goods that fell 4.5% month-to-month. Intermediate goods output rose by 0.9% in the month, increasing for the second month in a row. Capital goods output rose 1.1% after rising 0.8% in February.
Sequential growth However sequential growth rates find headline growth negative over 12-months, six-months, and three-months- the same as for manufacturing. Consumer goods output declines at an accelerating pace dropping 11.6% over 12-months, at a 13.6% annual rate over six-months and at a 24.9% annual-rate over three-months. Those declines are led by reduction in consumer nondurables output. Intermediate goods output is mostly weak over the horizon, falling by 1.5% over 12-months and by 0.9% over 3 months annualized. The exception is capital goods sector where output rises by 2.2% over 12 months and accelerates to 4.6% over 6-months but then tails back, trimming growth to a 1.2% annual rate over three-months.
Country Performance On a country basis declines occur in only two early-reporting members; those are Malta and Germany in March. Over three months output declines in the monetary area occurs in Ireland and Luxembourg and in Germany- with increases elsewhere. Output declines over 12-months, six-months, and three-months in the monetary area only for Germany, Luxembourg, and Ireland. There are consistent output increases in the monetary union in Austria, France, Finland, Italy, Greece, and Portugal. For most countries, increasing output is the rule despite the weak headlines, indicating that large economies are faring worse than smaller economies.
Q1 Growth In the completed first quarter, we have manufacturing output falling by 1.8% at an annual rate and overall output falling at a 1.9% annual rate. Output declines in the quarter and in all major sectors. As for country reporters output falls in the quarter for Austria, Germany, Luxembourg, and Ireland.
Growth rate rankings So, the percentile queue standings presented in the right-hand column are rankings of industrial production growth rates over 12-months. Compared to recent history, overall output has a 17-percentile standing which is relatively weak, in the lower one-fifth of its ranked results over the period (back to 2006). Only capital goods output at 52.5% has a standing above the 50% level which places it above its median result for the period. Among reporting countries seven have percentile standings above 50%, above their respective medians. The countries where output does not grow at a pace in excess of its median are Germany, Luxembourg, Malta, and Ireland.
On balance the smaller countries seem to be faring better in the European monetary union. The last two months have been relatively good months for output across the union; however, January had been so weak that the two months have not been able to recover from the weakness experienced in January. And the March data hardly reflect the hardships that are going to be visiting these economies because of the rise in oil prices and concerns about the situation in Iran and the strait of Hormuz. The future is unlikely to get better.
 USA| May 13 2026
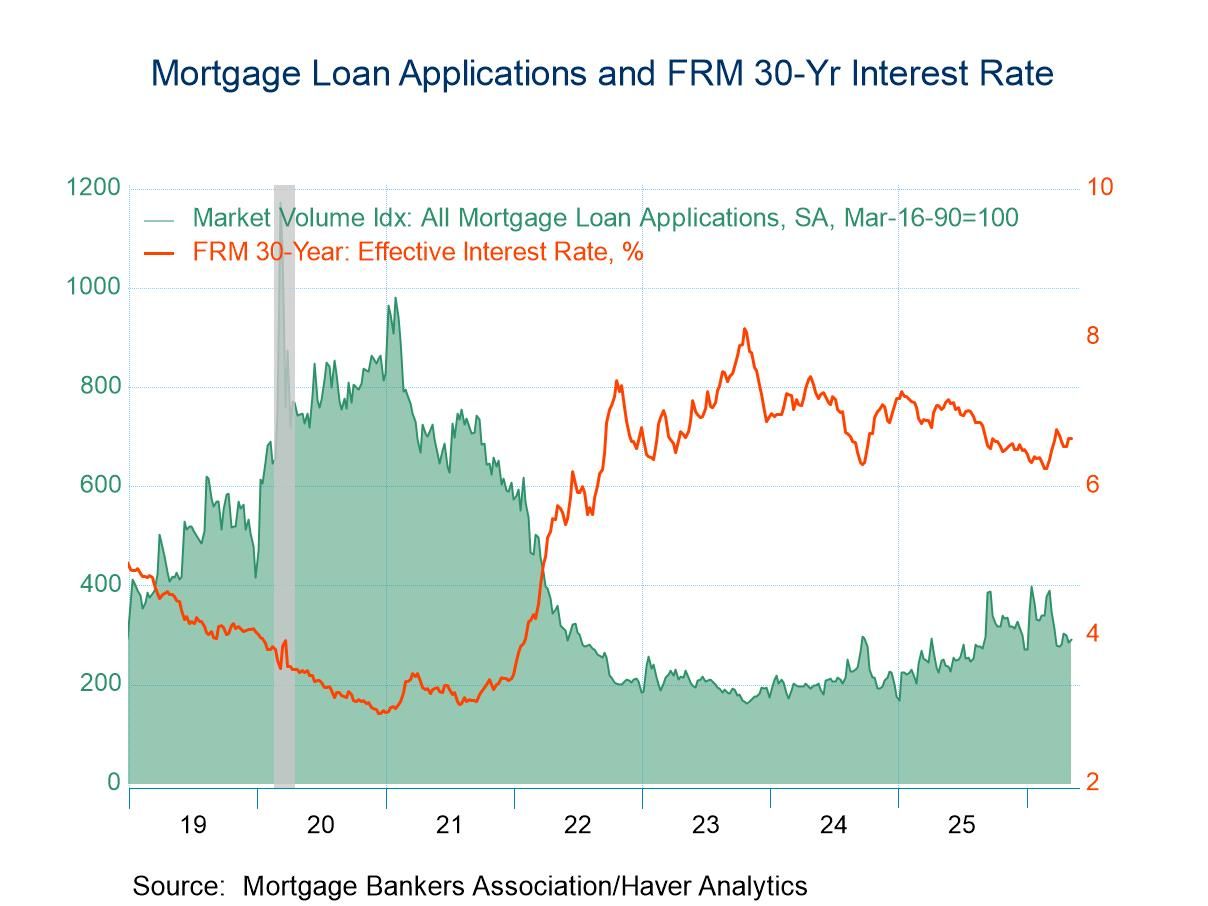
U.S. Mortgage Applications Rose in the May 8 Week
- Applications for loans to purchase rose, while applications for loan refinancing declined in the latest week.
- Interest rate on 30-year fixed-rate loans was unchanged at 6.64%.
- Average loan size edged down.
 USA| May 12 2026
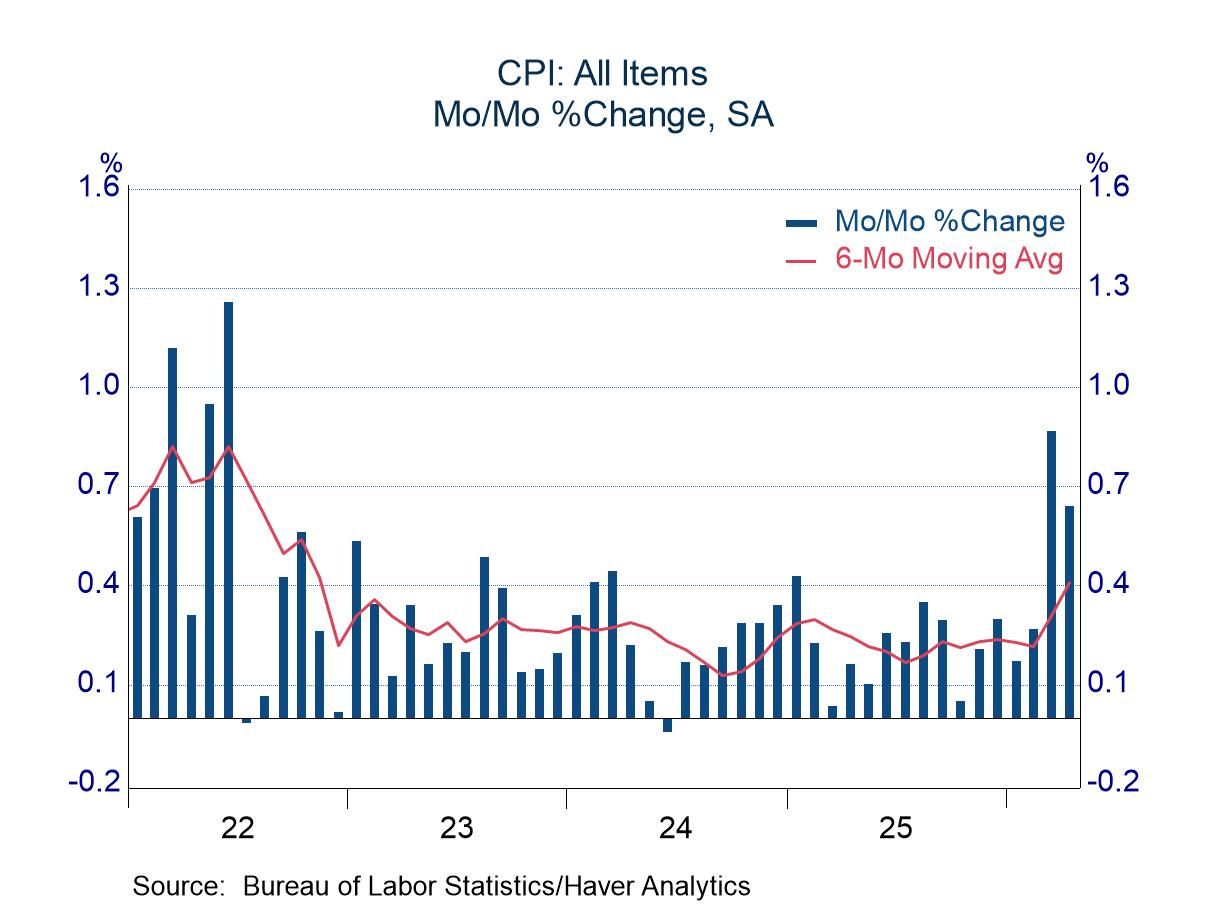
April CPI: More Energy Pressure; Food and Core Uncomfortable
- The increase in gasoline prices slowed from the blistering pace in March, but April still brought the third sharpest increase in the past three years.
- Fluctuating food prices left a high-side average change in the past three months.
- The core component was distorted by an anomaly in rents, but the pace was still brisk excluding rents.
 USA| May 12 2026
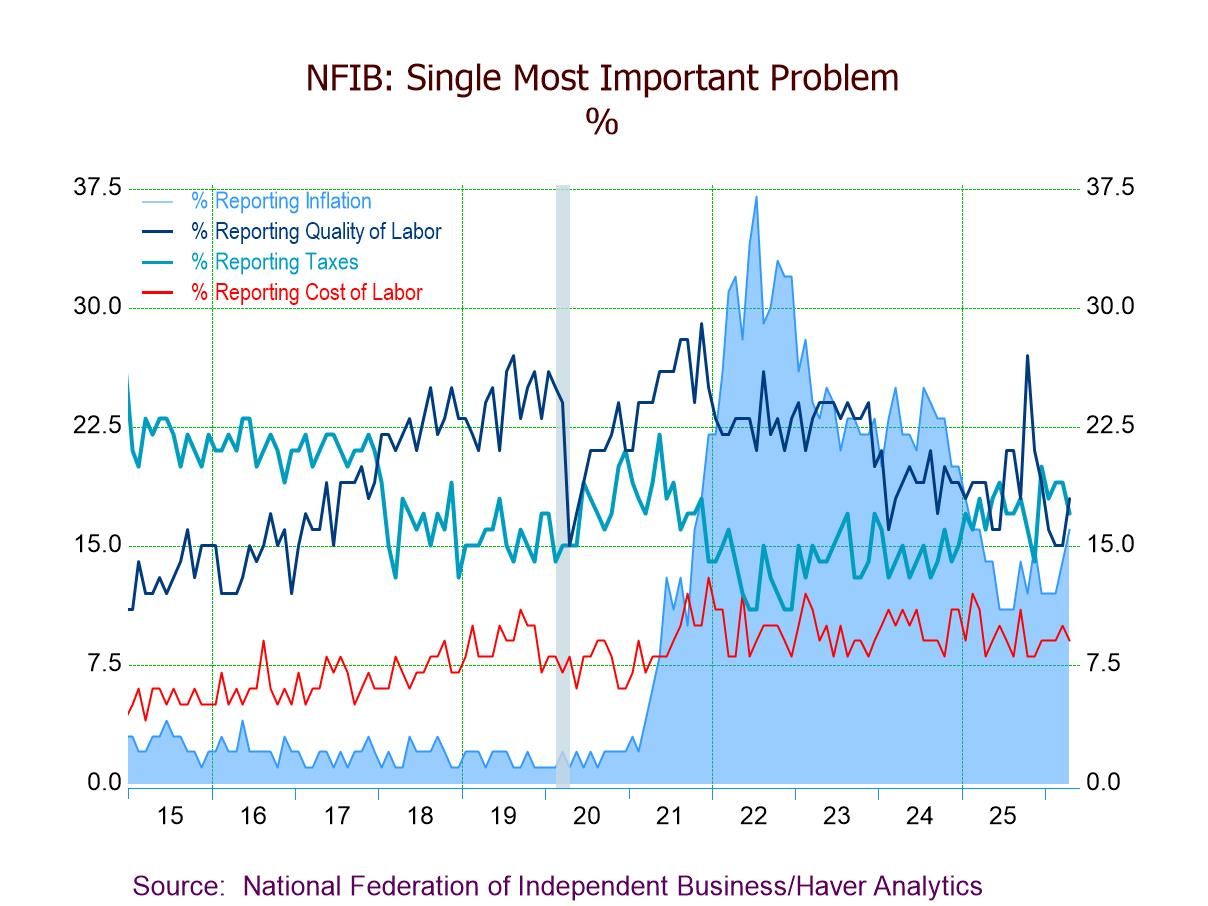
U.S. NFIB Small Business Optimism Still Fragile in April
- NFIB Small Business Optimism Idx up 0.1 pts. to 95.9 in Apr., still below its 52-year avg. of 98.0.
- Uncertainty Idx down 4 pts. to 88, remaining well above the historical avg. of 68.
- Expectations for economy down 7 pts. to 4%, lowest since Oct. ’24.
- Expected real sales down 4 pts. to 3%, a one-year low.
- Plans to expand business down 4 pts. to 7%, lowest since Oct. ’24.
- Firms raising avg. selling prices up 5 pts. to 30%, a four-month high.
- Top three business concerns: quality of labor (18%), taxes (17%), and inflation (16%).
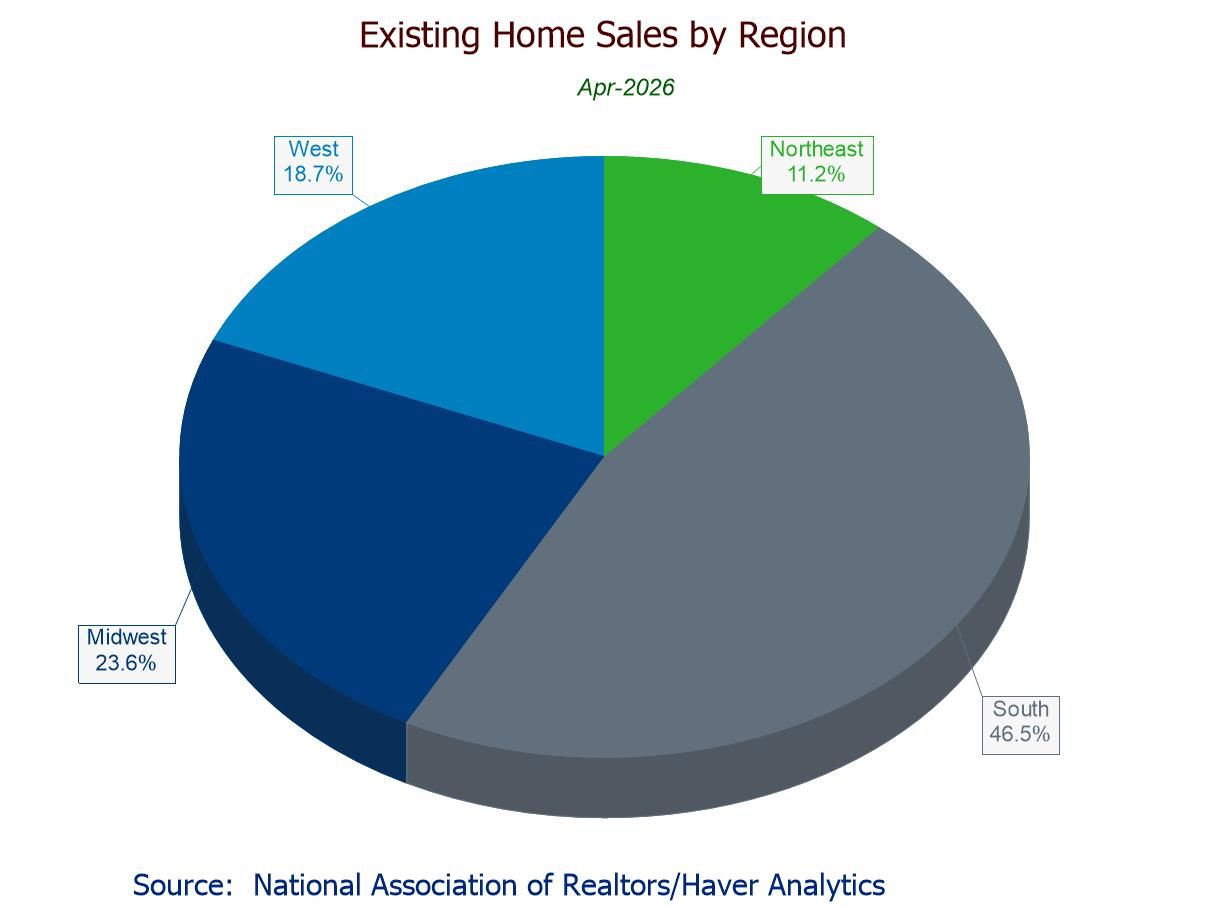
- April sales +0.2% m/m to lower-than-expected 4.02 mil.; 0.0% y/y after five straight y/y declines.
- Sales m/m up in the Midwest (+2.2%) and South (+0.5%), down in West (-2.6%), flat in Northeast; sales y/y up only in South (+2.7%).
- Median sales price +2.1% (+0.9% y/y) to $417,700, highest since Aug. ’25.
- Unsold inventory +5.8% (+1.4% y/y) to six-month-high 1.47 mil. units; 4.4 months' supply.
 Asia| May 11 2026
Economic Letter from Asia: Of Bits and Barrels
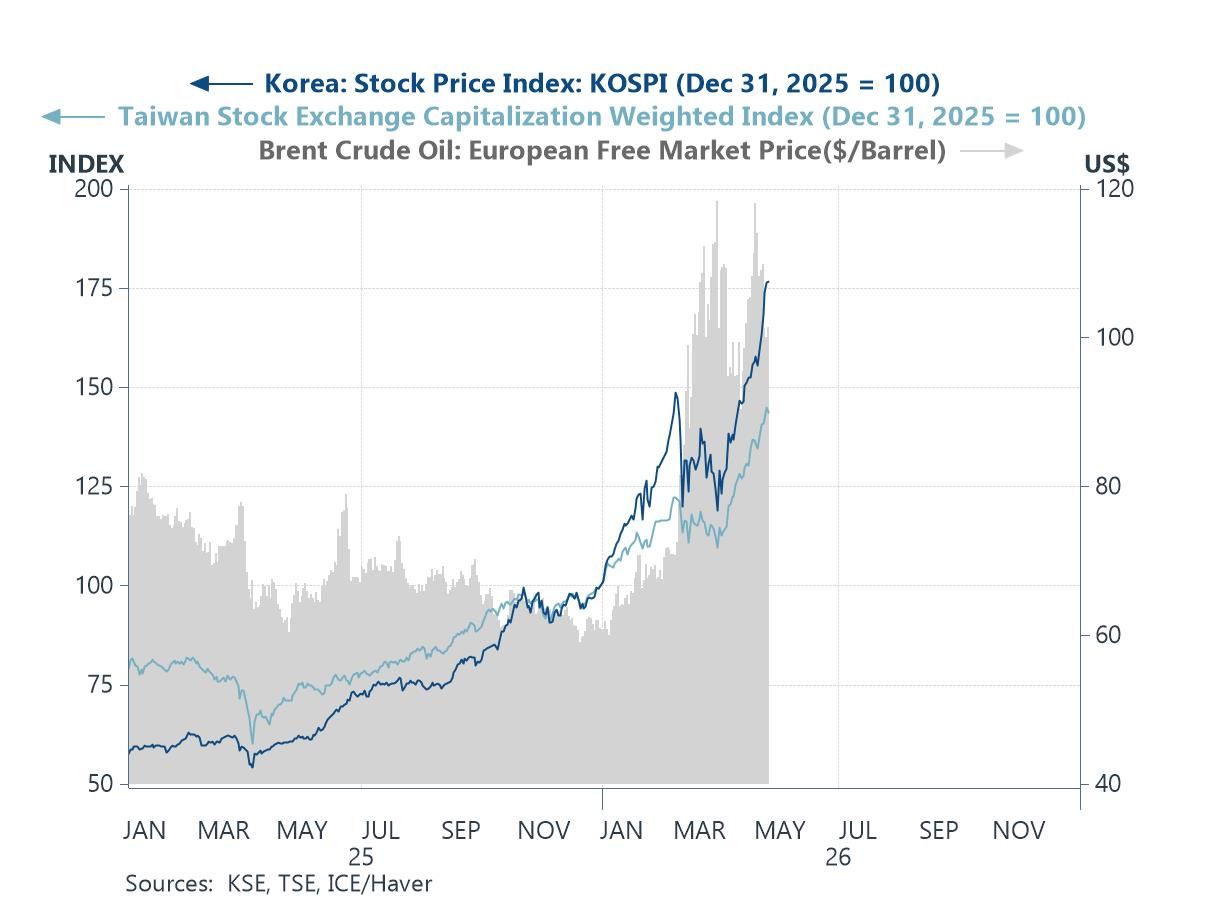
In this week’s Letter, we track the dual drivers of AI optimism and the ongoing Middle East conflict, and how they continue to shape market prices and investor expectations. AI-related enthusiasm has remained a key support for equity markets, particularly in highly exposed indexes in Taiwan and South Korea, while continued oil supply bottlenecks stemming from the closure of the Strait of Hormuz have kept crude prices elevated (chart 1). These dual forces are also evident in the latest Blue Chip Economic Indicators survey. Year to date, all Asian economies have seen upward revisions to inflation forecasts, while the most AI-exposed advanced Asian economy, Taiwan, has recorded a particularly large upgrade to real GDP growth expectations (chart 2). Looking more closely at the monetary policy implications of higher oil prices, this month’s survey shows an increasing share of panellists expecting central banks to resume or extend tightening cycles, marking a modest shift from last month’s results (chart 3). This shift is already partially reflected in recent data, with average inflation across Asia edging higher and several central banks already opting to tighten policy in response (chart 4).
Looking ahead, attention will likely centre on the Trump–Xi summit taking place in Beijing later this week. While any potential for additional Chinese mediation efforts regarding the Middle East conflict will be closely watched, developments on the US–China trade front should not be overlooked given the range of unresolved issues (chart 5). Finally, despite recent headline focus on the Middle East, China has continued to post steady export growth, while also managing to temper excessive domestic producer competition. Together, this has supported a combination of firmer external demand and more stable pricing dynamics—an “all-win” outcome for now (chart 6).
AI vs. the Middle East conflict The divergence between AI-driven equity market optimism and the persistence of elevated crude oil prices amid the ongoing Middle East conflict remains striking. On the one hand, equity markets—particularly in AI-heavy economies such as Taiwan and South Korea (chart 1)—have largely shrugged off concerns over energy supply disruptions. Investors remain focused on the upside potential from the current AI buildout cycle, driven by the rising computational demands of increasingly capable AI models. More recently, attention has shifted toward the scalability and broader applications of physical AI, including humanoid robots, and their potential implications for manufacturing, healthcare, and even household use. On the other hand, crude oil prices remain well above pre-conflict levels. The latest development is the US rejection of Iran’s most recent peace proposal, underscoring that a swift resolution to the US-Iran conflict remains unlikely.
 USA| May 08 2026
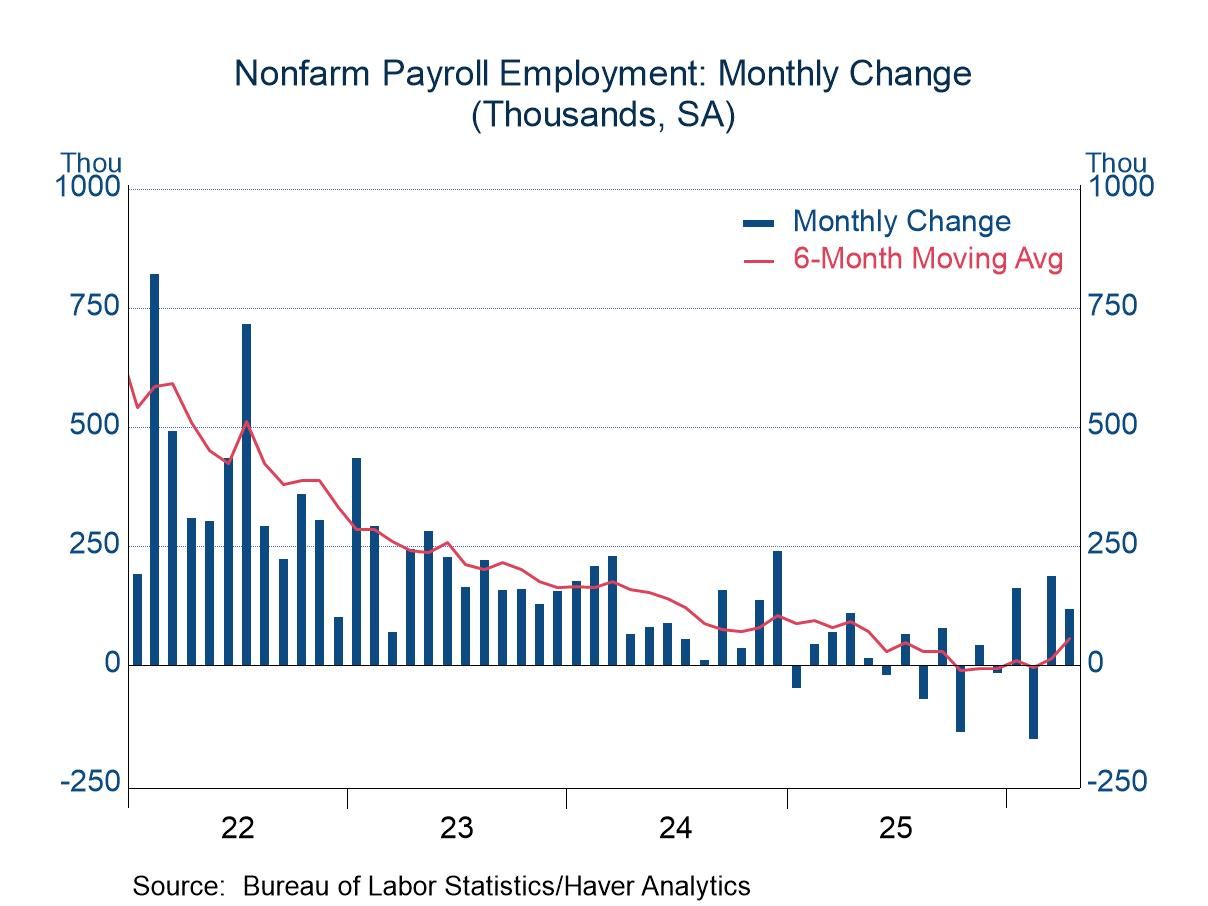
April Employment: Signs of Improvement
- Nonfarm payrolls advance for the second consecutive month.
- Unemployment rate steady; average hourly earnings tame.
 Global| May 07 2026
Charts of the Week: Still Standing
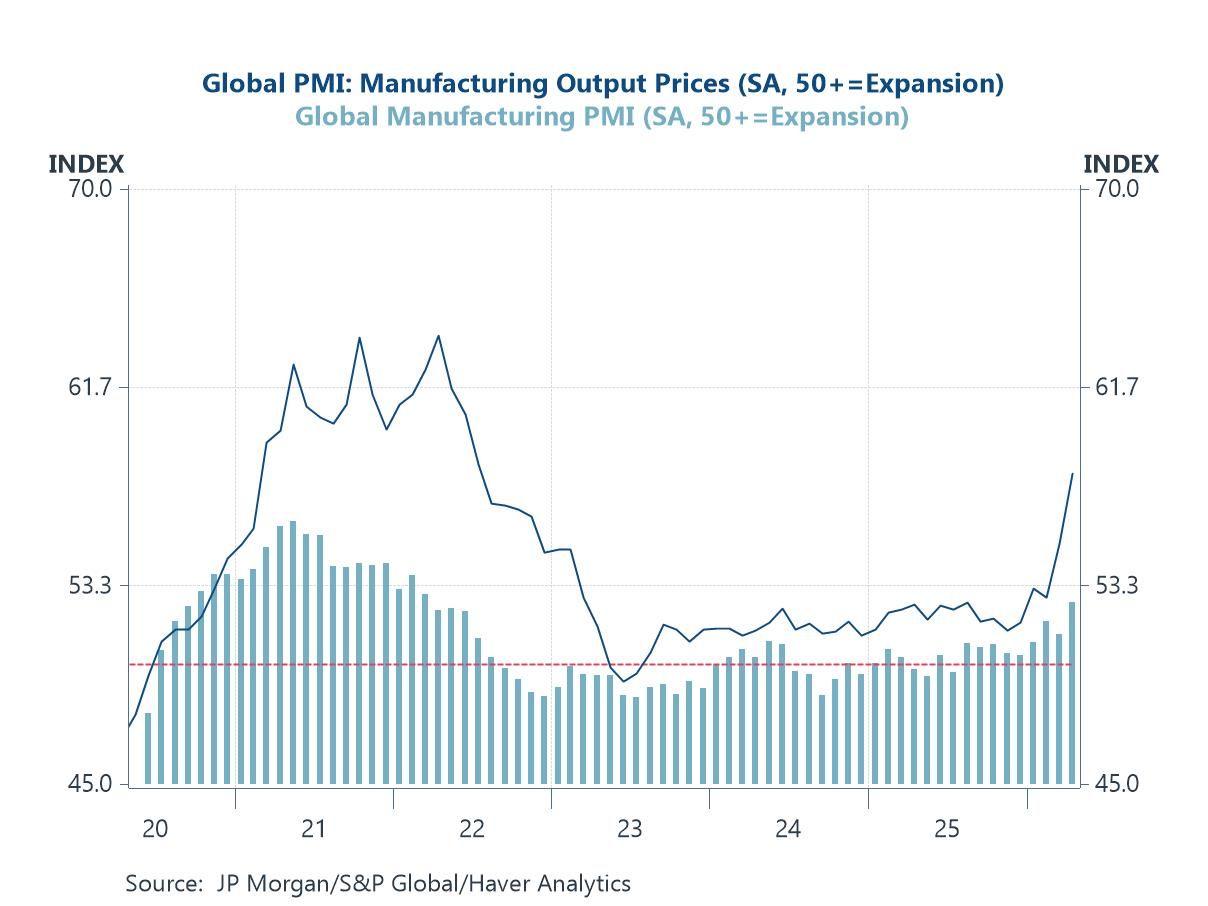
Recent developments point to the possibility of a peace settlement in the Middle East, which has offered some tentative relief to energy markets. Financial markets have responded with cautious optimism, but the outlook remains highly uncertain, with much depending on whether any agreement proves durable and supply disruptions are fully unwound. Against this backdrop, our charts this week highlight a global economy that is holding up better than expected but facing renewed cost pressures. Manufacturing activity remains resilient, supported by AI investment, reduced tariff disruption and defence spending, even as output prices firm (chart 1). Supply-side frictions are also still evident: shipping costs have risen, broader supply chain pressures are rebuilding (chart 2), and crude oil production has been curtailed by export and storage constraints among key regional producers (chart 3). These dynamics have reinforced inflation risks and shifted policy expectations in a more hawkish direction (chart 4). Meanwhile, US credit conditions appear broadly neutral, suggesting neither strong deleveraging nor releveraging pressures (chart 5). Finally, wage growth remains central to the outlook, particularly in the UK, where pressures are still comparatively elevated (chart 6). Taken together, the message is one of resilience under strain: growth is holding up, but the balance between inflation and activity is becoming increasingly delicate, leaving policymakers—and markets—navigating a narrow and uncertain path ahead.
by:Andrew Cates
|in:Economy in Brief
- of2716Go to 1 page