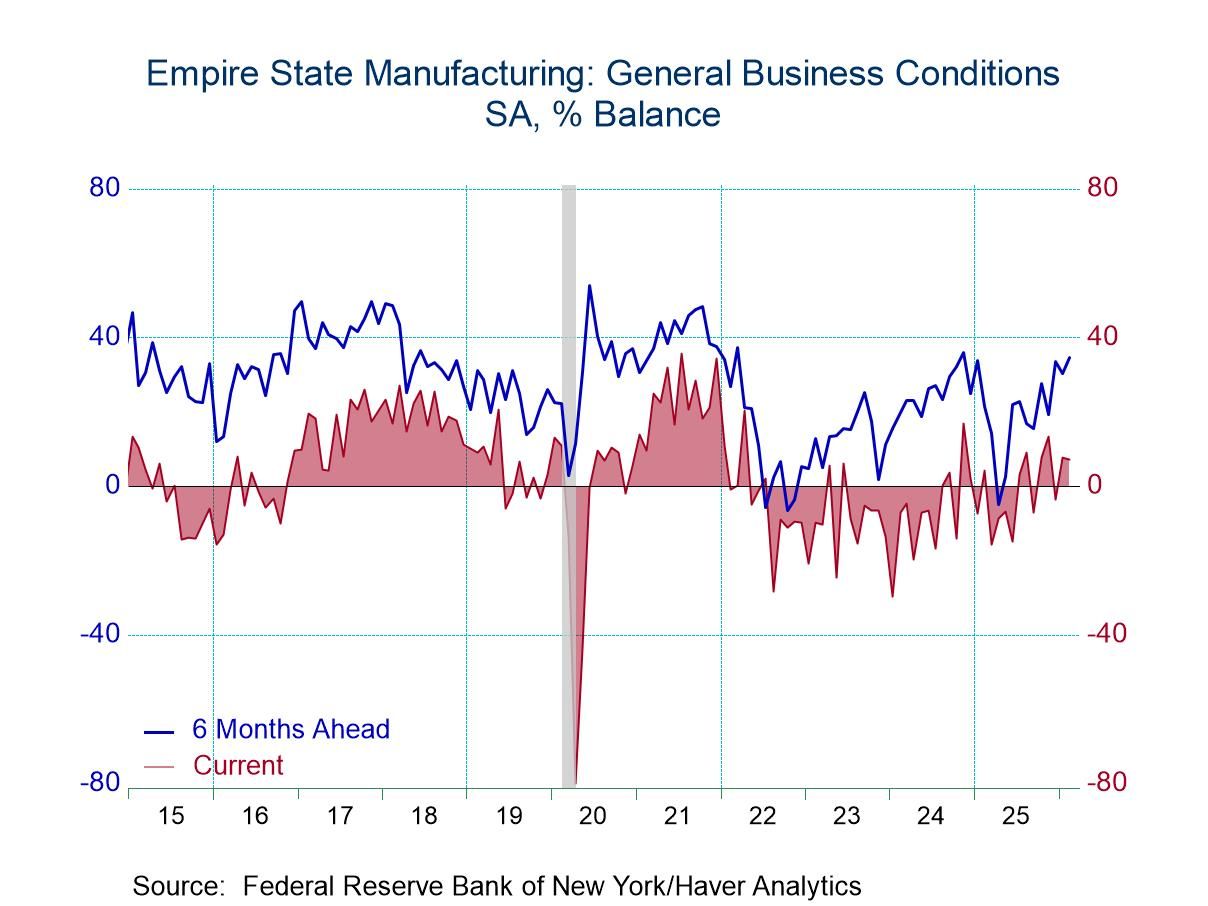
- The headline index edged down to 7.1 from 7.7 in January but continued to point to expansion.
- New orders slowed slightly while shipments plunged 17 points into negative territory.
- Prices paid and received both rebounded in February.
- Expected capital expenditures rose to a three-year high.
by:Sandy Batten
|in:Economy in Brief
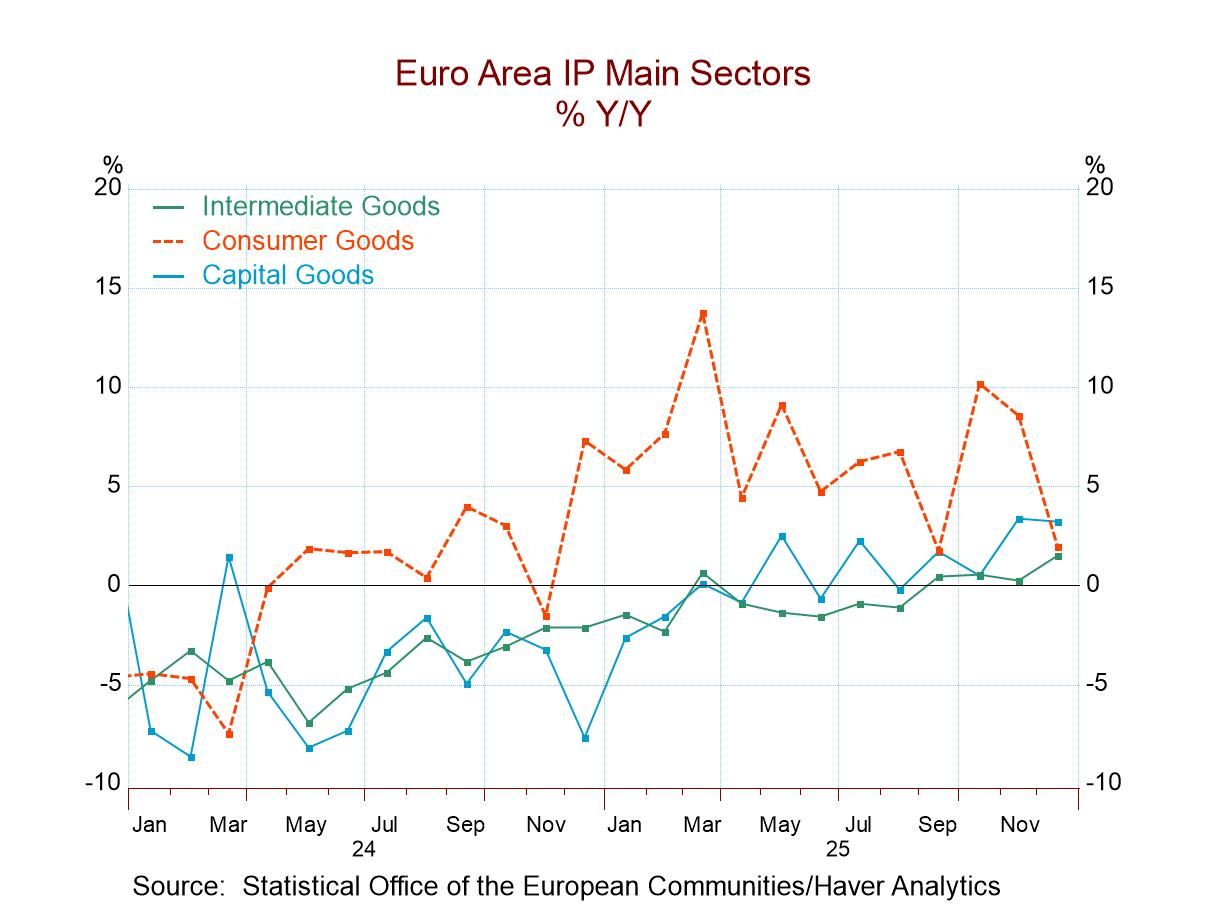
Industrial output in the European monetary union fell by 1.4% in December. Manufacturing output fell by 1.3%. Output of consumer goods fell by 0.3%, output of intermediate goods fell by 0.1%, and output of capital goods fell by 1.9% in December. The subsector, consumer durables, showed an increase in output of 0.2% in December. Headline and manufacturing output in December reversed the increases seen in October and November. However, consumer goods, consumer nondurables, and intermediate goods saw two consecutive months of output declines for November and December.
Turning to sequential trends, overall industrial output rises by 1.1% over 12 months, falls at a 0.8% annual rate over six months, and then falls at a 1.2% annual rate over three months showing a tendency for deceleration. Manufacturing shows the same pattern of eroding growth rates for the one-year and shorter horizons.
Sector stories However, for consumer goods, manufacturing output is accelerating steadily from a growth rate of 2% over 12 months, to a 7% pace over six months, and to a 16.6% annual rate over three months; the inclusion of ‘semi-durables’ in this category total makes it stronger than the two detailed subcategories of durable and nondurable goods. Consumer durables output transitions from falling 2.3% over 12 months to growing at a 3% pace over three months. Consumer nondurables output shows persistent declines, with slightly more intense over shorter periods, echoing the deceleration phenomenon. Intermediate goods and capital goods do not show clear sequential trends, but both categories show increases in output over all three horizons.
Cross currents These cross currents among sectors make it hard to characterize what's happening with output trends in the European Monetary Union. The country detail shows a good deal of turbulence, with a number of countries showing decelerating output trends and others showing accelerating output trends. It's fair to say that manufacturing in the EMU continues in the grip of cross currents. While the short-term data in the table that look at growth rates from 12-months to 6-months to 3-months show more weakening than strengthening, the trends in the graph across recent 12-month growth rates seem to show a little more solidifying and expanding behavior – albeit with confusing volatility as well.
Quarter-to-date (concluded Q4) In the quarter to date, all of the sectors and subsectors show output rising except for the aggregate for manufacturing that is flat, and consumer nondurables that show a decline at 6.7% at an annual rate. In the quarter to date, overall output is growing at a 1.4% annual rate, while consumer goods output is expanding at a 13.8% annual rate, immediate goods output is expanding at 1.5% annual rate, and capital goods output is expanding at a 3.7% annual rate. Those sector numbers look exceptionally healthy.
Ranking the trends The far-right hand column analyzes the 12-month growth rates comparing them to historic growth rates since 2006. Most of the growth rate rankings over this span are moderate, with standings above their respective 50th percentiles, placing them above their historic medians. However, consumer durable goods and nondurable goods are exceptions, with rankings in their 31st percentile and 10th percentile, respectively. Consumer nondurables output is particularly weak in comparison with historical trends. On the other hand, intermediate goods and capital goods output have rankings in their 60th percentile, and for all consumer goods output, the ranking is near its 60th percentile. Looking only at manufacturing, the ranking slips to its 52.9 percentile; for the headline series which excludes construction, the ranking is at its 53.8 percentile.
- USA| Feb 13 2026
Consumer Price Index: Slow, but Steady, Deceleration
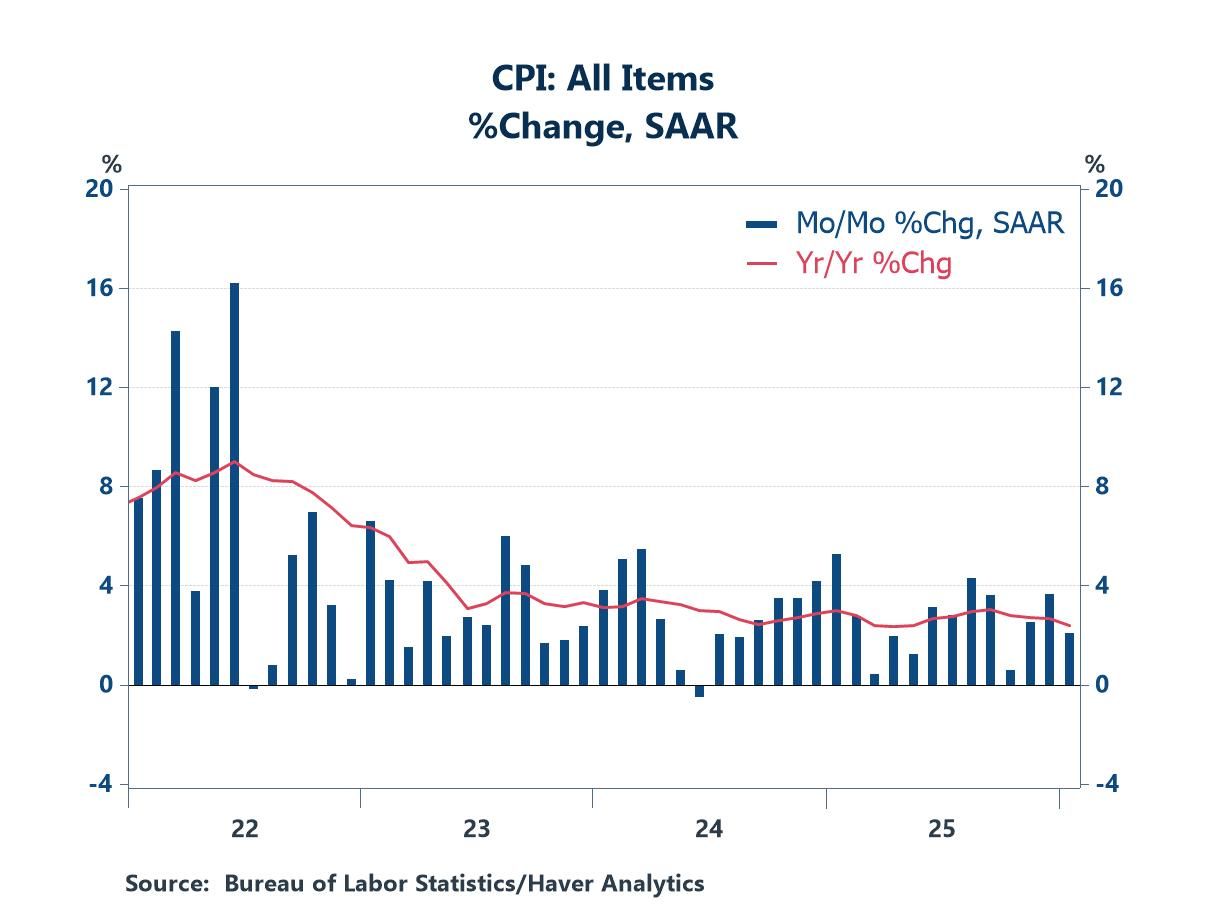
- The year-over-year change in the headline index moved to the bottom of its recent range.
- The annual change in the core index moved to a new low for the current cycle.
 Global| Feb 12 2026
Charts of the Week: AI-Led Growth Meets Monetary Divergence
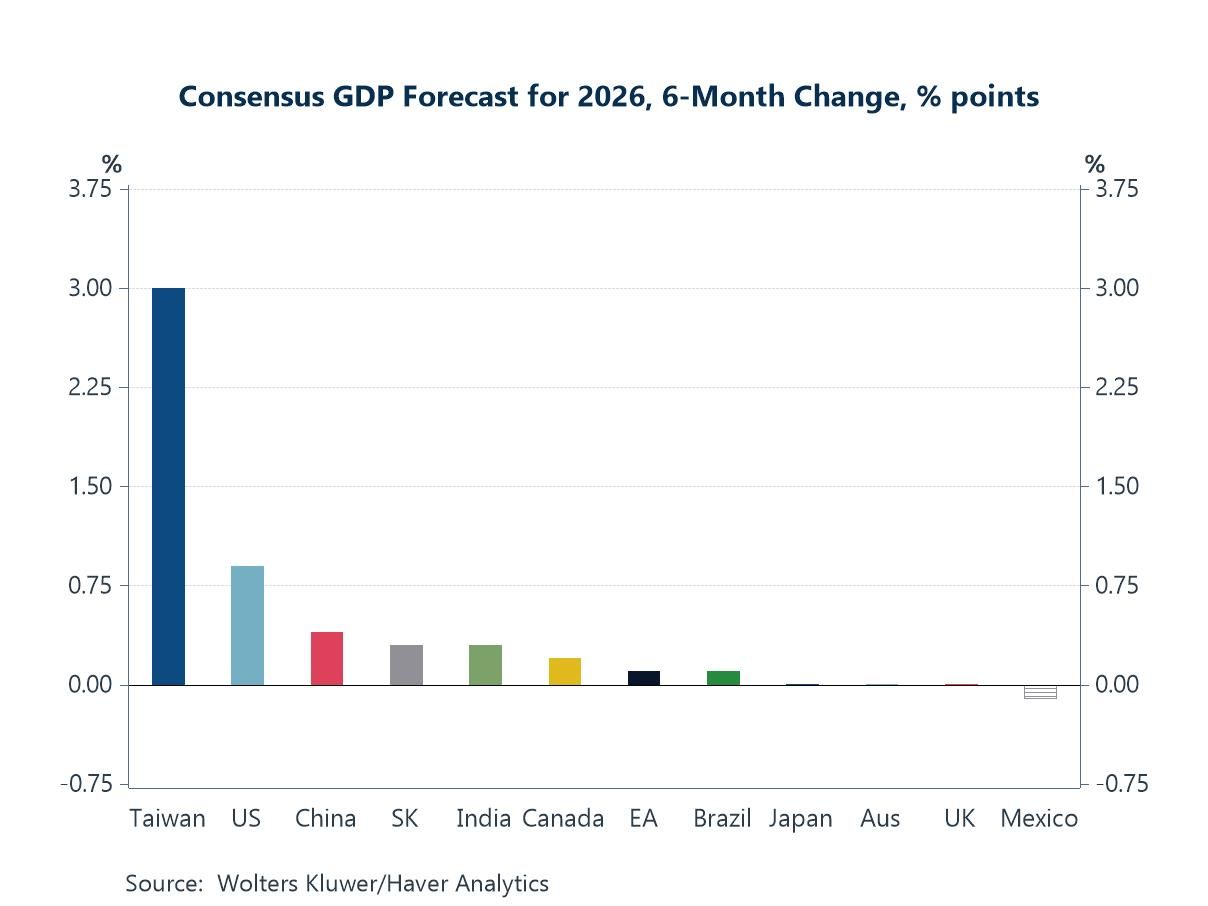
While markets have been unsettled at times by shifting policy expectations, geopolitical noise and questions around valuation, underlying global macroeconomic signals remain broadly supportive. Upgrades to Blue Chip consensus growth forecasts for parts of Asia — led by Taiwan — point to the tangible impact of the AI-driven tech cycle, a theme reinforced by the sharp rebound in semiconductor exports from South Korea (charts 1 and 3). At the same time, revisions to inflation forecasts underline a growing divergence in monetary policy paths, with easing still expected in the US and UK, while tighter stances persist elsewhere (chart 2). Importantly, there is little evidence so far that global supply-chain pressures are re-emerging in a way that would reignite inflation, notwithstanding lingering trade policy tensions (chart 4). Against this backdrop, rising policy uncertainty — particularly in the US — stands out as a potential source of risk, with implications for asset pricing and risk premia (chart 5). Yet the improvement in global sentiment surveys and a continued run of positive economic surprises suggest that markets are responding not just to policy noise, but to a genuinely resilient and improving macroeconomic environment (chart 6).
by:Andrew Cates
|in:Economy in Brief
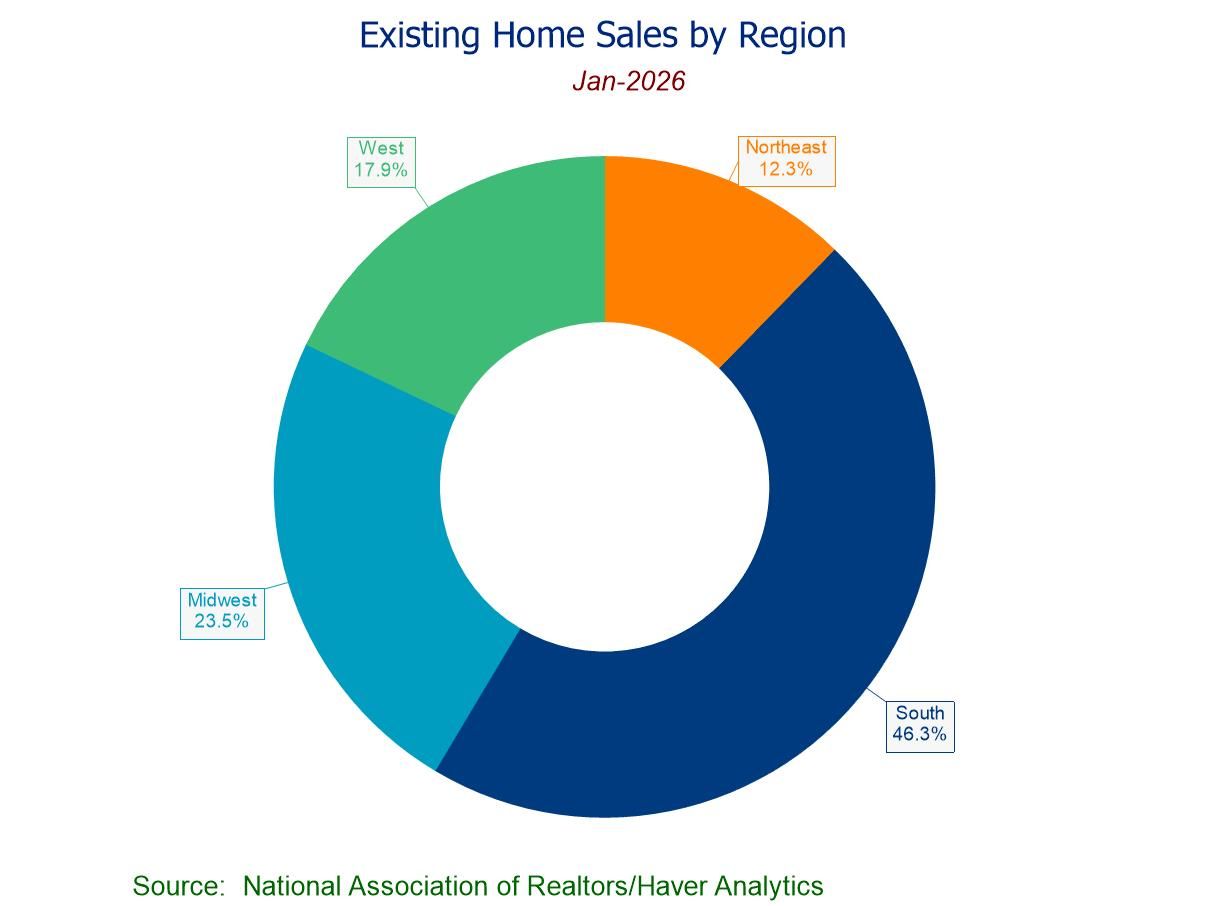
- January sales -8.4% (-4.4% y/y) to 3.91 mil., below expectations; steepest m/m fall since Feb. ’22.
- Widespread regional m/m declines: West (-10.3%), South (-9.0%), Midwest (-7.1%), Northeast (-5.9%); all regions down y/y.
- Median sales price -2.0% (+0.9% y/y) to $396,800, lowest since Feb. ’25.
- Unsold inventory -0.8% (+3.4% y/y) to 1.22 mil. units, a one-year low; 3.7 months' supply.
- USA| Feb 12 2026
U.S. Initial Unemployment Claims Declined in Latest Week
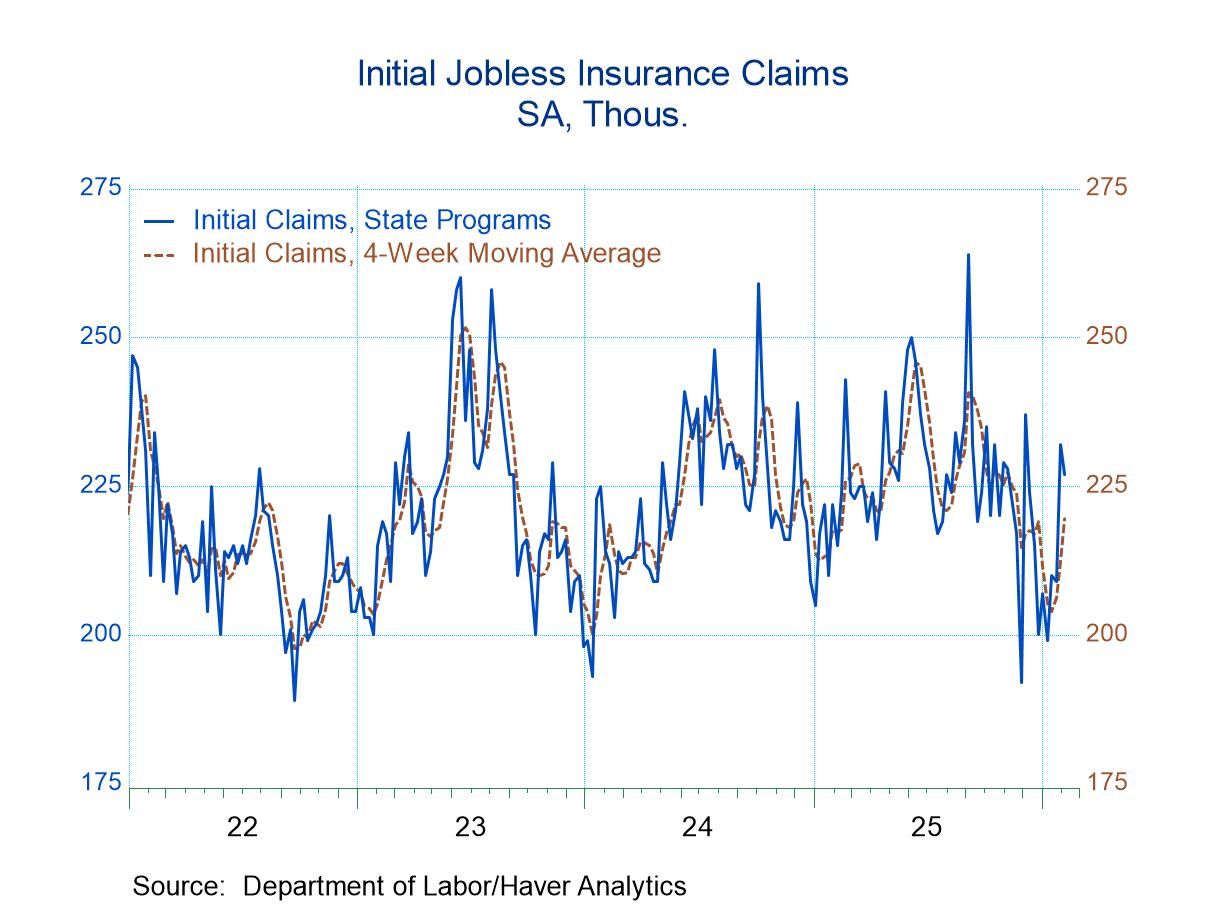
- New claims dropped 5,000 to 227,000.
- Continuing claims rose to 1.862 million.
- The insured unemployment rate remained at 1.2% for the tenth consecutive week.
- United Kingdom| Feb 12 2026
U.K. Second Half GDP Slows to a Crawl
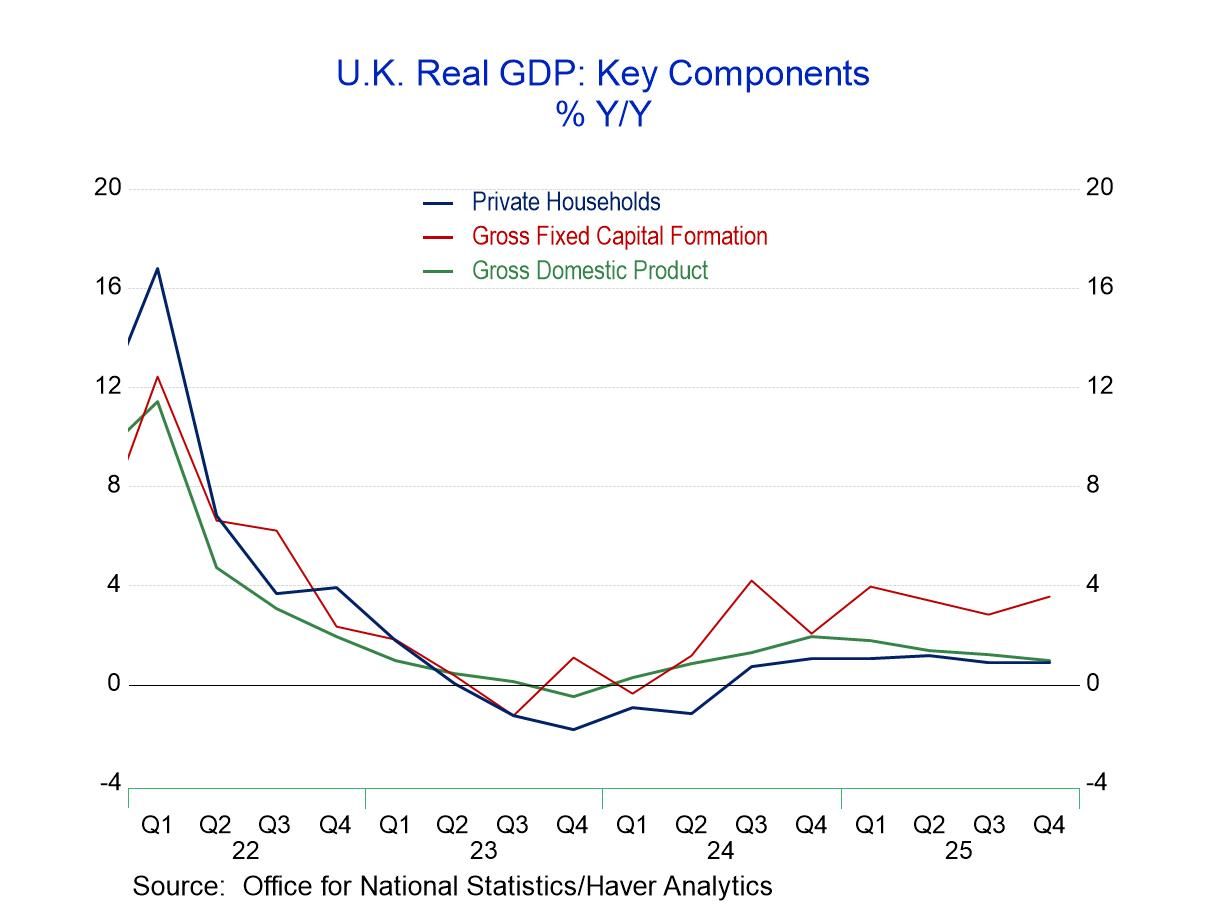
U.K. GDP slowed to a crawl at the end of the year, with growth at a 0.2% (annualized) rate logged in both the third and fourth quarters as 2025 drew to a close. The year had started with a strong 2.7% growth rate in Q1, which slipped to a 0.8% pace in the second quarter and decelerated to negligible growth at the end of the year.
These quarterly growth rates correspond to higher but obviously declining year over year growth rates. Because the quarterly growth rates diminished as the year progressed, year over year growth to start 2025 was at 1.8%; growth slipped to 1.4% in the second quarter and then to 1.2% in the third quarter. By the end of the year, growth had slipped to 1%.
The quarterly growth rates in the fourth quarter show public spending picked up to a 1.7% annual rate following 1% in the third quarter and erratic behavior in the first two quarters. Capital formation has remained relatively strong but has also oscillated, with first quarter growth at a blowout annual rate of 14.3%, falling to a contraction of 3.1% in Q2, rising back to 4.4% in Q3, and then declining at a 0.5% annual rate in Q4. So the year-over-year growth rates for capital formation during the course of the year only slipped from 4% in the first quarter to 3.6% in the fourth quarter, holding up fairly solidly and indicating strong rates of expansion for capital spending.
Housing, which was firm and strong in Q1 and Q2, slipped to a 0.8% annual rate of growth in the third quarter, and then housing investment fell at a 9.1% annualized rate in the fourth quarter. Year over year trends for housing show mostly low to moderate spending growth for residential investment.
U.K. exports have been floundering quarter-to-quarter, alternating between expanding and contracting; this corresponds to year over year growth rates that steadily diminish. In the first quarter of 2025, exports grew 3.5% year-over-year; that slipped to a 2% growth rate in Q2, then to a 1.5% growth rate in the third quarter. In the fourth quarter, U.K. exports are falling at a 0.5% annual rate of growth.
The export pattern contrasts with U.K. imports. They have mostly continued to grow, posting positive growth rates in three of the four quarters, starting the year with 5% quarterly growth and ending the fourth quarter with a 3.3% annual growth rate. Import growth rates have slipped, but not as much as other growth rates in GDP. For example, first quarter import growth was extremely strong at 7.6%; that year over year growth rate slips to 2.1% in Q2, then rises back to 5.3% in Q3, and finishes the year at 2.3%. There is slippage, but still significant growth, and the year began on a really high note.
Domestic demand has been fluctuating. In both quarterly and annual terms, there is unevenness. Quarterly growth rates range from 3.1% at an annual rate in Q1, to a 0.6% and 0.7% annual rate in the middle two quarters of the year; domestic demand ends the fourth quarter with a quarterly growth rate of 2.1% annualized. This causes year-over-year growth to be 2.9% in the first quarter; that falls to 1.2% in the second quarter, rebounds to 2.1% in the third quarter, and ends the year at 1.6% year-over-year.
Domestic demand has consistently been stronger than private consumption and it has been supported by both public consumption and by capital formation. Private consumption in 2025 has been erratic, logging 1.2% quarterly growth, annualized, in the first quarter; growth dropped to 0.2% in Q2, rising back to 1.7% in Q3, and then ending the year at a 0.6% rate of expansion quarter-over-quarter. The year-over-year data showed private consumption slipping but not dramatically, at a pace of 1.1% in the first quarter, up to 1.2% in the second quarter and then logging 0.9% in both the third and fourth quarters of 2025 as domestic demand ended the year stronger.
All of the U.K. growth rates are consistently and substantially below their five year growth rates. The economy continues to have a problem with inflation. Some recent inflation signals, however, suggest that there may be deceleration and progress, but the Bank of England hasn’t been convinced yet, even though Monetary Policy Committee members continue to speak favorably about the prospects for rate reductions ahead. The U.K. also has a corseted fiscal situation as there’s not much flexibility to spend more given its relatively bloated budget. The economy is waffling. The current administration has had its share of political issues, having recently had to eject several members from leadership positions in government. The outlook for growth is still touch and go. The outlook for inflation holds slightly more promise for deescalation. But overall, there is a lot of uncertainty over events and the growth path for the U.K. economy.
- USA| Feb 11 2026
January Employment Report: The Labor Market Has a Pulse
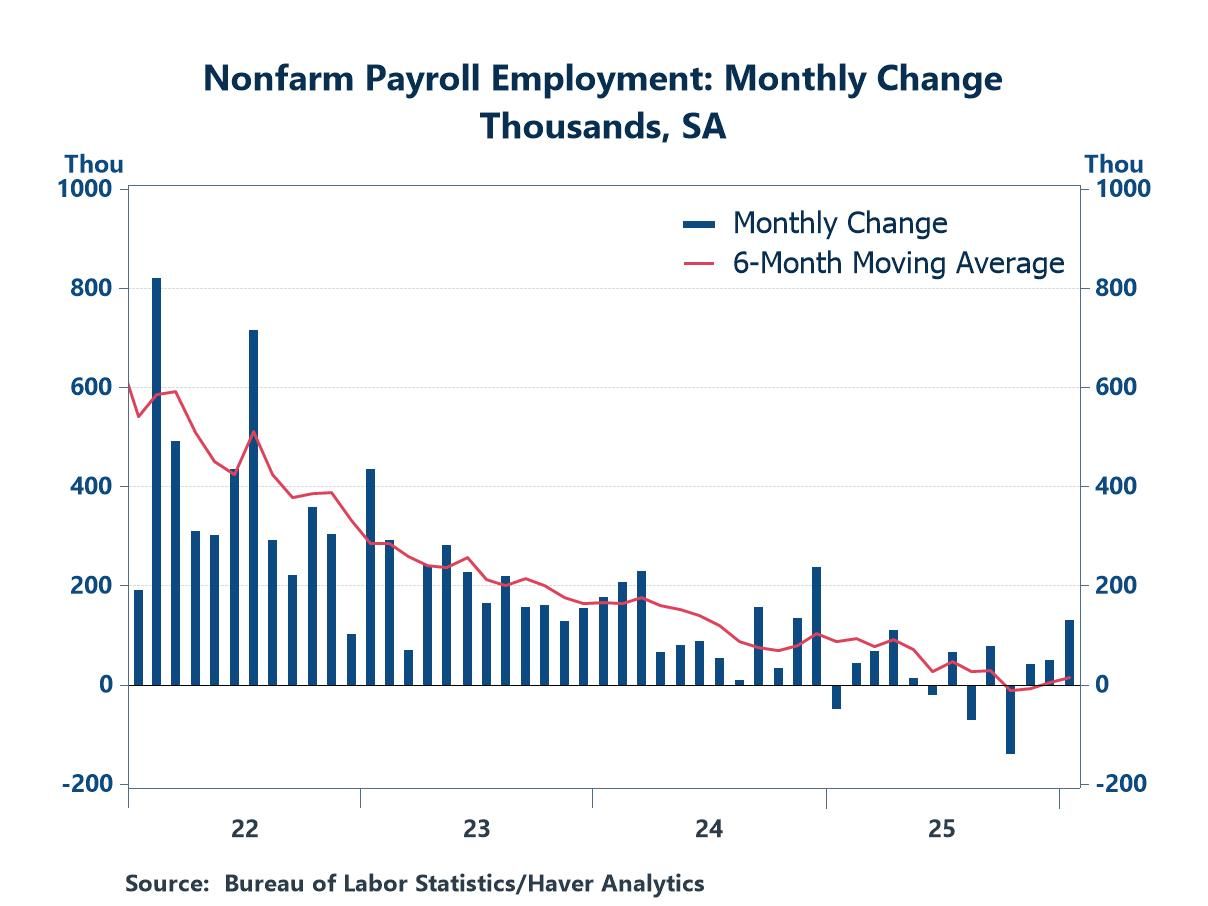
• The increase in employment in January was firm, although narrowly based. • The unemployment rate dipped for the second consecutive month, led by strong employment as measured by the household survey. • The benchmark revision included with this report showed that job growth in much of 2024 and early 2025 was softer than previously believed.
- of2696Go to 2 page


