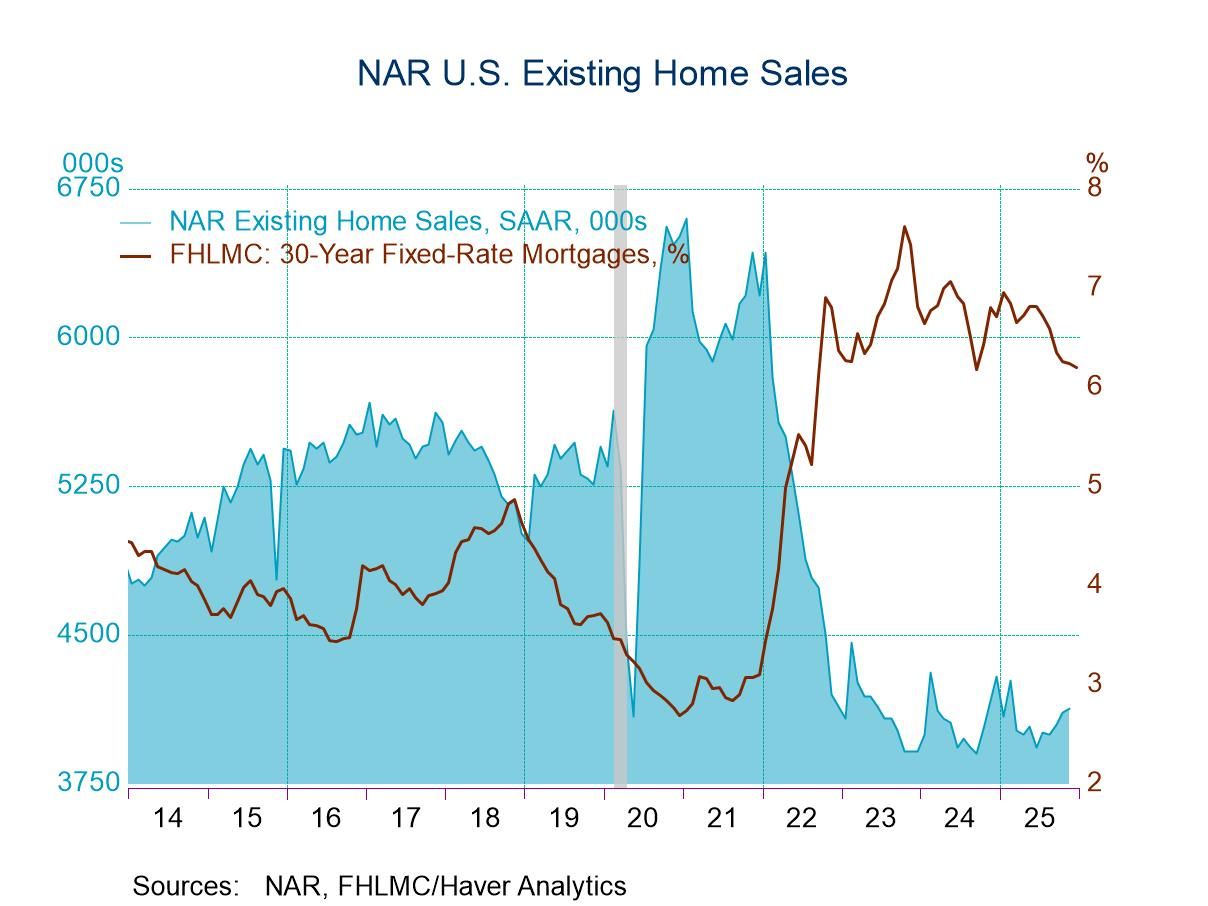
- Existing home sales increased 0.5% m/m in November, the third consecutive monthly gain.
- Month-over-month sales increased in the Northeast and South, were unchanged in the West, and fell in the Midwest.
- Year-over-year sales were unchanged in the Northeast and South and decreased in the Midwest and West.
 USA| Dec 19 2025
U.S. Existing Home Sales Edged Up in November
by:Sandy Batten
|in:Economy in Brief
 United Kingdom| Dec 19 2025
CBI’s Distributive Trades Survey Weakens Sharply in December
The new UK Confederation of British Industry (CBI) survey on the distributive trades sector shows a sharp weakening of an already weak survey for December and for the outlook into January of 2026.
The month-to-month deterioration from November was widespread across metrics for retailing as well as for wholesaling for the current month as well as for the outlook. The monthly degradation is without exception across the board - omitting the inventory metric which is a different animal in any event since inventory building is sometimes involuntary.
The Retail survey Current conditions: In December, the retail survey for sales compared to a year ago, orders compared to year ago, and sales for the time of year (a seasonal adjustment metric), all worsened month-to-month. The November readings were weak and in December sales compared to a year-ago worsened by 12 points, Orders compared to a year ago worsened by 17 points month-to-month and sales for the time of year worsened by 11 points. These metrics for December are below their respective 12-month average by 6 to 13 points, as well for these categories. The rankings tell a stark story, year-on-year sales have been lower only 5.3% of the time, Year-on-year orders have been weaker only 5.6% of the time, while time of the year sales have been lower only 13% of the time. These are all extremely low-ranking metrics.
Expected Conditions: In January expected conditions have weakened month-to-month by amounts ranging from 33 points to 16 points depending on the metric. And sales and orders compared to a year ago as well as sales for the time of year each are weaker than their respective 12-month average readings by amounts ranging from 4 points to 23 points. The rankings on expectations are even worse than for the current metrics. Expected sales compared to a year ago rank lower less than 1% of the time, the same is true of orders. While sales for the time of year have been weaker 7.7 percent of the time.
Wholesale survey The rankings for wholesaling are even lower than for retailing across the current and expected metrics. The month-to-month degradation for the current readings ranges from 7 points to 17 points weaker while the reading degradation monthly ranges from 5 points to 16 points. Wholesale sales and orders compared to a year ago and sales for the time of year each rank below the 5% mark. The expectations for January shows expectations for the three categories each are at a 2.5 percentile standing or lower.
Summing up The distributive trades survey has all but crashed and burned in December. Over the last 26 years the average of the three current metrics’ rankings has been lower only 18 times. The average outlook ranking for the month ahead has been weaker only 5 times in the last 26 years (over 313 months). On a relative basis the expected sales/orders performance is more depressed than the Current results for January. The pooled rankings show current ranking over the past 26-years weaker only 5.8 percent of the time with expectations lower only 1.6 percent of the time. These are very weak metrics. It is surprising that the BOE is walking on eggshells to cut rates with mixed support for rate cuts amid such weakness. There is already a GDP decline in the monthly data for October. UK and inflation is still too high, but it is breaking lower at a relatively fast pace. Will the UK be the first economy down after Covid?
 Belgium| Dec 18 2025
Belgian Consumer Confidence - On the Rise, but Weaker Month-to-Month
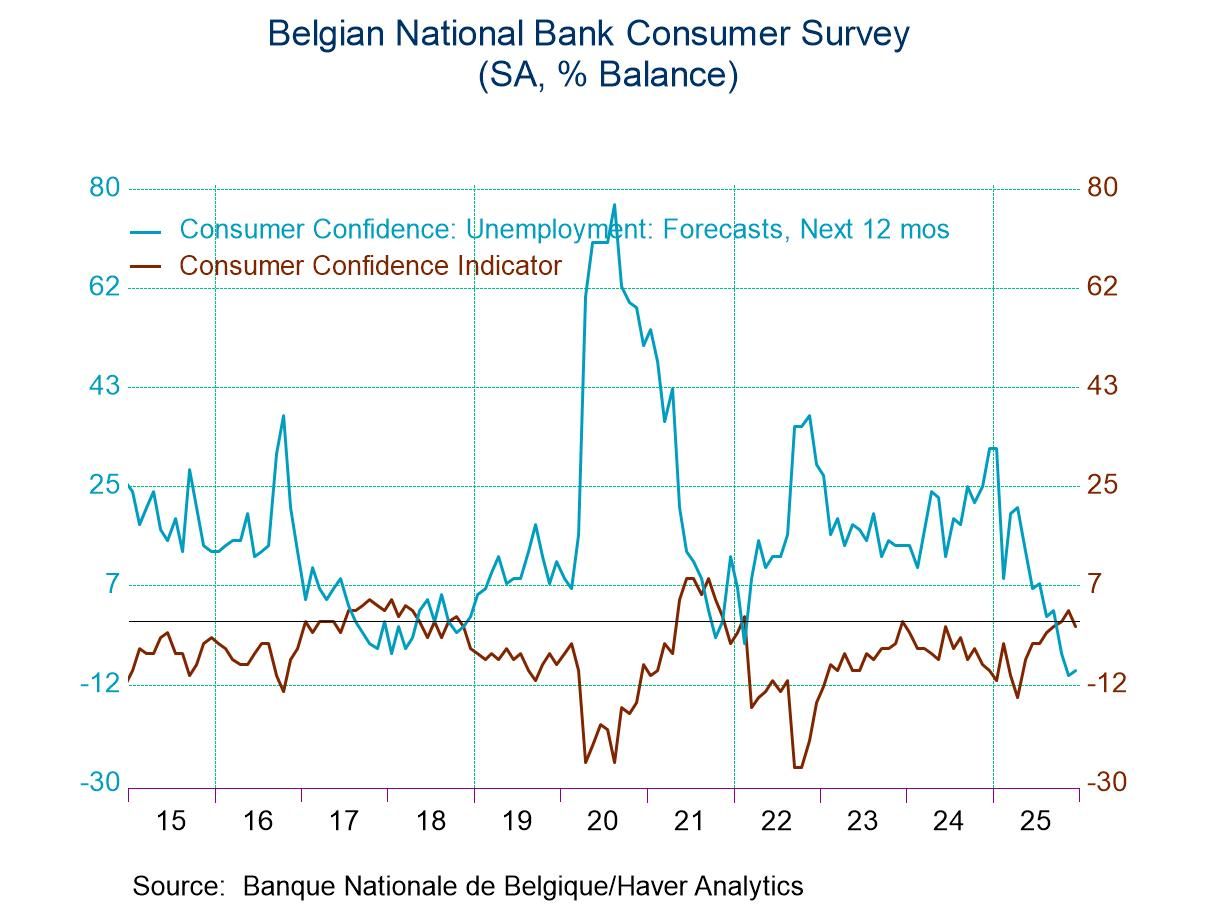
Belgian consumer confidence has been on the rise since early this year, however, in December the index has taken a step backwards with a reading of -1 compared to a November reading of +2 and then an October reading of zero. The confidence indicator, on data back to 1991 has a ranking in its 78.5 percentile, marking it as a reasonably strong reading on confidence compared to its values over that period. On the whole the trend is still solid, the month’s step-back is small.
The Economic Situation Economic situation for the next 12 months is weaker in December on a reading of -28 compared to -26 in November. The assessment of the previous 12-months is weaker in December at -42 compared to a reading of -38 in November. The outlook is weaker and the recent legacy is assessed as being slightly weaker as well, than it was in November. The assessment of the economic situation for the next 12 months is weak at a 9.7 percentile standing and the assessment of the previous 12 months is also weak at a 23.4 percentile standing.
Price Trends Price trends are seen as higher over the next 12-months at a reading of 38 compared to 27 in November. The backward-looking assessment of price trends also has them stronger in December than in November at a reading of 58 compared to 56 in November. Both of these price trend assessments are high with the outlook reading at its 94th percentile and the backward-looking assessment in its 81st percentile. Price expectations hit their low mid 2023-late 2023 and have been on the rise steadily ever since. The price metric of ‘12-months ahead’ was at zero in April of 2024 but climbed to +19 by February 2025 and currently sits at a level of 38. Price expectations are well in gear to the upside in Belgium despite relative price stability in the Euro-Area.
Unemployment Concerns about unemployment elevated slightly in December to -9 from -10 in November but these are significant readings compared to, say, the 12-month-ago reading which is at a level of +32. The sense of backtracking here is extremely weak. The sense of progress on the part of survey respondents becoming more confident about the future is clearly the prevalent feature here. The December reading for unemployment in fact has only a 2.5 percentile standing, indicating extremely weak concerns about the prospects of unemployment ahead despite the minor month-to-month step-back.
Major Household purchase environment The environment for making major household purchases deteriorates slightly in December at -15 compared to -13 in November. This only puts the index back to where it was in October. The response to the question, ‘is it favorable to buy at present’ is unchanged from its November value at -19 and it has been stuck there for three months in a row. The outlook to make major household purchases in the next 12-months logs a weaker reading at -15 than its 12-month value of -13but is stronger than its 12-month level of -18. The reading for the ‘favorable to buy at present’ question, however, is weaker at a -19 compared to -14, logged 12-months ago. The environment for making a household purchase over the next 12-months has a 55.6 percentile ranking which is above its median, however, the assessment of ‘favorable to buy at present’ has only a 20th percentile standing significantly below its median reading (median readings occur at a ranking of 50%)..
The Financial situation The financial situation for the next 12-months is assessed weaker at -3 in December, compared to zero in November; it compares to a - 2 in October. The assessment 12-months ago was also -2 so this is a very minor deterioration comparing the financial situation of households with the last 12-months produces another deterioration at -8 in December compared to -6 in November and that compares to 12-months ago at -5 another deterioration. However, the backward-looking assessment has a 52-percentile standing which is above its median while the outlook reading of -3 has a 23-percentile standing which puts it in the lower quarter of all expectations on data back to 1991. The current situation is appraised at 20 a step-back from November and October levels as well as from 12-months ago. But the current appraisal also has a queue standing in its 65.7 percentile which has a comfortable margin above its median reading. Households clearly have concerns about their financial situation even though their outlook for making household purchases is above median and their concerns about unemployment are low. Currently, conditions appear to be construed as solid.
Savings Household savings over the next 12-months are weaker in December at a reading of 20 compared to 26 in November; they are closer to their 12-month ago reading of 21. December is still a relatively high reading, in any event, with a 91-percentile standing. The question, ‘is it favorable to save at present’ is unchanged in November compared to December at a reading of -28 although it is weaker than it was 12-months ago and the percentile standing at its 78th percentile, again, a firm reading for this metric.
Summing up - assessment The consumer confidence reading from the Belgian National Bank this month shows a slight set back month-to-month, however, there is a significant an improvement that has been underway that is quite clear from the chart. The concerns that consumers have seemed to be about their financial situation haven't translated into concerns about unemployment or their willingness to make major household purchases, with unemployment concerns very low and their willingness to make household purchases for the period ahead at essentially normal levels. Still, there is more concern about inflation that is percolating, which is interesting considering that overall inflation has been relatively stable and muted in the European monetary area.
 Global| Dec 18 2025
Charts of the Week: The Upside Risks
This marks our final Charts of the Week publication for 2025 The next edition will be released on Thursday 8 January.
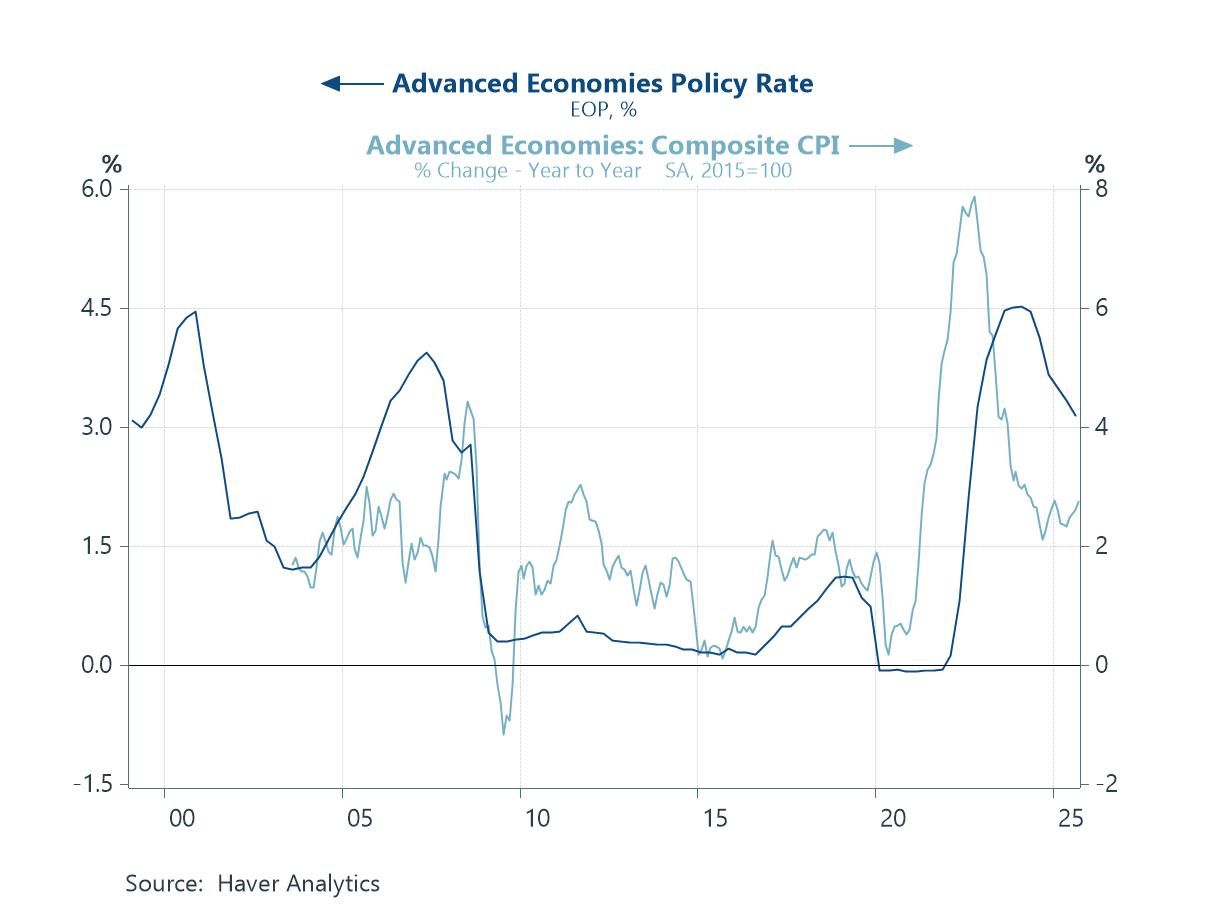
Last week’s Charts of the Week focused on the darker tail risks hanging over the 2026 outlook: the possibility of monetary policy mis-calibration, that geopolitics and trade fragmentation further disrupt supply chains, and that elevated debt levels—particularly in the public sector—reassert themselves as a drag on growth. This week’s charts take a deliberately different tack. Taken together, they highlight a set of upside risks that are possibly underappreciated in current forecasts. For example, policy easing across advanced economies may extend further than expected as disinflation feeds on itself (chart 1); oil prices could surprise on the downside as inventories rebuild (chart 2); US productivity may deliver incremental but meaningful gains sooner than assumed (chart 3); the US economy itself could continue to benefit from an absence of private-sector financial stress (chart 4); India’s growth momentum might firm again as inflation pressures recede (chart 5); and, more broadly, parts of the Global South appear increasingly capable of generating their own demand impulse, supported by favourable demographics and income growth (chart 6). None of these forces is guaranteed, and each carries its own caveats—but together they suggest that, having spent much of the past year fixated on downside risks, the risks to global growth in 2026 may be more evenly balanced than is widely assumed.
by:Andrew Cates
|in:Economy in Brief
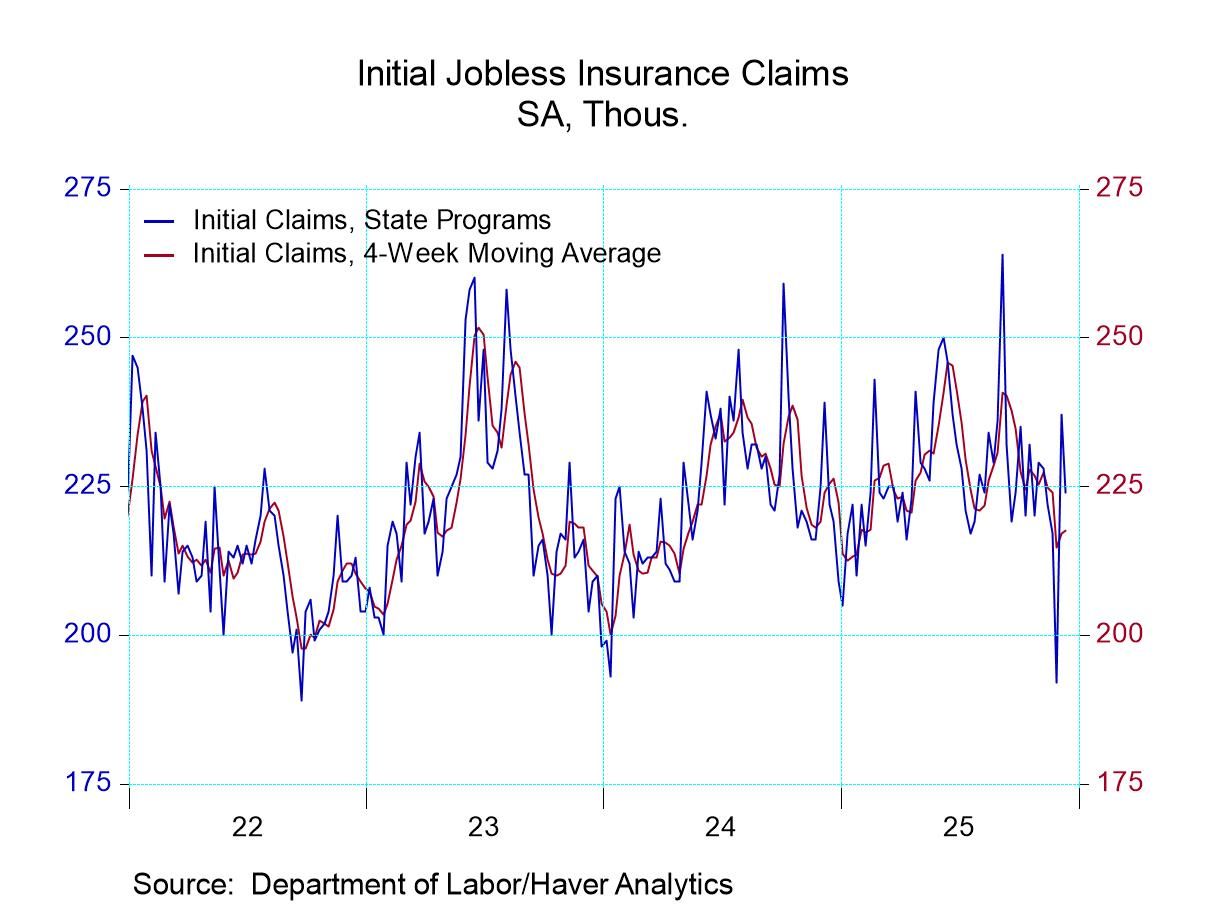
- Initial claims dropped from the prior week.
- Continuing claims rebounded from the prior week sharp decline.
- The insured unemployment rate was unchanged.
 USA| Dec 17 2025
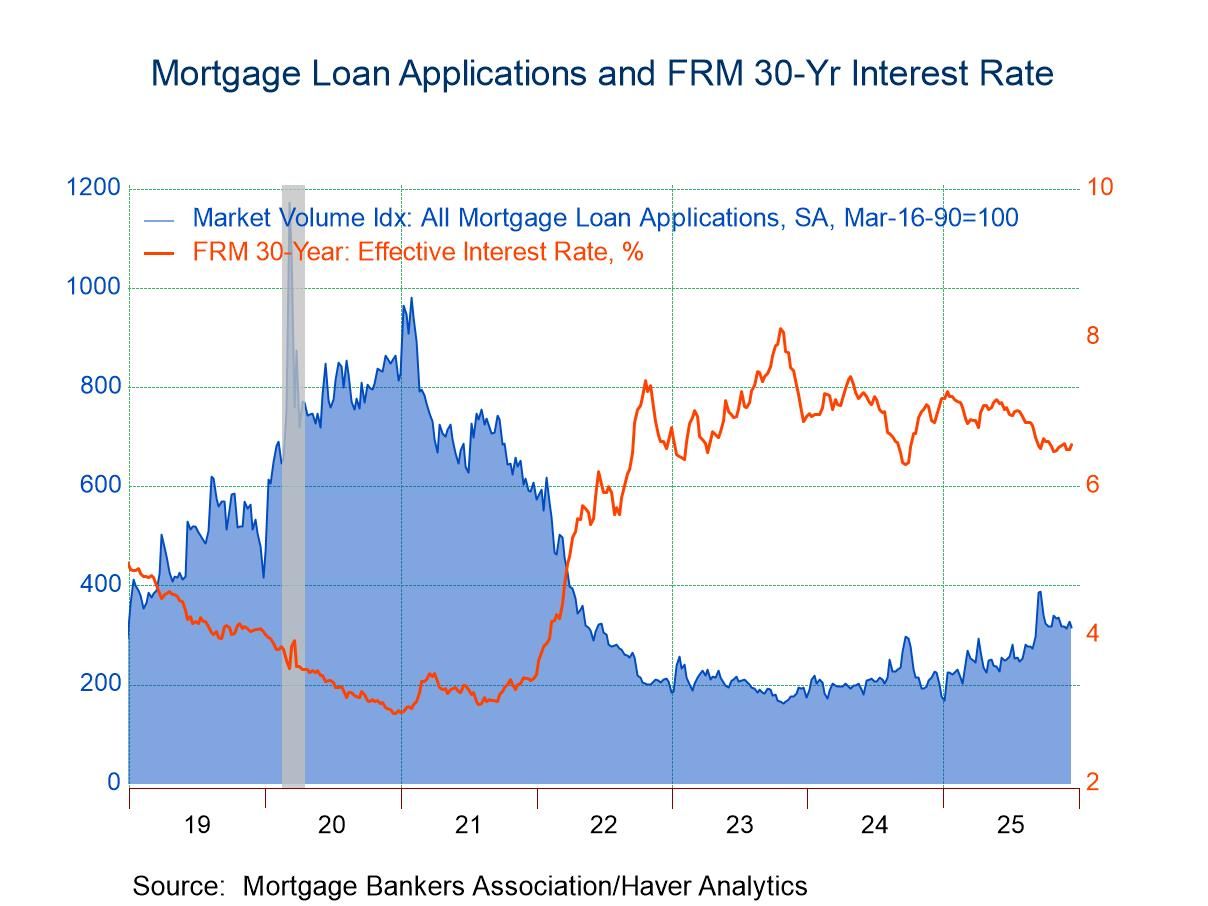
U.S. Mortgage Applications Retreated in the Week of December 12
- Purchase applications fell 2.8% w/w; refinancing loan applications fell 3.6% w/w.
- Effective interest rate on 30-year fixed loans rose to 6.56%.
- Average loan size rose moderately.
 United Kingdom| Dec 17 2025
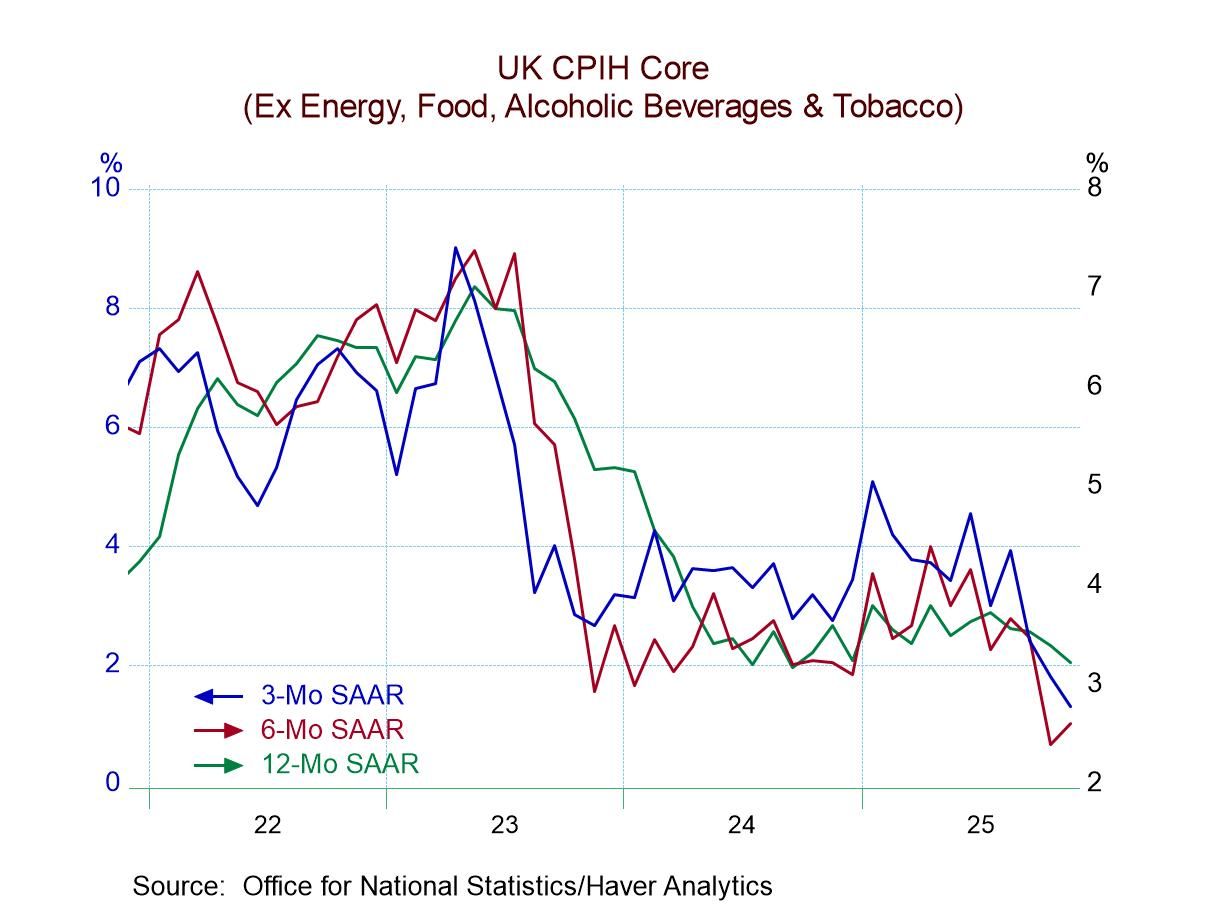
U.K. Inflation Moderates Open Door for BOE Rate Cut
U.K. inflation has moderated in November, posting a 0.1% drop on the HICP, a 0.1% gain in the CPI-H headline measure as well as a 0.1% gain in the CPI-H core (excluding energy, food, alcohol, and tobacco). The sequential trend in core inflation points lower and is eroding but continues to run over the 2% mark set as a target by the Bank of England for overall inflation (over 12 months). The headline is excessive as well but also eroding.
Sequentially the CPI-H gains 3.5% over 12 months, slows to a 2.8% annual rate over six months and then dips to 1.4% annual rate over three months. The CPI-H core rises by 3.6% over 12 months, ticks down to a 3.0% pace over six months, and then runs at a 2.4% annualized pace over three months.
The trend for the CPI core, and for the headline, both are quite good and would be completely consistent with the Bank of England cutting rates, a move that is widely expected – although the 12-month pace for each is excessive.
Not only is inflation showing signs of falling into the Bank of England's target zone, but the economy has been weak although the unemployment rate currently is only hovering around the 4% mark. Still, recent economic data have been weak, and the recent monthly GDP report posted a negative reading, further unsettling the outlook. The October monthly GDP change was estimated at -0.1% while the year-over-year increase in GDP in October produced a gain of just 1.1%. These metrics have put the U.K. economy on recession watch at a time when there has been a sharp revision in the budget process that will be much more constrictive. A sharp pullback in the manufacturing of motor vehicles is blamed for the sudden weakness in GDP in October. The three-month drop in GDP is the first such drop since December 2023.
Meanwhile, the headline and the core inflation statistics are progressing. The table calculates breadth statistics on how widespread inflation acceleration has been and we see that it has not been prevalent (over 50%) in September or November, although breadth did touch the 58% mark in October. Sequentially, inflation acceleration has been tamed: over 12 months (when it is neutral), six months, and three months. Over 12 months, inflation accelerated in only 50% of the categories. And inflation according to the CPI headline and in the core over six months continues to show deceleration to accompany narrowing breadth - only 8.3%. That reading indicates that there was more inflation deceleration than acceleration by a wide margin over six months. At 50%, inflation acceleration and deceleration forces are balanced. Readings below 50% indicate relatively more deceleration, and that is now the more common condition. Inflation acceleration is extremely rare across categories over six months and three months.
 USA| Dec 16 2025
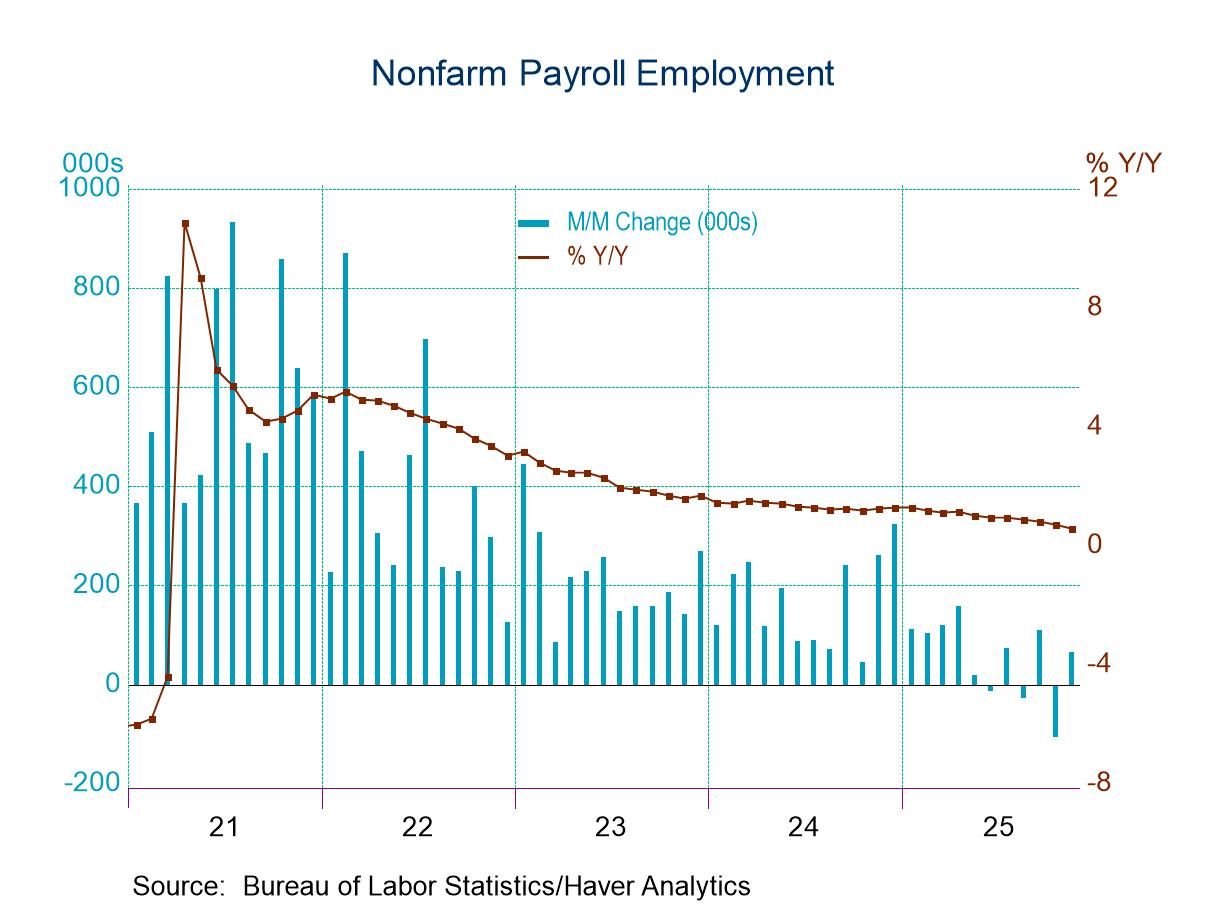
U.S. Employment and the Unemployment Rate Rose in November
- Total payrolls rose 64k in November but fell 105k in October
- The October decline was more than accounted for by a 157k decline in government employment
- The unemployment rate jumped to 4.6% in November from 4.4% in September.
- There were no household survey data collected for October.
by:Sandy Batten
|in:Economy in Brief
- of2724Go to 42 page