Haver Analytics
Haver Analytics

Economy in Brief

  • Headline inflation in the euro area appears to be disciplined as it rose by 0.1% in June after rising 0.2% in May. Headline inflation is up 2.5% over 12 months, up to a 2.9% annual rate over six months but then simmers back down to a 1.8% annual rate over three months. There's some volatility there, but the three-month inflation rate is reassuring. However, is that what the ECB is really looking at?

    Rotten in the core? The core inflation rate is an entirely different animal in June. It rose by 0.4% in June, it rose by 0.3% in May, and it rose by 0.4% in April. None of these month-to-month increases is acceptable. Looking at the performance of the core rate sequentially, the core is up by 2.9% over 12 months, it's up at a 3.2% annual rate over six months, and then it accelerates further to a 4.1% pace over three months. Each of these profile rates, taken on its own, is too-high; but the sequence taken together is even more disturbing because it shows that core inflation is too high and accelerating, from just short of 3% to just over 4% as the venue shifts from a 12-month calculation to a three-month calculation.

    Inflation in the large economies of the EMU and in the U.K. The four largest economies in the monetary union show headline inflation is generally not behaving. Germany, France, and Italy each show that inflation is increasing over three months compared to six months; while in two of those cases the six-month inflation rate fell compared to the 12-month inflation rate, the three-month inflation rate in each of these countries is higher than its 12-month counterpart. The three-month inflation rate in Germany runs at 5.4% compounded, in France at 3.5%, and an Italy at 3%. Among the largest four economies, the only one with inflation behaving is Spain where the 12-month inflation rate is 3.6%; then it drops to 2.9% over six months and logs a three-month pace of inflation at 1.7%. This is another disturbing sequence of numbers for the ECB. By comparison, nonmember U.K. shows headline inflation low and decelerating.

    Core inflation is slightly excessive Core inflation shows inflation has accelerated in France and Italy relative to its 12-month pace. For France, the three-month core inflation rate is at 2.6%, up from 1.9% over 12 months; in Italy, the core is at a 2.8% pace over three months, up from 2.1% over 12 months. Spain shows inflation behaving at 2.1% over three months compared to 3% over 12 months. Germany shows ex-energy inflation behaving at 2.1% over three months, compared to 2.6% over 12 months. Nonmember U.K. shows a core inflation pace up to 3.6% over three months after a six-month lull and a 3.5% pace over 12 months.

    Role and goal of the ECB Of course, the ECB targets inflation for the entire European Monetary Union (EMU) and is not particularly interested in the inflation performance in any specific country compared to the performance of the union. However, since we have country specific information, just as it's interesting to look at that inflation as at inflation across commodity categories. When we do this, we find that inflation is either not well behaved in its headline or not behaved in its core form. So the details are not confirming that overall inflation is behaving the way it ought to. And, as noted above, when we look at the headline, inflation appears to be behaving, but when we look at the EMU-wide core rate, which excludes the volatile food and energy components, we see a very different picture. The core is accelerating and running at a 4.1% annual rate over three months, approximately twice the target that the ECB has for inflation.

    So where do the ECB policy trade-offs stand? These calculations raise question marks about whether the ECB is really close to cutting interest rates in this cycle or not. There's been a lot of talk about cutting interest rates; there's a lot of talk from the U.S. about cutting interest rates as well. We include the U.K. inflation rates in this table and U.K. core inflation appears to be stuck, stubborn, and possibly even accelerating. Having central banks that want to engage in a policy in which they cut interest rates, puts policy in a dangerous spot. They need to know cuts are fully supported by the underlying inflation dynamics. Neither the U.K. nor the ECB seem to be on very solid footing on that score. In the case of the U.S., inflation is beginning to trend in that direction but it hasn't firmly established the trend for the headline and core especially not for CPI as well as PCE rates. Of course, when we switch our gears to talk about the Federal Reserve, the targeted inflation rate is the PCE and not the CPI. Fed Chair Powell in the U.S. has recently referred to this and confirmed that the Fed's target is the PCE; however, he has also noted the unusual decoupling of the PCE rate from the CPI rate. Were the Fed to cut interest rates at a time that the PCE is behaving and the CPI is not, there's a good chance that could create some blowback in the markets. Whether we look at the U.S. or Europe, we see a good deal of policy dissonance.

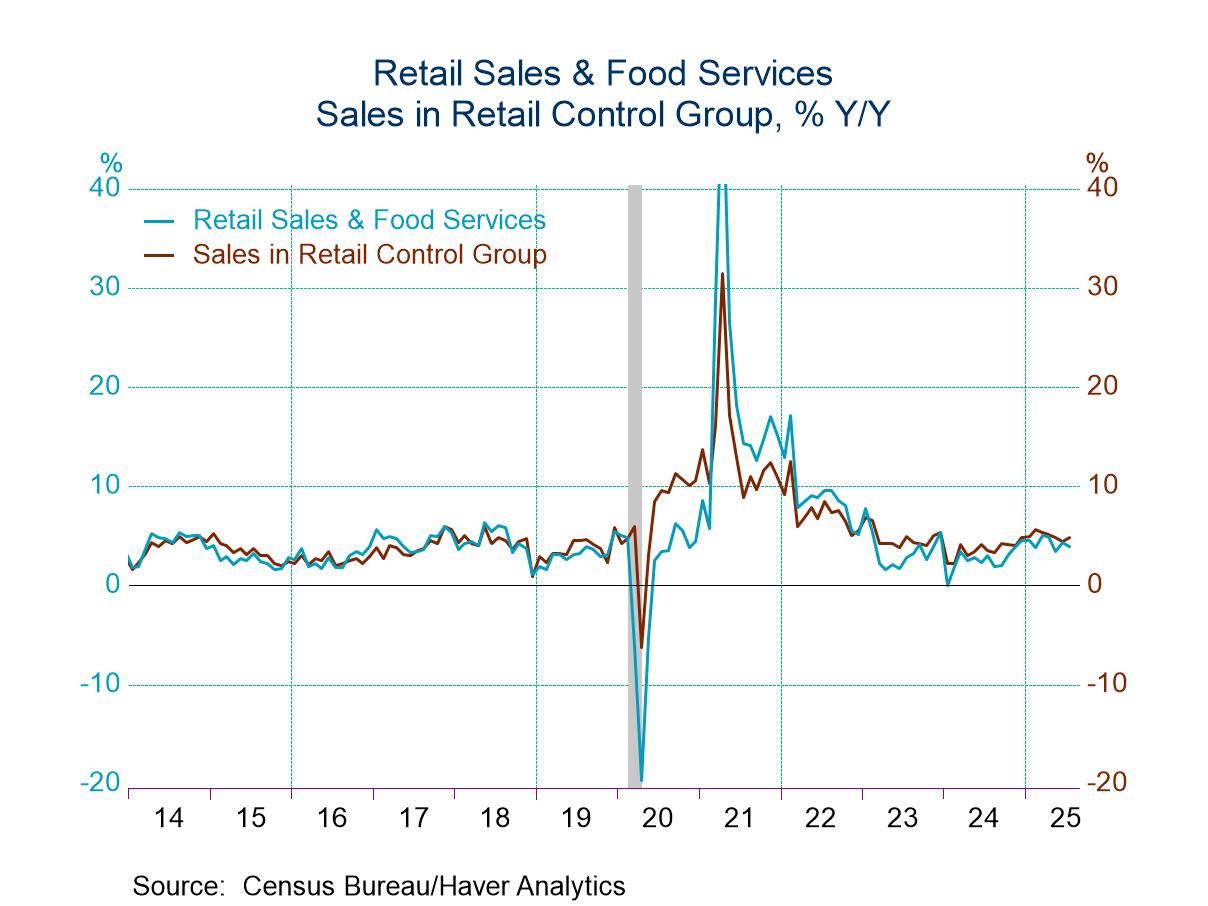
    • Core spending continues to improve.
    • Nonstore sales surge for a second straight month.
    • Overall sales improvement held back by lower vehicle and gasoline station sales.
    • Overall index stands at lowest level this year.
    • Each component remains weak.
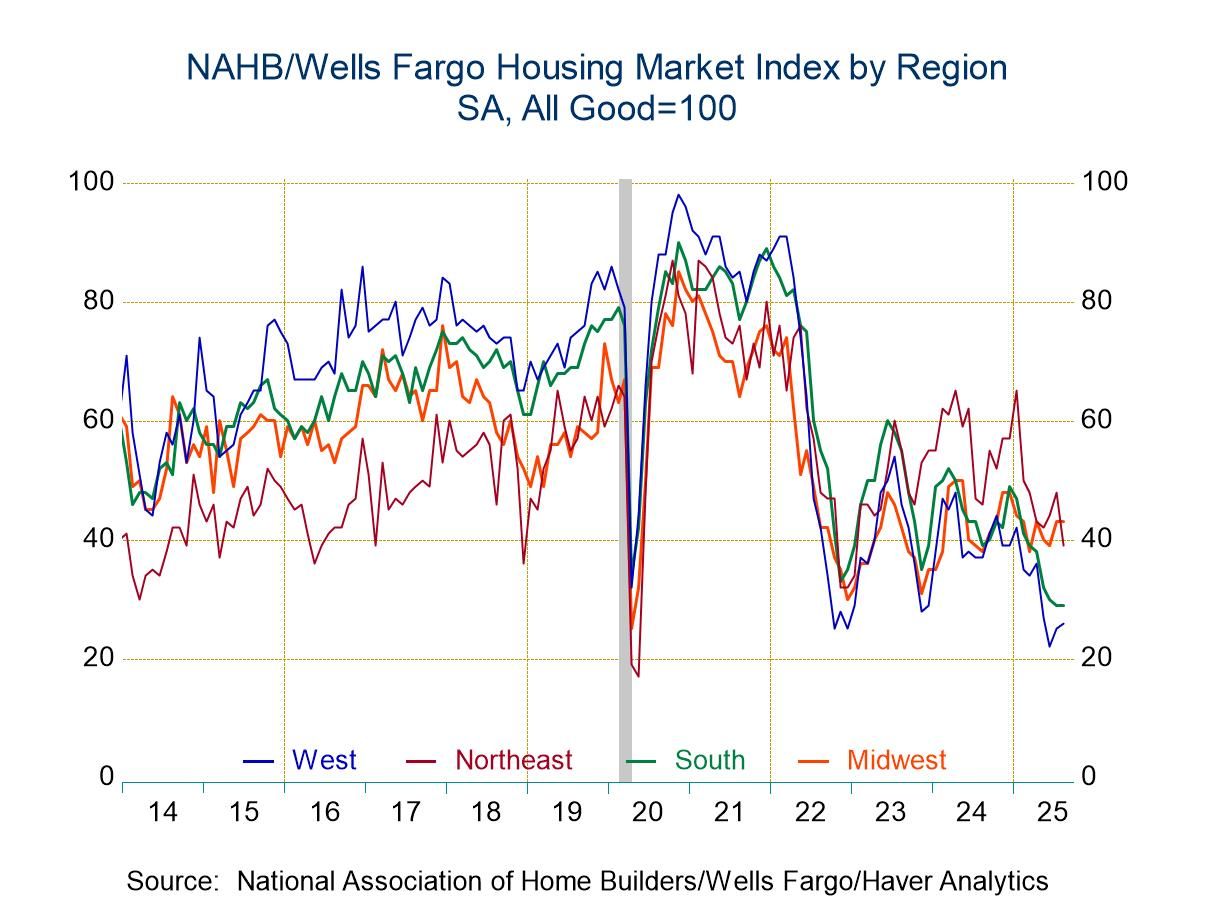
    • Regional indexes diverge.
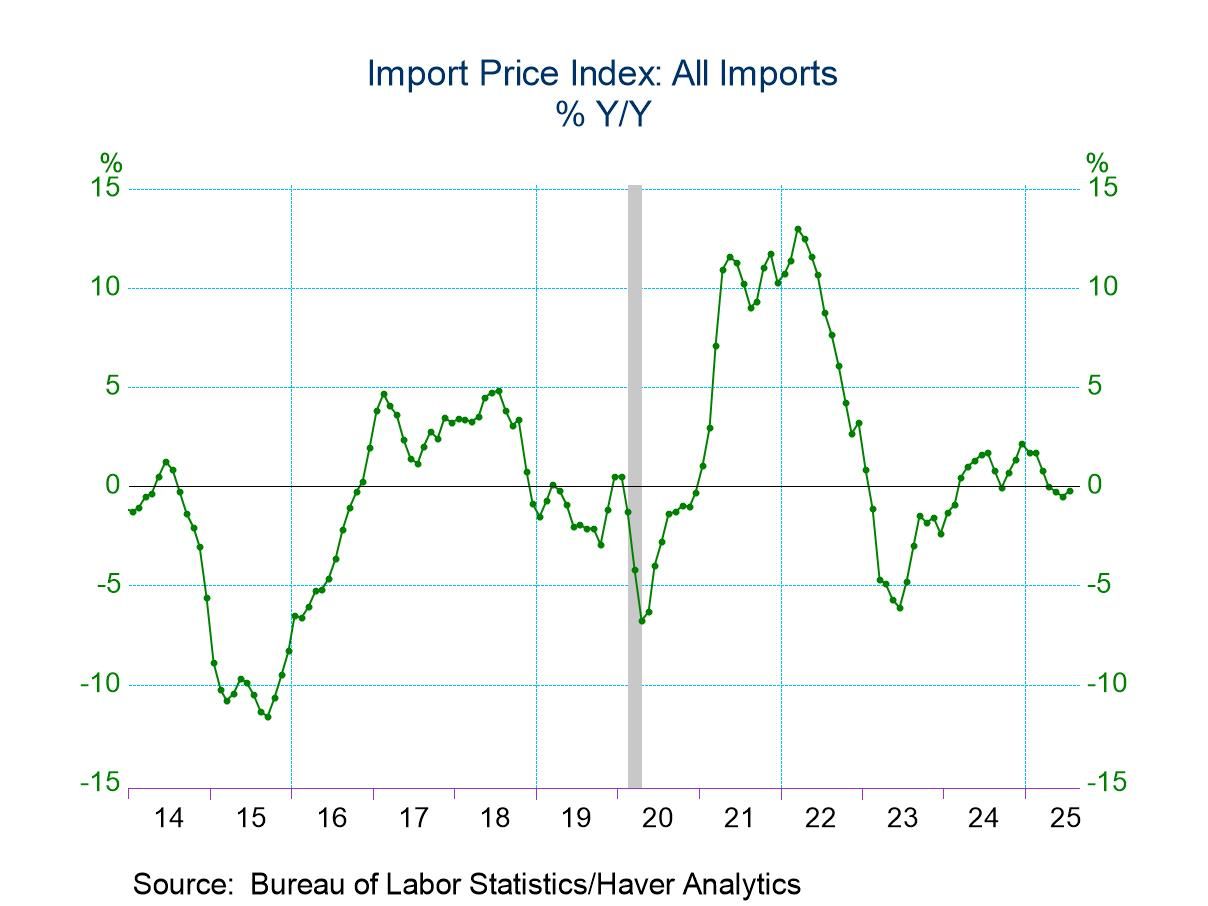
    • Import prices 0.0% (1.6% y/y) in June vs. -0.2% (+1.4% y/y) in May, reflecting a 1.0% m/m drop in imported fuel prices.
    • Excluding fuels, import prices rise 0.2%, up for the seventh time in eight months.
    • Export prices fall 0.5% (+0.7% y/y), led by a 0.6% m/m decline in nonag export prices.
    • Year-on-year import & export price growth rates rise modestly.
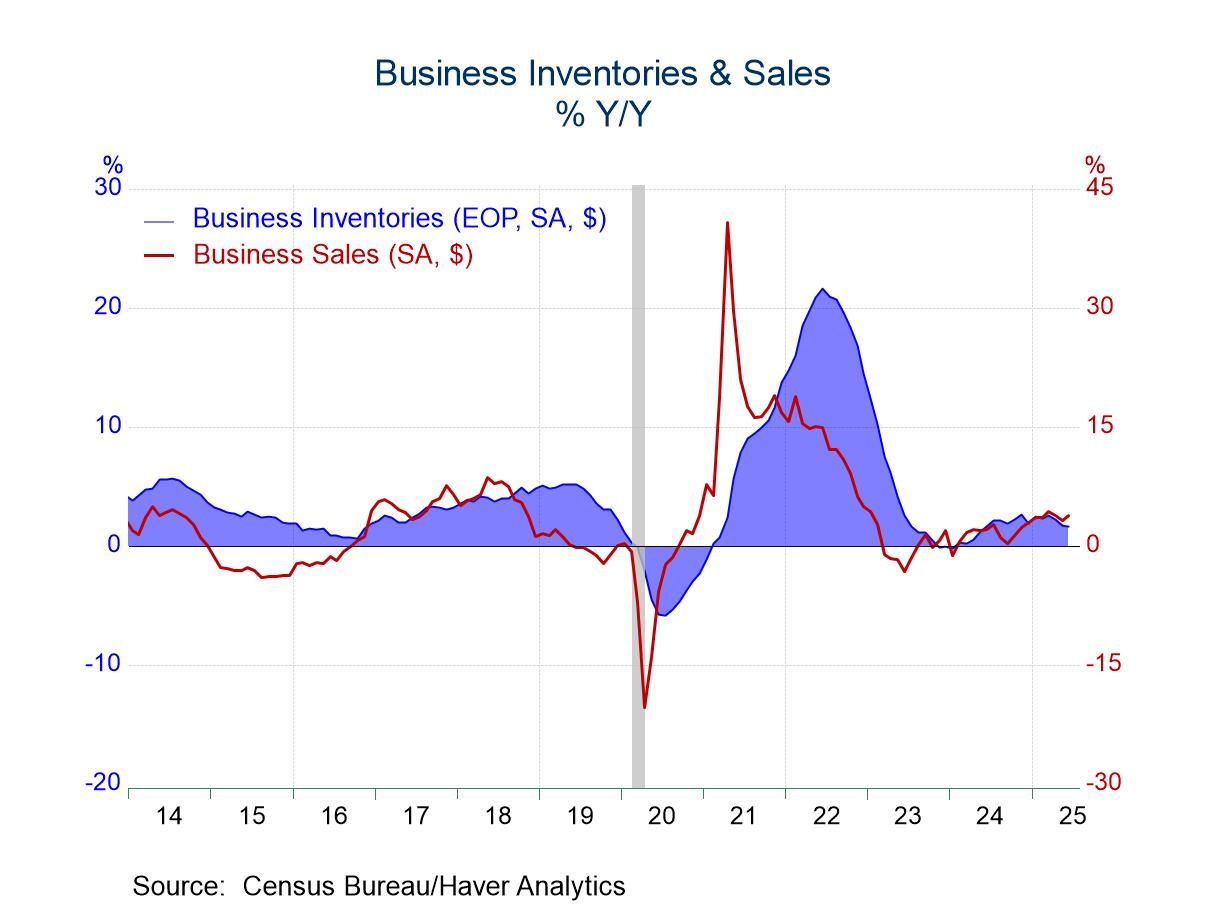
    • Retail inventories up 0.6%, led by motor vehicles.
    • Business sales flat in May as manufacturers’ shipments fell.
    • Overall inventory/sales ratio unchanged for a fourth month.
  • EMU trade trends show a decline in both exports and imports in May; exports fall harder than imports. Exports decline in May, but log a small increase over six months; they are generally contracting or weak on all horizons. Contrarily, imports fall over 12 months, then step up to grow by 2.3% over six months and even faster growing at a 7.2% annual rate over three months.

    We can divide export trends into manufactured goods vs. nonmanufactured goods. Manufacturing exports fall over three months, six months, and 12 months. The declines are in a rough range of -1.5% to -2.5%, annualized. Exports of nonmanufactured goods grow over all horizons but are also slowing steadily from 9.9% over 12 months to 4.6% at an annual rate over three months.

    On the import side of the ledger, manufacturing imports are gaining pace and accelerating. Growth logs -8.1% over 12 months, then registers at a -1.8% annual rate over six months before imports break out to grow at a 5.5% annual rate over three months. Imports of nonmanufactured goods have generally stepped up from a 1.8% growth rate over 12 months to a 12.9% pace over six months then stepping back to a still-strong 11% annual rate over three months.

    Export and import data for the EMU is for the region’s trade with areas outside of the EMU. All intra-community trade is netted out. The strength in imports suggests that some recovery may be afoot in the community with both imports of manufactured and nonmanufactured goods improving. Exports, on the other hand, show that the EMU export markets may still be quite weak since manufacturing exports are widely contracting and exports of nonmanufactured goods are slowing. Both hint at demand weakness.

    Select data for a few European economies show German exports and imports both declining and both decelerating. France shows a tendency for imports to slide as its exports gain footing and accelerate. U.K. exports and imports are transitioning from declines over 12 months to increases over three months. Export data show a slippage with growing declines and weakness for Finland and Portugal. In contrast, Belgian exports are gathering strength and accelerating modestly, sequentially.

    Trade trends show mixed results with manufacturing data underlining ongoing weakness while manufacturing imports are growing at a stepped-up, strong pace. The EMU trade balance has been relatively steady over 12 months, six months, and three months. The balance on manufactured goods is exceptionally steady at a surplus of €37bln to €39bln. The balance on nonmanufacturing trade has been steady over 12 months, six months and three months at €23bln.

  • In this week's newsletter, we explore shifts in trade patterns across Southeast Asia. Our analysis reveals considerable changes in the region's export landscape, both in terms of destination markets and product composition. Economies like Vietnam and Thailand are now proportionally increasing their exports to the US, whereas Indonesia has seen a marked rise in shipments to China. Further investigation into ASEAN-6 exports highlights a growing dominance of electronic and electrical products, barring Indonesia. This trend reflects both the current upswing in the electronics cycle and deliberate strategies by regional economies to capitalize on heightened global demand, including for semiconductors.

    We also delve deeper into Vietnam, where gains stem from global supply chain shifts and deepening economic integration with China, its geographical neighbour. Our focus then shifts to Indonesia, emphasizing its unique reliance on commodity exports within the ASEAN-6, particularly in its trade relations with China. Lastly, we examine labour and productivity dynamics within the ASEAN-6. We discuss potential challenges arising from rising labour costs, which could impact regional competitiveness. Conversely, we also highlight substantial productivity advances in Vietnam, which contrast with slower progress seen in peers such as Thailand.

    Trade shifts by export destination and product The global trade landscape continues to evolve, even in Southeast Asia. Chart 1 illustrates how the trade destination mix among Southeast Asian economies has undergone significant changes compared to the pre-pandemic era. For one, economies such as Thailand and Vietnam have experienced a substantial increase in their share of exports to the US since late 2019. Equally noteworthy, Indonesia has seen a surge in its exports to China during this period. Interestingly, Vietnam and Singapore have also shown an uptick in their share of exports to China, albeit to a lesser degree. These trends challenge, at least for ASEAN-6 economies, narratives of trade diversification away from China. Moreover, the importance of exports to the EU and Japan has declined for the region in recent years.

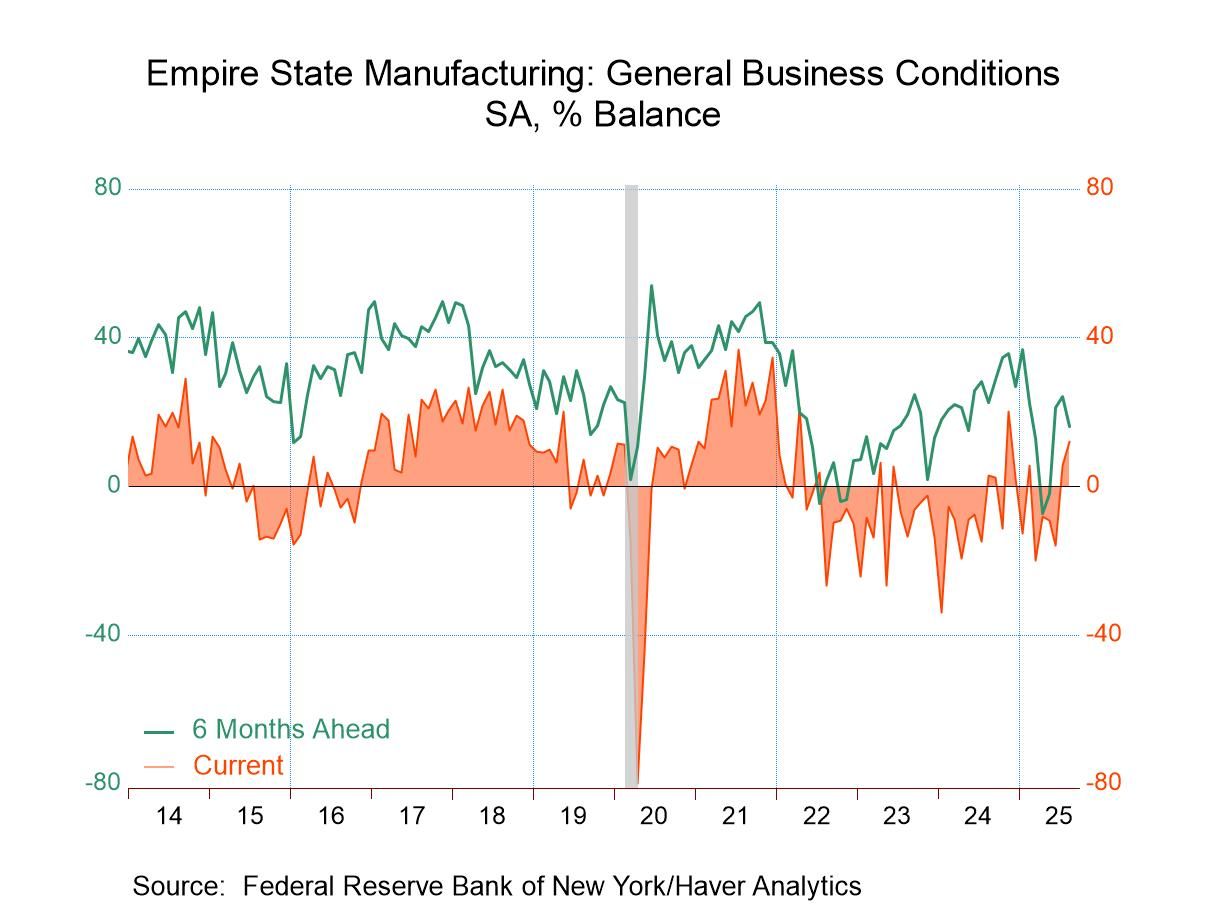
    • Negative reading indicates slightly greater rate of contraction.
    • Inventories & order backlogs decline while new orders, shipments & employment edge higher.
    • Prices paid rise slightly but prices received ease.
    • Expectations decline but upward trend remains in place.